. 2020 Dec 22;117(51):32764-32771.
doi: 10.1073/pnas.2009911117. Epub 2020 Dec 1.

Awareness-driven behavior changes can shift the shape of epidemics away from peaks and toward plateaus, shoulders, and oscillations

Affiliations

Awareness-driven behavior changes can shift the shape of epidemics away from peaks and toward plateaus, shoulders, and oscillations

Joshua S Weitz et al. Proc Natl Acad Sci U S A. .

Abstract

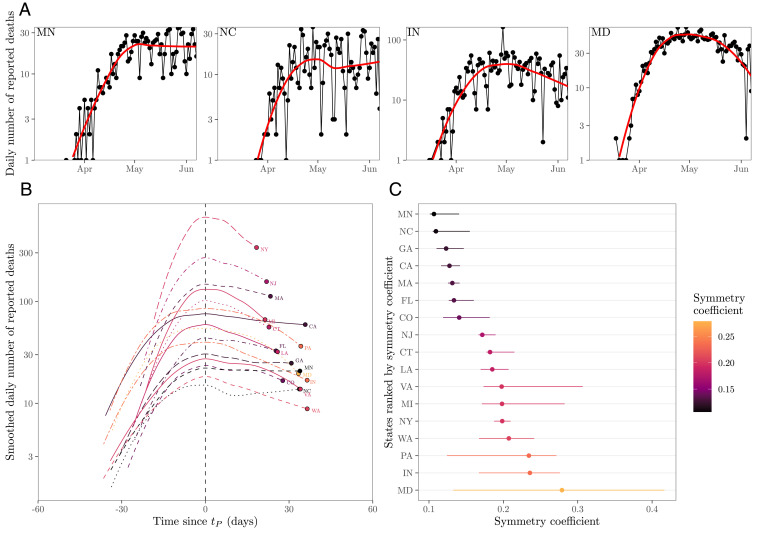
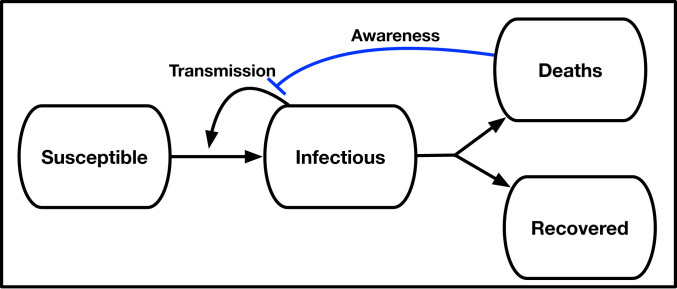
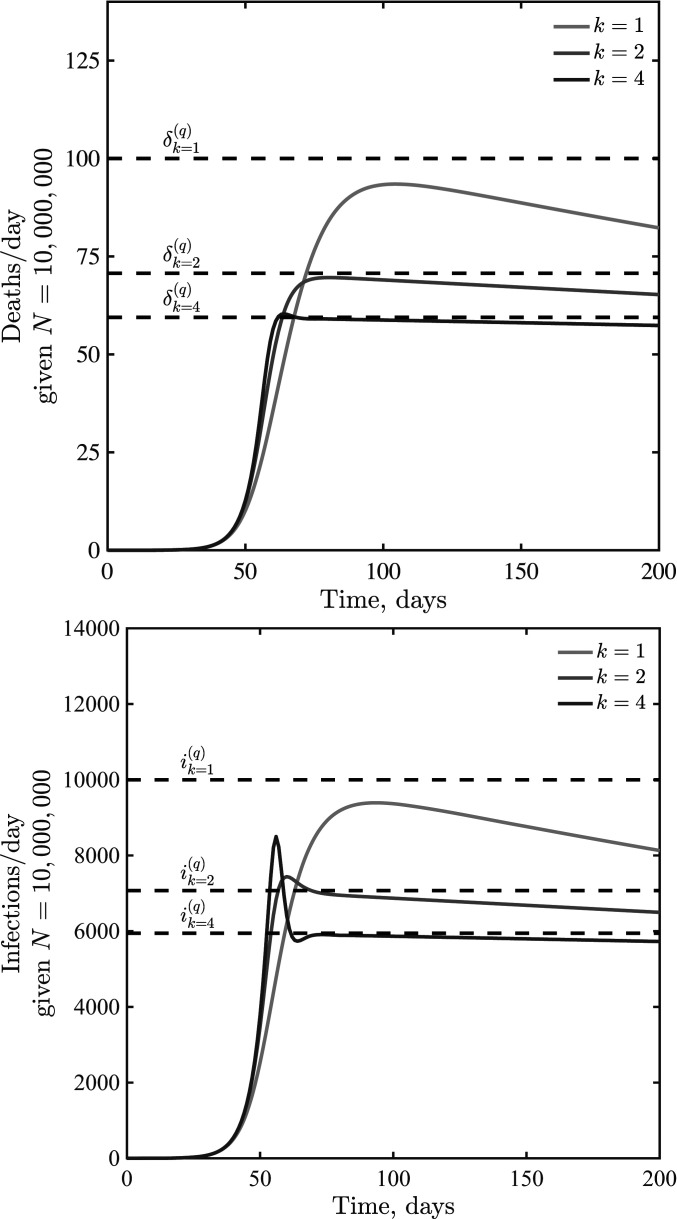
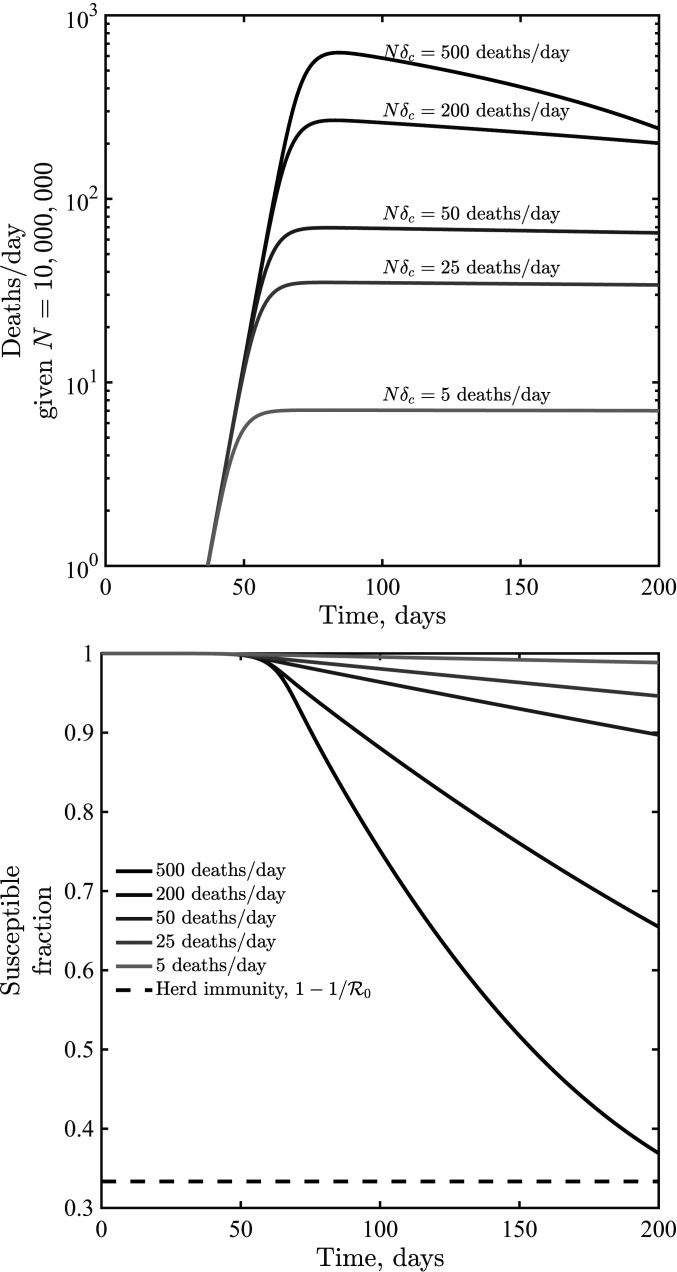
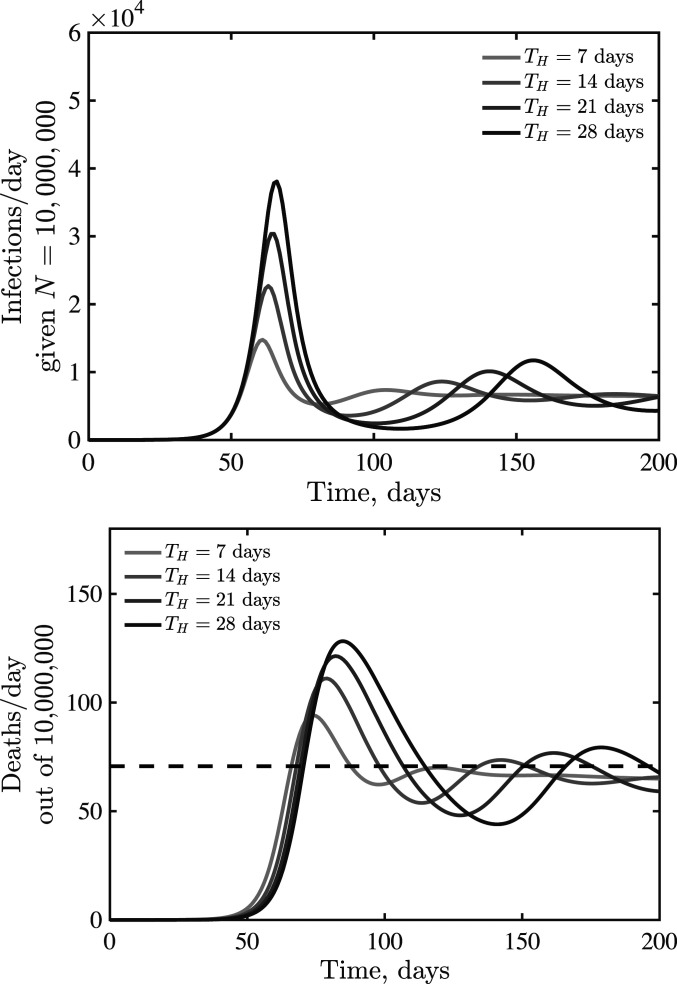
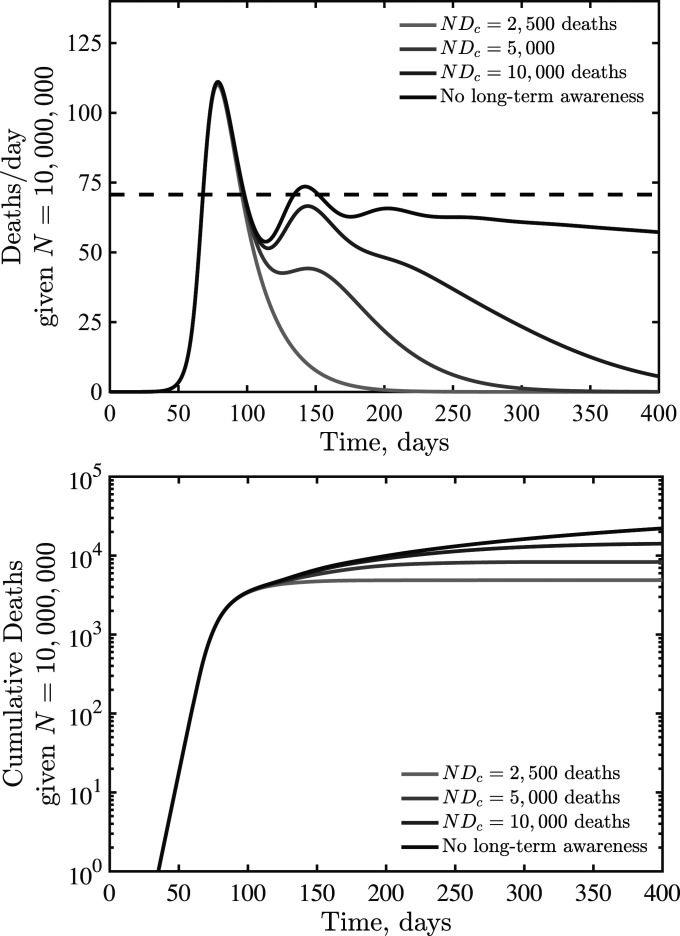
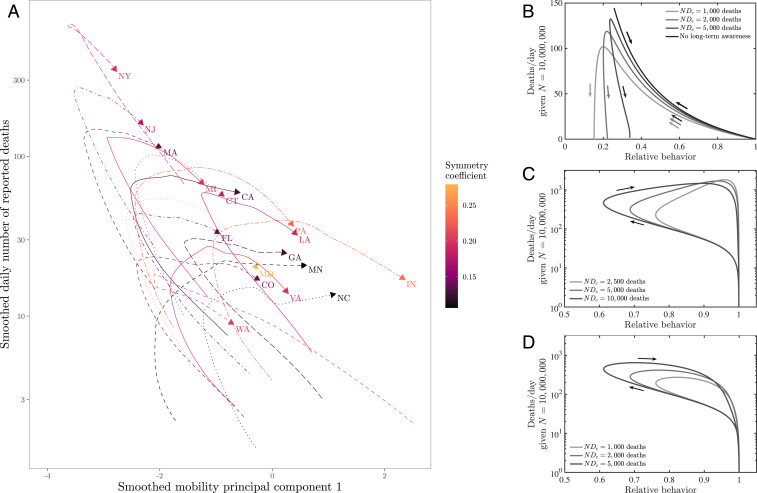
The COVID-19 pandemic has caused more than 1,000,000 reported deaths globally, of which more than 200,000 have been reported in the United States as of October 1, 2020. Public health interventions have had significant impacts in reducing transmission and in averting even more deaths. Nonetheless, in many jurisdictions, the decline of cases and fatalities after apparent epidemic peaks has not been rapid. Instead, the asymmetric decline in cases appears, in most cases, to be consistent with plateau- or shoulder-like phenomena-a qualitative observation reinforced by a symmetry analysis of US state-level fatality data. Here we explore a model of fatality-driven awareness in which individual protective measures increase with death rates. In this model, fast increases to the peak are often followed by plateaus, shoulders, and lag-driven oscillations. The asymmetric shape of model-predicted incidence and fatality curves is consistent with observations from many jurisdictions. Yet, in contrast to model predictions, we find that population-level mobility metrics usually increased from low levels before fatalities reached an initial peak. We show that incorporating fatigue and long-term behavior change can reconcile the apparent premature relaxation of mobility reductions and help understand when post-peak dynamics are likely to lead to a resurgence of cases.

Keywords: control; epidemics; epidemiology; nonlinear dynamics; public health.


Conflict of interest statement

The authors declare no competing interest.

Figures

Fig. 1.
Fig. 1.
Plateaus and shoulder-like dynamics in COVID-19 fatalities. (A) Examples of daily number of reported deaths for COVID-19 (black points and lines) and the corresponding LOESS curves (red lines) in four states, including two estimated to be the most plateau-like (Minnesota and North Carolina) and two estimated to be the most peak-like (Indiana and Maryland). Daily number of deaths is smoothed in log space, only including days with one or more reported deaths. We restrict our analysis to states in which the peak smoothed death is greater than 10 as of June 7, 2020 (resulting in 17 states in total). (B) Smoothed daily number of reported deaths centered around the first peak time tP across 17 states. Smoothed death curves are plotted between tPΔt and tP+Δt, where Δt is defined such that smoothed death at time tPΔt corresponds to 10% of the smoothed peak value. (C) Measured symmetry coefficient and CIs. Symmetry coefficient is calculated by dividing the death value at time tPΔt by the death value at time tP+Δt. If the death curve is symmetric, the symmetry coefficient should equal 1. CIs are calculated by bootstrapping across the date of deaths for each individual 1,000 times and recalculating the symmetry coefficient (after smoothing each bootstrap time series). LOESS is performed by using the loess function in R.
Fig. 2.
Fig. 2.
Schematic of an SEIR model with awareness-driven social distancing. Transmission is reduced based on short- and/or long-term awareness of population-level disease severity (i.e., fatalities).
Fig. 3.
Fig. 3.
Infections and deaths per day in a death-awareness–based social distancing model. Simulations have the epidemiological parameters β=0.5 days−1, μ=1/2 days−1, γ=1/6 days−1, and fD=0.01, with variation in k=1, 2, and 4. We assume Nδc=50 per d in all cases.
Fig. 4.
Fig. 4.
Dynamics given variation in the critical fatality awareness level, δc, for awareness k=2. Shown are deaths per d (Top) and the susceptible fraction as a function of time (Bottom), the latter compared to a herd immunity level when only a fraction 1/R0 remain susceptible. These simulations share the epidemiological parameters β=0.5 days−1, μ=1/2 days−1, γ=1/6 days−1, and fD=0.01.
Fig. 5.
Fig. 5.
Emergence of oscillatory dynamics in a death-driven awareness model of social distancing given lags between infection and fatality. Awareness is k=2, and all other parameters are as in Fig. 3. The dashed lines are for fatalities expected quasi-stationary value δ(q).
Fig. 6.
Fig. 6.
SEIR dynamics with short- and long-term awareness. Model parameters are β=0.5 days−1, μ=1/2 days−1, γ=1/6 days−1, TH=14 d, fD=0.01, N=107, k=2, and Nδc=50 per day (short-term awareness), with varying NDc (long-term awareness) as shown in the legend. The dashed line (Top panel) denotes δ(q) due to short-term distancing alone.
Fig. 7.
Fig. 7.
Phase plane visualizations of deaths vs. mobility for (A) state-level data and (BD) SEIR models. (A) Deaths and mobility indexes through time for the 17 analyzed states. Both data series are smoothed. Time windows as in Fig. 1. Here, the first mobility principal component represents a proxy for behavior, with positive values associated with higher mobility (see Methods). (B) Dynamics of effective behavior and death rates in an SEIR model with short- and long-term awareness. Curves denote different assumptions regarding long-term awareness, in each case β=0.5 days−1, μ=0.5 days−1, and γ=1/6 days−1, such that R0=3, with k=2, γH=1/21 days−1, and fD=0.01. The short-term awareness corresponds to Nδc=50 deaths per day. Thin lines denote full dynamics over 400 d; thick lines denote the dynamics near the case fatality peak. (C) Dynamics of effective behavior and death rates in an SEIR model with awareness and fatigue. The three different curves denote different assumptions regarding long-term awareness; in each case, β=0.5 days−1, μ=0.5 days−1, γ=1/6 days−1, such that R0=3, with k=2, γH=1/21 days−1, fD=0.01, and ϵ=1/7 days−1. The short-term awareness corresponds to Nδc=50 deaths per day. The force of infection does not include long-term changes in behavior beyond mobility, that is, g(D)=1. (D) As in C, but the force of infection includes long-term changes in behavior, that is, g(D)=1/(1+(D/Dc)k).

Update of

References

    1. IHME COVID-19 health services utilization forecasting team , C. J. Murray, Forecasting COVID-19 impact on hospital bed-days, ICU-days, ventilator-days and deaths by US state in the next 4 months. medRxiv:10.1101/2020.03.27.20043752v1 (30 March 2020). - DOI
    1. Bregman D. J., Langmuir A. D., Farr’s law applied to AIDS projections. JAMA 263, 1522–1525 (1990). - PubMed
    1. Ferguson N. M., et al. , Impact of non-pharmaceutical interventions (NPIs) to reduce COVID-19 mortality and healthcare demand. https://www.imperial.ac.uk/mrc-global-infectious-disease-analysis/covid-.... Accessed 19 November 2020. - PMC - PubMed
    1. Kucharski A. J., et al. , Early dynamics of transmission and control of COVID-19: A mathematical modeling study. Lancet Infect. Dis. 20, 553–558 (2020). - PMC - PubMed
    1. Kissler S. M., Tedijanto C., Goldstein E., Grad Y. H., Lipsitch M., Projecting the transmission dynamics of SARS-CoV-2 through the post-pandemic period. Science 368, eabb5793 (2020). - PMC - PubMed

Publication types