. 2020 Dec 29;133(24):jcs245571.
doi: 10.1242/jcs.245571.

Sec71 separates Golgi stacks in Drosophila S2 cells

Affiliations

Sec71 separates Golgi stacks in Drosophila S2 cells

Syara Fujii et al. J Cell Sci. .

Abstract

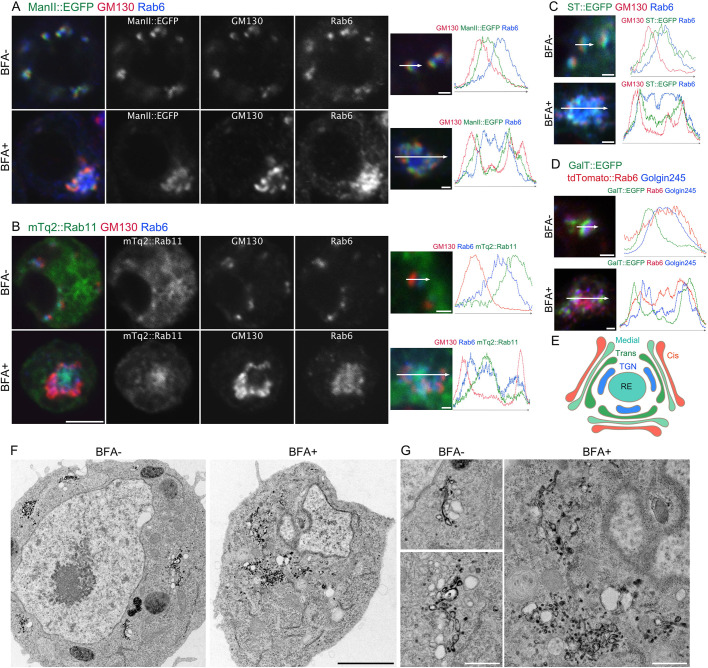
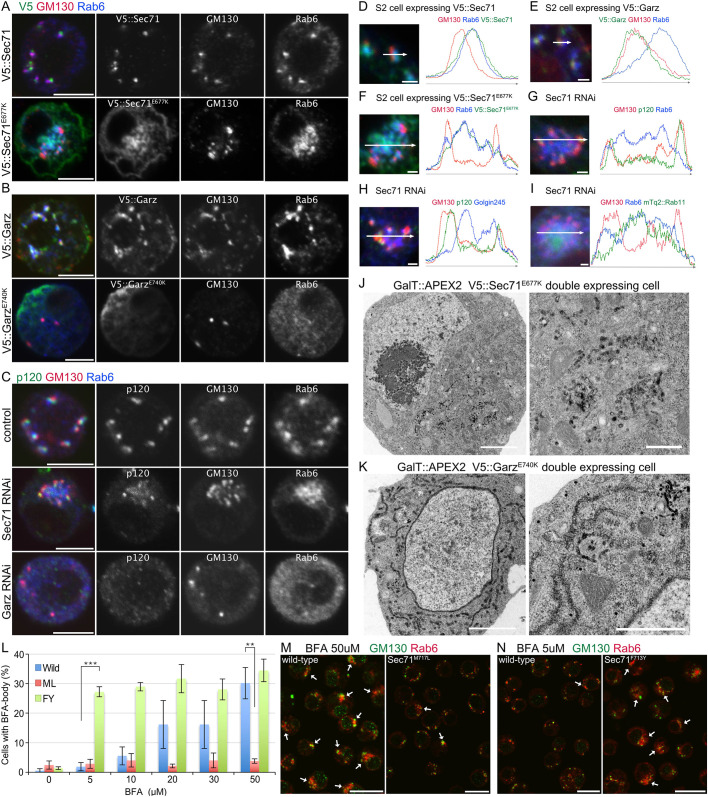
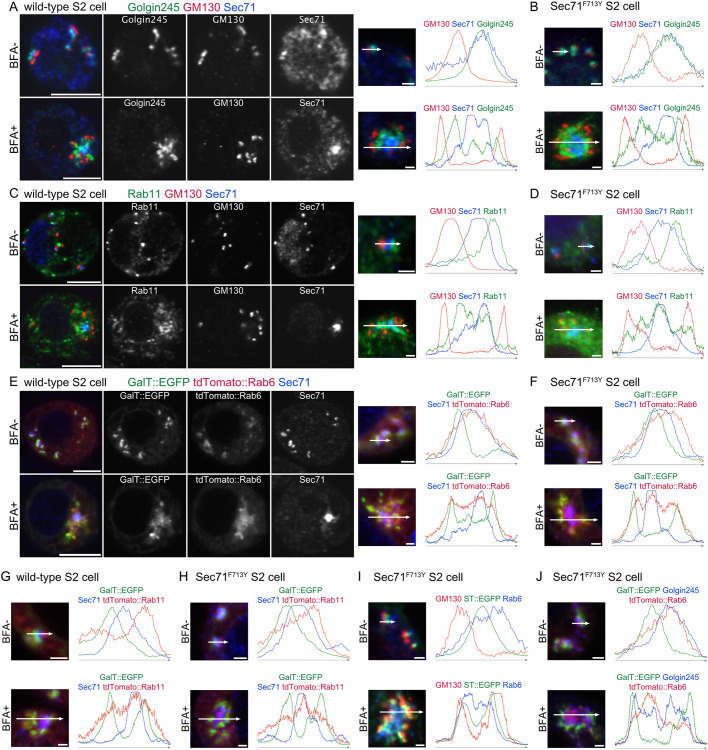
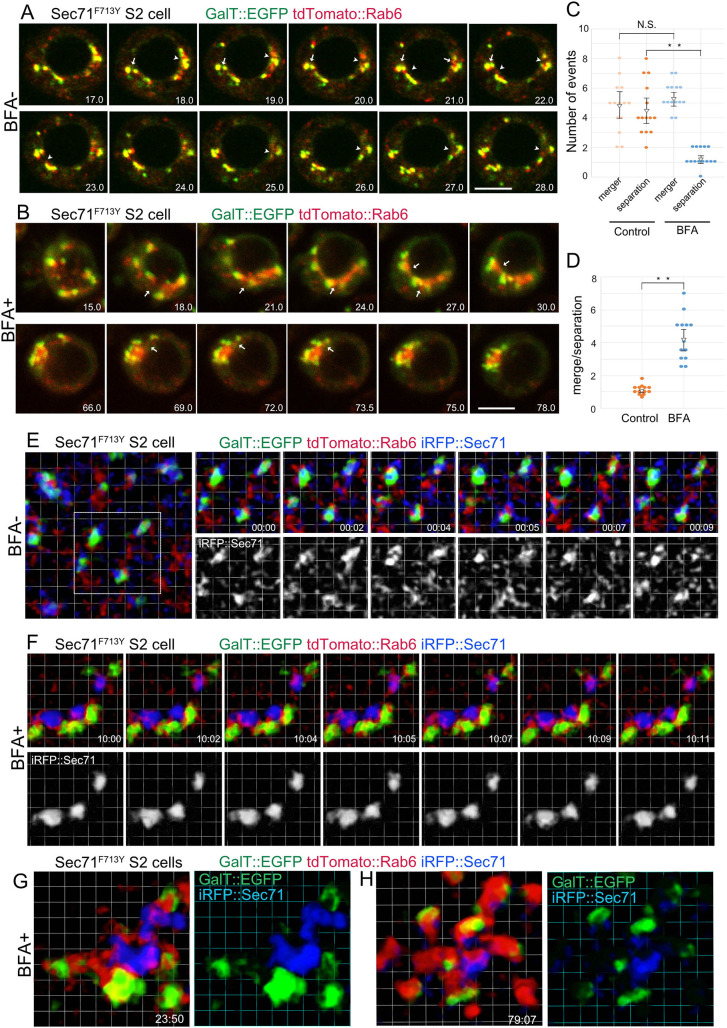
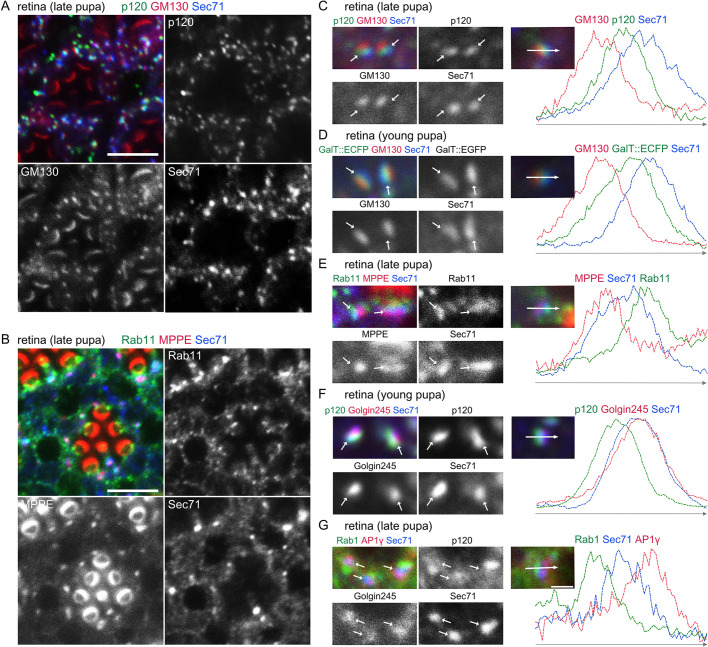
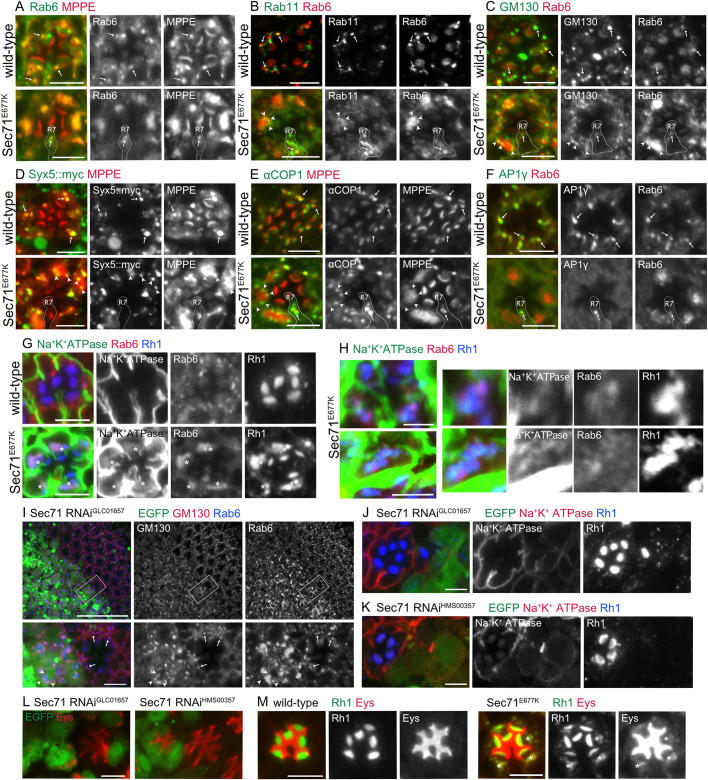
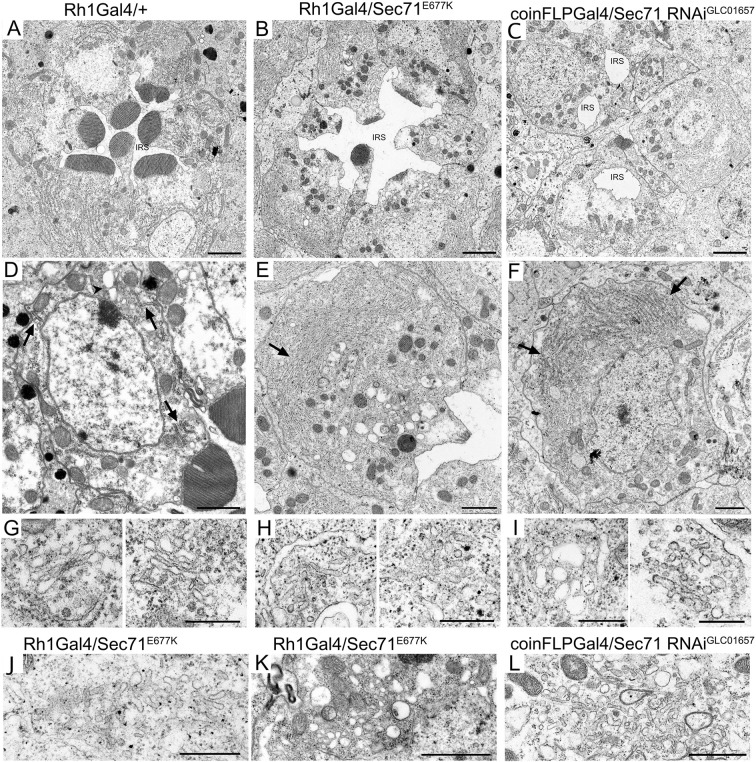
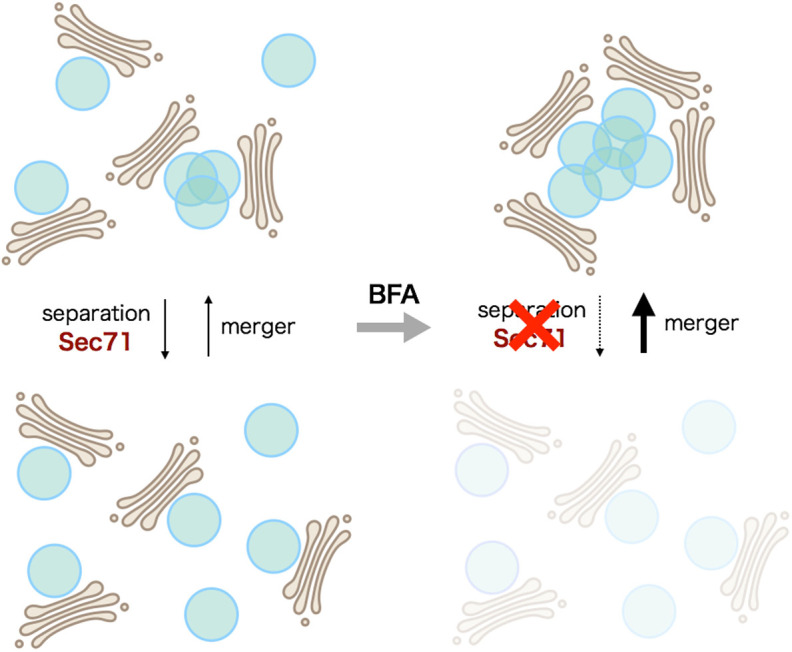
Golgi stacks are the basic structural units of the Golgi. Golgi stacks are separated from each other and scattered in the cytoplasm of Drosophila cells. Here, we report that the ARF-GEF inhibitor Brefeldin A (BFA) induces the formation of BFA bodies, which are aggregates of Golgi stacks, trans-Golgi networks and recycling endosomes. Recycling endosomes are located in the centers of BFA bodies, while Golgi stacks surround them on their trans sides. Live imaging of S2 cells revealed that Golgi stacks repeatedly merged and separated on their trans sides, and BFA caused successive merger by inhibiting separation, forming BFA bodies. S2 cells carrying genome-edited BFA-resistant mutant Sec71M717L did not form BFA bodies at high concentrations of BFA; S2 cells carrying genome-edited BFA-hypersensitive mutant Sec71F713Y produced BFA bodies at low concentrations of BFA. These results indicate that Sec71 is the sole BFA target for BFA body formation and controls Golgi stack separation. Finally, we showed that impairment of Sec71 in fly photoreceptors induces BFA body formation, with accumulation of both apical and basolateral cargoes, resulting in inhibition of polarized transport.

Keywords: Brefeldin A; Drosophila; Golgi ribbon; Recycling endosome; Sec71; Trans-Golgi network.


Conflict of interest statement

Competing interestsThe authors declare no competing or financial interests.

Figures

Fig. 1. BFA induces the formation of BFA bodies. (A,B) Left, representative immunostaining of S2 cells expressing ManII::EGFP (A) or mTq2::Rab11 (B) (green) incubated without (upper panels) or with 50 μM BFA (lower panels) with anti-GM130 (red) and anti-Rab6 (blue) antibodies. Right panels, plots of signal intensities from image to the left. Signal intensities were measured along the 1.5 µm (upper) or 5 µm (lower) arrows shown in inset. Graphs show the overlap between channels. (C,D) Left pictures are immunostaining of S2 cells expressing ST::EGFP (green) (C) or GalT::EGFP (green) and tdTomato::Rab6 (red) (D) incubated without (upper panels) or with 50 μM BFA (lower panels) by anti-GM130 (red) and anti-Rab6 (blue) antibodies (C) or by anti-Golgin245 antibody (blue) (D). Right plots of signal intensities from image on the left. Signal intensity was measured along the 1.5 µm (upper) or 5 µm (lower) arrow in inset, graph shows the overlap between channels. (E) Schematic of the structure of a BFA body. (F,G) Electron micrographs of S2 cells expressing GalT::APEX2::EGFP without or with 50 μM BFA. GalT::APEX2::EGFP was visualized by osmium-enhanced DAB-depositions. Scale bars: 5 μm (A,B, left panels), 1 μm (A,B, right panels, C,D), 2 μm (F), and 500 nm (G).
Fig. 1.
BFA induces the formation of BFA bodies. (A,B) Left, representative immunostaining of S2 cells expressing ManII::EGFP (A) or mTq2::Rab11 (B) (green) incubated without (upper panels) or with 50 μM BFA (lower panels) with anti-GM130 (red) and anti-Rab6 (blue) antibodies. Right panels, plots of signal intensities from image to the left. Signal intensities were measured along the 1.5 µm (upper) or 5 µm (lower) arrows shown in inset. Graphs show the overlap between channels. (C,D) Left pictures are immunostaining of S2 cells expressing ST::EGFP (green) (C) or GalT::EGFP (green) and tdTomato::Rab6 (red) (D) incubated without (upper panels) or with 50 μM BFA (lower panels) by anti-GM130 (red) and anti-Rab6 (blue) antibodies (C) or by anti-Golgin245 antibody (blue) (D). Right plots of signal intensities from image on the left. Signal intensity was measured along the 1.5 µm (upper) or 5 µm (lower) arrow in inset, graph shows the overlap between channels. (E) Schematic of the structure of a BFA body. (F,G) Electron micrographs of S2 cells expressing GalT::APEX2::EGFP without or with 50 μM BFA. GalT::APEX2::EGFP was visualized by osmium-enhanced DAB-depositions. Scale bars: 5 μm (A,B, left panels), 1 μm (A,B, right panels, C,D), 2 μm (F), and 500 nm (G).
Fig. 2. Sec71 is the only BFA target in BFA body formation in S2 cells. (A) Immunostaining of cells expressing V5::Sec71 (upper panels) or V5::Sec71E677K (lower panels) by anti-V5 (green), anti-GM130 (red), and anti-Rab6 (blue) antibodies. (B) Immunostaining of cells expressing V5::Garz (upper panels) or V5::GarzE740K (lower panels) by anti-V5 (green), anti-GM130 (red), and anti-Rab6 (blue) antibodies. (C) Immunostaining of cells transfected with double-stranded RNA against Sec71 (panels in middle row) or Garz (lower panels) or not transfected (upper panels) by anti-p120 (green), anti-GM130 (red), and anti-Rab6 (blue) antibodies. (D–I) Left, immunostaining of cells expressing V5::Sec71 (D), V5::Garz (E), V5::Sec71E677K (F), mTq2::Rab11 (green) (I), or transfected with double-stranded RNA against Sec71 (G–I). Anti-V5 (green), anti-GM130 (red), and anti-Rab6 (blue) antibodies (D–F). Anti-p120 (green), anti-GM130 (red), and anti-Rab6 (blue) antibodies (G). Anti-p120 (green), anti-GM130 (red), and anti-Golgin245 (blue) antibodies (H). Anti-GM130 (red) and anti-Rab6 (blue) antibodies (I). Right, plots of signal intensities from images on the left. Signal intensities were measured along the 1.5 µm (D,E) and 5 µm (F–I) arrows shown in insets. Graphs show the overlap between channels. (J,K) Electron micrographs of cells co-expressing GalT::APEX2::EGFP and V5::Sec71E677K (J) or V5::GarzE740K (K). GalT::APEX2::EGFP was visualized by osmium-enhanced DAB-deposition. (L) Percentages of wild-type, Sec71M717L and Sec71F713Y S2 cells with BFA bodies after 2 h of incubation with 0, 5, 10, 20, 30 and 50 μM BFA. BFA bodies were defined as focused Rab6 staining surrounded by GM130 staining. Results are mean±s.d. for n>250 in three independent experiments. (M) Immunostaining of wild-type cells (left) and genome-edited cells expressing BFA-resistant mutant Sec71M717L (right) treated with 50 μM BFA by anti-GM130 (green) and anti-Rab6 (red) antibodies. (N) Immunostaining of wild-type cells (left) and genome-edited cells with BFA-hypersensitive mutant Sec71F713Y (right) treated with 5 μM BFA with anti-GM130 (green) and anti-Rab6 (red) antibodies. Scale bars: 5 μm (A–C), 1 μm (D–I), 2 μm (J,K, left), 500 nm (J,K, right), 20 μm (M,N). **P<0.01, ***P<0.001 (unpaired two-tailed Student's t-test).
Fig. 2.
Sec71 is the only BFA target in BFA body formation in S2 cells. (A) Immunostaining of cells expressing V5::Sec71 (upper panels) or V5::Sec71E677K (lower panels) by anti-V5 (green), anti-GM130 (red), and anti-Rab6 (blue) antibodies. (B) Immunostaining of cells expressing V5::Garz (upper panels) or V5::GarzE740K (lower panels) by anti-V5 (green), anti-GM130 (red), and anti-Rab6 (blue) antibodies. (C) Immunostaining of cells transfected with double-stranded RNA against Sec71 (panels in middle row) or Garz (lower panels) or not transfected (upper panels) by anti-p120 (green), anti-GM130 (red), and anti-Rab6 (blue) antibodies. (D–I) Left, immunostaining of cells expressing V5::Sec71 (D), V5::Garz (E), V5::Sec71E677K (F), mTq2::Rab11 (green) (I), or transfected with double-stranded RNA against Sec71 (G–I). Anti-V5 (green), anti-GM130 (red), and anti-Rab6 (blue) antibodies (D–F). Anti-p120 (green), anti-GM130 (red), and anti-Rab6 (blue) antibodies (G). Anti-p120 (green), anti-GM130 (red), and anti-Golgin245 (blue) antibodies (H). Anti-GM130 (red) and anti-Rab6 (blue) antibodies (I). Right, plots of signal intensities from images on the left. Signal intensities were measured along the 1.5 µm (D,E) and 5 µm (F–I) arrows shown in insets. Graphs show the overlap between channels. (J,K) Electron micrographs of cells co-expressing GalT::APEX2::EGFP and V5::Sec71E677K (J) or V5::GarzE740K (K). GalT::APEX2::EGFP was visualized by osmium-enhanced DAB-deposition. (L) Percentages of wild-type, Sec71M717L and Sec71F713Y S2 cells with BFA bodies after 2 h of incubation with 0, 5, 10, 20, 30 and 50 μM BFA. BFA bodies were defined as focused Rab6 staining surrounded by GM130 staining. Results are mean±s.d. for n>250 in three independent experiments. (M) Immunostaining of wild-type cells (left) and genome-edited cells expressing BFA-resistant mutant Sec71M717L (right) treated with 50 μM BFA by anti-GM130 (green) and anti-Rab6 (red) antibodies. (N) Immunostaining of wild-type cells (left) and genome-edited cells with BFA-hypersensitive mutant Sec71F713Y (right) treated with 5 μM BFA with anti-GM130 (green) and anti-Rab6 (red) antibodies. Scale bars: 5 μm (A–C), 1 μm (D–I), 2 μm (J,K, left), 500 nm (J,K, right), 20 μm (M,N). **P<0.01, ***P<0.001 (unpaired two-tailed Student's t-test).
Fig. 3. Sec71 is localized to the center of the BFA body. Immunostaining and plots of signal intensities from wild-type (A,C,E,G) and Sec71F713Y S2 cells (B,D,F,H–J). Right, plots of signal intensities from images on the left. Signal intensities were measured along the 1.5 µm (upper panels) and 5 µm (lower panels) arrows shown in insets. In all panels, cells not treated with BFA are shown in the upper row and BFA-treated cells are shown in the lower row. 50 μM and 25 μM BFA was used for the wild-type cells and Sec71F713Y S2 cells, respectively. (A,B) Immunostaining with anti-Golgin245 (green), anti-GM130 (red), and anti-Sec71 (blue) antibodies. (C,D) Immunostaining with anti-Rab11 (green), anti-GM130 (red), and anti-Sec71 (blue) antibodies. (E,F) S2 cells expressing GalT::EGFP (green) and tdTomato::Rab6 (red) immunostained with anti-Sec71 (blue) antibody. (G,H) S2 cells expressing GalT::EGFP (green) and tdTomato::Rab11 (red) immunostained with anti-Sec71 (blue) antibody. (I) S2 cells expressing ST::EGFP (green) immunostained with anti-GM130 (red) and anti-Rab6 (blue) antibodies. (J) S2 cells expressing GalT::EGFP (green) and tdTomato::Rab6 (red) immunostained with anti-Golgin245 (blue) antibody. Scale bars: 5 μm (A,C,E, left panels), 1 μm (A,C,E, right panels, B,D,F,G–J).
Fig. 3.
Sec71 is localized to the center of the BFA body. Immunostaining and plots of signal intensities from wild-type (A,C,E,G) and Sec71F713Y S2 cells (B,D,F,H–J). Right, plots of signal intensities from images on the left. Signal intensities were measured along the 1.5 µm (upper panels) and 5 µm (lower panels) arrows shown in insets. In all panels, cells not treated with BFA are shown in the upper row and BFA-treated cells are shown in the lower row. 50 μM and 25 μM BFA was used for the wild-type cells and Sec71F713Y S2 cells, respectively. (A,B) Immunostaining with anti-Golgin245 (green), anti-GM130 (red), and anti-Sec71 (blue) antibodies. (C,D) Immunostaining with anti-Rab11 (green), anti-GM130 (red), and anti-Sec71 (blue) antibodies. (E,F) S2 cells expressing GalT::EGFP (green) and tdTomato::Rab6 (red) immunostained with anti-Sec71 (blue) antibody. (G,H) S2 cells expressing GalT::EGFP (green) and tdTomato::Rab11 (red) immunostained with anti-Sec71 (blue) antibody. (I) S2 cells expressing ST::EGFP (green) immunostained with anti-GM130 (red) and anti-Rab6 (blue) antibodies. (J) S2 cells expressing GalT::EGFP (green) and tdTomato::Rab6 (red) immunostained with anti-Golgin245 (blue) antibody. Scale bars: 5 μm (A,C,E, left panels), 1 μm (A,C,E, right panels, B,D,F,G–J).
Fig. 4. Live imaging of BFA body formation. (A,B) Frames from time-lapse movies of BFA-hypersensitive S2 cells carrying the Sec71F713Y substitution, and also expressing GalT::EGFP (green) and tdTomato::Rab6 (red) with (B) or without 25 μM BFA treatment (A) observed by confocal microscopy. Numbers at right bottom corners indicate the time (min) after BFA addition (B) or start point of time-lapse observation (A). Arrows or arrowheads indicate mergers or separations of TGN of two or more Golgi stacks. (C) Quantifications of mergers or separations of TGNs in untreated (left) and BFA-treated S2 cells (right). (D) Ratios of mergers to separations of TGNs in untreated (left) and BFA-treated (right) S2 cells carrying the Sec71F713Y substitution. Error bars show mean±s.d. (E–H) Frames of time-lapse movies of S2 cells carrying the BFA-hypersensitive Sec71F713Y substitution, also expressing GalT::EGFP (green), tdTomato::Rab6 (red) and iRFP::Sec71 (blue) with (F–H) or without 25 μM BFA treatment (E) observed by SCLIM. Numbers at the right bottom corners indicate the time (min:sec) after BFA addition (F–H) or start point of time-lapse observation (E). Scale bars: 5 μm (A,B); Grid: 1 μm (E–H). **P<0.01, N.S., not significant (unpaired two-tailed Student's t-test).
Fig. 4.
Live imaging of BFA body formation. (A,B) Frames from time-lapse movies of BFA-hypersensitive S2 cells carrying the Sec71F713Y substitution, and also expressing GalT::EGFP (green) and tdTomato::Rab6 (red) with (B) or without 25 μM BFA treatment (A) observed by confocal microscopy. Numbers at right bottom corners indicate the time (min) after BFA addition (B) or start point of time-lapse observation (A). Arrows or arrowheads indicate mergers or separations of TGN of two or more Golgi stacks. (C) Quantifications of mergers or separations of TGNs in untreated (left) and BFA-treated S2 cells (right). (D) Ratios of mergers to separations of TGNs in untreated (left) and BFA-treated (right) S2 cells carrying the Sec71F713Y substitution. Error bars show mean±s.d. (E–H) Frames of time-lapse movies of S2 cells carrying the BFA-hypersensitive Sec71F713Y substitution, also expressing GalT::EGFP (green), tdTomato::Rab6 (red) and iRFP::Sec71 (blue) with (F–H) or without 25 μM BFA treatment (E) observed by SCLIM. Numbers at the right bottom corners indicate the time (min:sec) after BFA addition (F–H) or start point of time-lapse observation (E). Scale bars: 5 μm (A,B); Grid: 1 μm (E–H). **P<0.01, N.S., not significant (unpaired two-tailed Student's t-test).
Fig. 5. Sec71 exclusively localizes to TGN in photoreceptors. Immunostaining of retinas dissected from wild-type young and late-pupal flies with (A) anti-p120 (green), anti-GM130 (red) and anti-Sec71 (blue) antibodies; (B) anti-Rab11 (green), a medial-Golgi marker, anti-MPPE (red), and anti-Sec71 (blue) antibodies. Anti-MPPE antibody stains not only the medial Golgi but also the tips of the rhabdomeres. It is not known whether the latter staining represents genuine MPPE localization. (C–G) Left, immunostaining of retinas by the indicated antibodies. GalT::ECFP was expressed in D. Right, plots of signal intensities from images to the left. Signal intensities were measured along the 1.5 µm arrow in the insets; graphs show the overlap between channels. Scale bars: 5 μm (A,B), 1 μm (C–G).
Fig. 5.
Sec71 exclusively localizes to TGN in photoreceptors. Immunostaining of retinas dissected from wild-type young and late-pupal flies with (A) anti-p120 (green), anti-GM130 (red) and anti-Sec71 (blue) antibodies; (B) anti-Rab11 (green), a medial-Golgi marker, anti-MPPE (red), and anti-Sec71 (blue) antibodies. Anti-MPPE antibody stains not only the medial Golgi but also the tips of the rhabdomeres. It is not known whether the latter staining represents genuine MPPE localization. (C–G) Left, immunostaining of retinas by the indicated antibodies. GalT::ECFP was expressed in D. Right, plots of signal intensities from images to the left. Signal intensities were measured along the 1.5 µm arrow in the insets; graphs show the overlap between channels. Scale bars: 5 μm (A,B), 1 μm (C–G).
Fig. 6. Basolateral and rhabdomere transport is inhibited in Sec71E677K-expressing photoreceptors. (A–G) Immunostaining of retinas from Rh1-Gal4/+ (upper panels) and Rh1-Gal4/UAS- Sec71E677K (lower panels) late-pupal flies. Sec71E677K is expressed in the R1–6 peripheral photoreceptors (A–C,E–G). Immunostaining of retinas from Rh1-Gal4/UAS-Syx5::myc (upper panels) and Rh1-Gal4/UAS-Syx5::myc, UAS- Sec71E677K (lower panels) late-pupal flies. Sec71E677K is expressed in the R1–6 peripheral photoreceptors (D). Anti-Rab6 (green) and anti-MPPE (red) antibodies (A). Anti-Rab11 (green) and anti-Rab6 (red) antibodies (B). Anti-GM130 (green) and anti-Rab6 (red) antibodies (C). Anti-myc (green) and anti-MPPE (red) antibodies (D). Anti-αCOPI (green) and anti-MPPE (red) antibodies (E). Anti-AP1γ (green) and anti-Rab6 (red) antibodies (F). Anti-Na+K+-ATPase-α (green), anti-Rab6 (red), and anti-Rh1 (blue) antibodies (G). Arrows indicate Golgi stacks in the wild-type cells, and arrowheads indicate the foci of cis-Golgi makers surrounding the medial and late Golgi aggregates. Cytoplasmic accumulation of Rh1 is indicated by asterisks. (H) Immunostaining of retinas from Rh1-Gal4/UAS-Sec71E677K late-pupal flies using anti-Na+K+-ATPase-α (green), anti-Rab6 (red), and anti-Rh1 (blue) antibodies. (I–L) Immunostaining of retinas dissected from Sec71-RNAiGLC01657 (I,J,L, left) or Sec71RNAiHMS00357 (K,L, right) mosaic retinas. GFP marks Sec71-RNAi-expressing cells. Anti-GM130 (red) and anti-Rab6 (blue) antibodies (I). Anti-Na+K+-ATPase-α (red) and anti-Rh1 (blue) antibodies (J,K). Anti-Eys antibody (red) (L), Arrows indicate Golgi stacks in the wild-type cells, and arrowheads indicate the foci of cis-Golgi makers surrounding Golgi aggregates. (M) Immunostaining of retinas from Rh1-Gal4/+ (left) and Rh1-Gal4/UAS- Sec71E677K (right) late-pupal flies. Sec71E677K is expressed in the R1–6 peripheral photoreceptors. Anti-Rh1 (green) and anti-Eys (red) antibodies. Cytoplasmic accumulation of Rh1 and Eys is indicated by asterisks. Scale bars: 5 μm (A–G), 2 μm (H), 50 μm (I, upper), 5 μm (I, lower, J–M).
Fig. 6.
Basolateral and rhabdomere transport is inhibited in Sec71E677K-expressing photoreceptors. (A–G) Immunostaining of retinas from Rh1-Gal4/+ (upper panels) and Rh1-Gal4/UAS- Sec71E677K (lower panels) late-pupal flies. Sec71E677K is expressed in the R1–6 peripheral photoreceptors (A–C,E–G). Immunostaining of retinas from Rh1-Gal4/UAS-Syx5::myc (upper panels) and Rh1-Gal4/UAS-Syx5::myc, UAS- Sec71E677K (lower panels) late-pupal flies. Sec71E677K is expressed in the R1–6 peripheral photoreceptors (D). Anti-Rab6 (green) and anti-MPPE (red) antibodies (A). Anti-Rab11 (green) and anti-Rab6 (red) antibodies (B). Anti-GM130 (green) and anti-Rab6 (red) antibodies (C). Anti-myc (green) and anti-MPPE (red) antibodies (D). Anti-αCOPI (green) and anti-MPPE (red) antibodies (E). Anti-AP1γ (green) and anti-Rab6 (red) antibodies (F). Anti-Na+K+-ATPase-α (green), anti-Rab6 (red), and anti-Rh1 (blue) antibodies (G). Arrows indicate Golgi stacks in the wild-type cells, and arrowheads indicate the foci of cis-Golgi makers surrounding the medial and late Golgi aggregates. Cytoplasmic accumulation of Rh1 is indicated by asterisks. (H) Immunostaining of retinas from Rh1-Gal4/UAS-Sec71E677K late-pupal flies using anti-Na+K+-ATPase-α (green), anti-Rab6 (red), and anti-Rh1 (blue) antibodies. (I–L) Immunostaining of retinas dissected from Sec71-RNAiGLC01657 (I,J,L, left) or Sec71RNAiHMS00357 (K,L, right) mosaic retinas. GFP marks Sec71-RNAi-expressing cells. Anti-GM130 (red) and anti-Rab6 (blue) antibodies (I). Anti-Na+K+-ATPase-α (red) and anti-Rh1 (blue) antibodies (J,K). Anti-Eys antibody (red) (L), Arrows indicate Golgi stacks in the wild-type cells, and arrowheads indicate the foci of cis-Golgi makers surrounding Golgi aggregates. (M) Immunostaining of retinas from Rh1-Gal4/+ (left) and Rh1-Gal4/UAS- Sec71E677K (right) late-pupal flies. Sec71E677K is expressed in the R1–6 peripheral photoreceptors. Anti-Rh1 (green) and anti-Eys (red) antibodies. Cytoplasmic accumulation of Rh1 and Eys is indicated by asterisks. Scale bars: 5 μm (A–G), 2 μm (H), 50 μm (I, upper), 5 μm (I, lower, J–M).
Fig. 7. Tubule networks develop in Sec71-deficient photoreceptors. Electron micrographs of photoreceptors from Rh1-Gal4/+ (A,D,G), Rh1-Gal4/UAS- Sec71E677K (B,E,H,J,K) and coinFLPGal4/UAS-Sec71RNAiGL01657 (C,F,I,L) late-pupal flies. (A–C) Electron micrographs of a single ommatidium. The IRS is small and fragmented in C. (D–F) Electron micrographs of single photoreceptors. Arrows show the ER membrane and the arrowhead shows a Golgi stack. (G–I) Electron micrographs of Golgi stacks or related organelles. (J–L) Electron micrographs of tubules and vesicles observed in Sec71-deficient cells. Scale bars: 2 μm (A–C), 1 μm (D–F), 500 nm (G–L).
Fig. 7.
Tubule networks develop in Sec71-deficient photoreceptors. Electron micrographs of photoreceptors from Rh1-Gal4/+ (A,D,G), Rh1-Gal4/UAS- Sec71E677K (B,E,H,J,K) and coinFLPGal4/UAS-Sec71RNAiGL01657 (C,F,I,L) late-pupal flies. (A–C) Electron micrographs of a single ommatidium. The IRS is small and fragmented in C. (D–F) Electron micrographs of single photoreceptors. Arrows show the ER membrane and the arrowhead shows a Golgi stack. (G–I) Electron micrographs of Golgi stacks or related organelles. (J–L) Electron micrographs of tubules and vesicles observed in Sec71-deficient cells. Scale bars: 2 μm (A–C), 1 μm (D–F), 500 nm (G–L).
Fig. 8. BFA body formation model. Golgi stacks and TGN/RE are shown in brown and blue, respectively. TGN/RE separations are driven by Sec71, and BFA inhibits Sec71 function. Without BFA, both separations and mergers of TGN/REs occur repeatedly, resulting in Golgi stack-associated TGN/RE being mostly separated in the steady state. After BFA addition, the separation of TGN/RE is greatly decreased, whereas mergers of TGN/RE occur normally, resulting in BFA body formation.
Fig. 8.
BFA body formation model. Golgi stacks and TGN/RE are shown in brown and blue, respectively. TGN/RE separations are driven by Sec71, and BFA inhibits Sec71 function. Without BFA, both separations and mergers of TGN/REs occur repeatedly, resulting in Golgi stack-associated TGN/RE being mostly separated in the steady state. After BFA addition, the separation of TGN/RE is greatly decreased, whereas mergers of TGN/RE occur normally, resulting in BFA body formation.

Similar articles

Cited by

References

    1. Anders, N. and Jürgens, G. (2008). Large ARF guanine nucleotide exchange factors in membrane trafficking. Cell. Mol. Life Sci. 65, 3433-3445. 10.1007/s00018-008-8227-7 - DOI - PMC - PubMed
    1. Armbruster, K. and Luschnig, S. (2012). The Drosophila Sec7 domain guanine nucleotide exchange factor protein Gartenzwerg localizes at the cis-Golgi and is essential for epithelial tube expansion. J. Cell Sci. 125, 1318-1328. 10.1242/jcs.096263 - DOI - PubMed
    1. Baluška, F., Hlavacka, A., Šamaj, J., Palme, K., Robinson, D. G., Matoh, T., McCurdy, D. W., Menzel, D. and Volkmann, D. (2002). F-actin-dependent endocytosis of cell wall pectins in meristematic root cells. Insights from brefeldin A-induced compartments. Plant Physiol. 130, 422-431. 10.1104/pp.007526 - DOI - PMC - PubMed
    1. Boncompain, G., Divoux, S., Gareil, N., de Forges, H., Lescure, A., Latreche, L., Mercanti, V., Jollivet, F., Raposo, G. and Perez, F. (2012). Synchronization of secretory protein traffic in populations of cells. Nat. Methods 9, 493-498. 10.1038/nmeth.1928 - DOI - PubMed
    1. Bosch, J. A., Tran, N. H. and Hariharan, I. K. (2015). CoinFLP: a system for efficient mosaic screening and for visualizing clonal boundaries in Drosophila. Development 142, 597-606. 10.1242/dev.114603 - DOI - PMC - PubMed

Publication types

LinkOut - more resources