. 2020 Dec 1;11(1):6145.
doi: 10.1038/s41467-020-19871-x.

Epistasis-driven identification of SLC25A51 as a regulator of human mitochondrial NAD import

Affiliations

Epistasis-driven identification of SLC25A51 as a regulator of human mitochondrial NAD import

Enrico Girardi et al. Nat Commun. .

Abstract

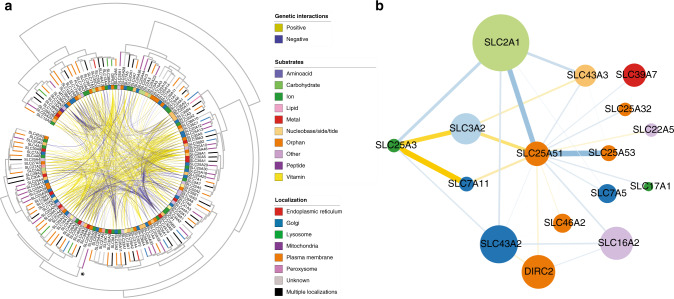
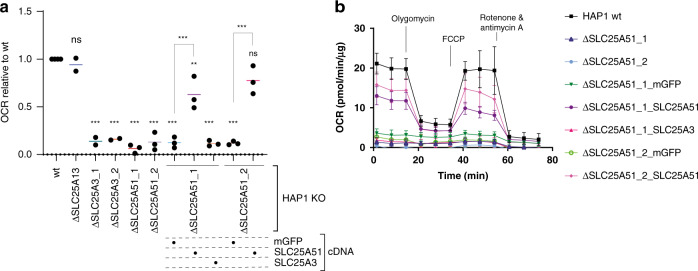
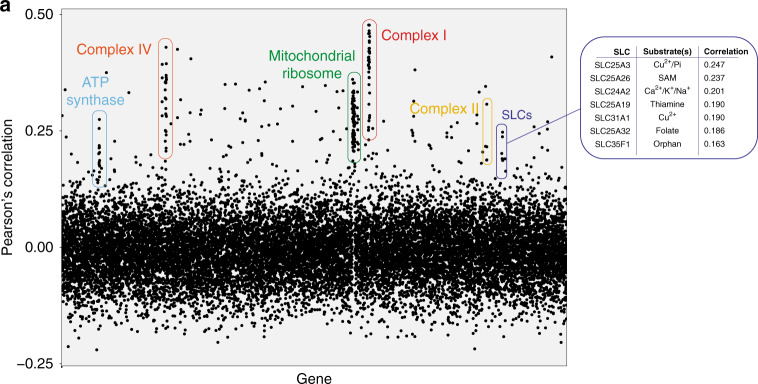
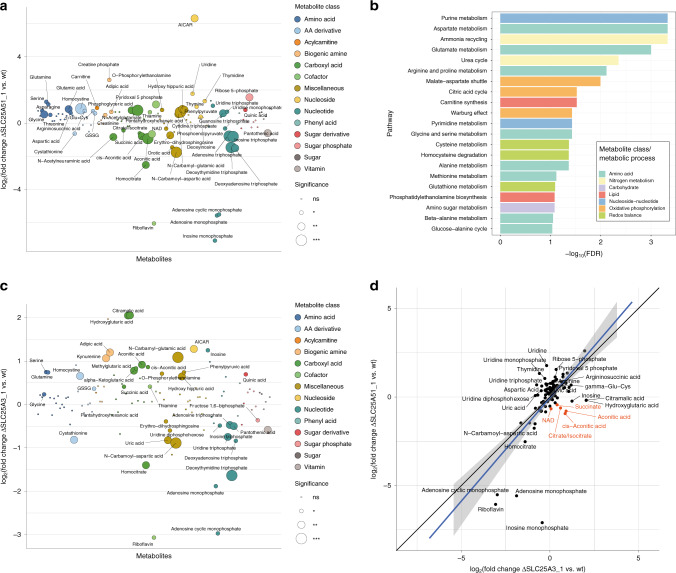
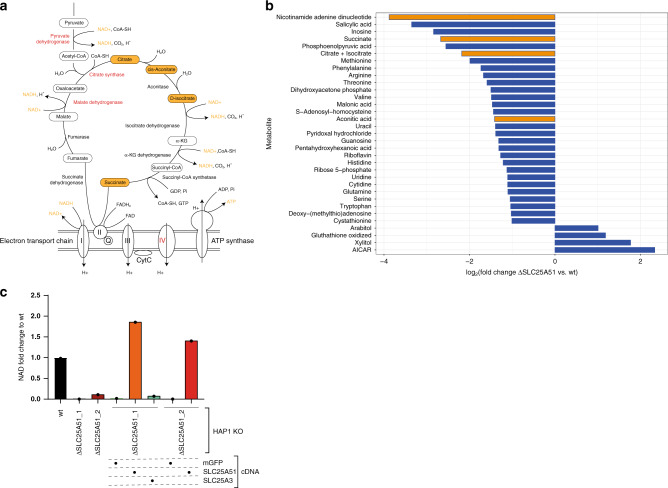
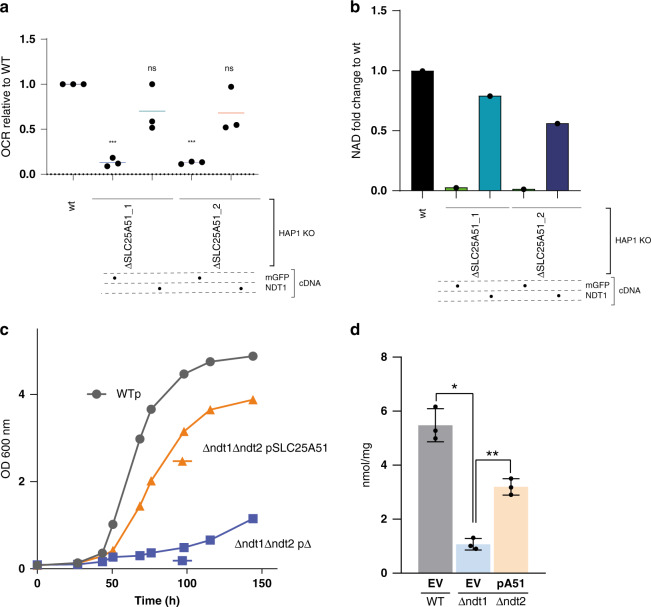
About a thousand genes in the human genome encode for membrane transporters. Among these, several solute carrier proteins (SLCs), representing the largest group of transporters, are still orphan and lack functional characterization. We reasoned that assessing genetic interactions among SLCs may be an efficient way to obtain functional information allowing their deorphanization. Here we describe a network of strong genetic interactions indicating a contribution to mitochondrial respiration and redox metabolism for SLC25A51/MCART1, an uncharacterized member of the SLC25 family of transporters. Through a combination of metabolomics, genomics and genetics approaches, we demonstrate a role for SLC25A51 as enabler of mitochondrial import of NAD, showcasing the potential of genetic interaction-driven functional gene deorphanization.


Conflict of interest statement

The authors declare no competing interests.

Figures

Fig. 1
Fig. 1. A genetic interaction network functionally annotates the orphan gene SLC25A51.
a Overview of the genetic interaction landscape of Solute Carriers in human HAP1 cells. Genes present in the SLC KO collections are arranged on a circle and clustered by genetic interaction profile similarity. Direct gene–gene interactions are shown as connections within the circle. Substrate classes are annotated in the inner color band. Localization is shown on the dendrogram leaves. *The position of the cluster composed by the mitochondrial SLC25A3 and SLC25A51 genes. b Sub-network of strong genetic interactions involving the orphan gene SLC25A51. Node color refers to substrate class and node size reflects the degree of connectivity in the strong SLC–SLC gene interaction network.
Fig. 2
Fig. 2. ΔSLC25A51 cells have reduced mitochondrial respiration.
a Oxygen consumption rate (OCR) in wt and SLC-deficient HAP1 cells, as well as cells reconstituted with the indicated cDNAs. mGFP: mitochondrially localized GFP. SLC25A13 KO cells are used as negative control (n = 2–3 independent biological replicates). The bars show average value across biological replicates. Statistical significance was calculated with a one-way ANOVA with Dunnett’s multiple comparison test. ns: nonsignificant, **p-value < 0.05, ***p-value < 0.01. Source data are provided as a Source Data file. b Oxygen consumption rate from a representative Seahorse measurement with ΔSLC25A51 cells. Average and SD of five to eight technical replicates (n = 1 shown as representative experiment). Source data are provided as a Source Data file. FCCP: carbonyl cyanide 4-(trifluoromethoxy)phenylhydrazone.
Fig. 3
Fig. 3. A co-essentiality analysis functionally links SLC25A51 to the ETC and cofactor transport.
a Plot of the correlations of essentiality across cell lines in the DepMap dataset for each human gene, in relation to SLC25A51. Members of major mitochondrial complexes and SLC with the most highly correlated essentiality profiles are labeled.
Fig. 4
Fig. 4. Targeted metabolomics identifies SLC25A51-specific perturbations of the TCA cycle.
a Targeted metabolomics profile of SLC25A51-deficient cells compared to wt HAP1 cells. Metabolite classes are indicated by different colors. Circle sizes reflect significance of the log2 fold change measured (***p-value < 0.01, **p-value < 0.05, *p-value < 0.1, ns nonsignificant). Source data are provided as a Source Data file. b Enrichment analysis of metabolic pathways affected in SLC25A51 KO cells compared to wt cells, using the SMPBD database as reference. c Targeted metabolomics profile of SLC25A3-deficient cells compared to wt HAP1 cells. Source data are provided as a Source Data file. d Comparison of the log2(fold change) of metabolite amounts in SLC25A51- and SLC25A3-deficient cells compared to wt. Diagonal line y = x is shown in black, linear fit to the data is shown in blue with gray shaded area corresponding to 95% confidence interval. Metabolites differentially affected in the two Kos are labeled, with the subset involved with TCA cycles labeled in orange.
Fig. 5
Fig. 5. SLC25A51 controls NAD mitochondrial levels.
a Schematic view of the TCA and ETC pathway/complexes in the mitochondria. Metabolites depleted in SLC25A51 but not in SLC25A3 KOs are shown in orange boxes. Enzymes with similar essentiality profiles as SLC25A51 across the DepMap dataset are shown in red. b Plot of metabolites differentially abundant in ΔSLC25A51 cells (as average abundance of the two KO clones available) vs. wt cells. Only metabolites with an absolute log2(fold change) above 1 are shown (n = 2 technical replicates). Metabolites directly involved in the TCA cycle are labeled in orange. Source data are provided as a Source Data file. c Fold change in mitochondrial NAD content in HAP1 cells with the indicated genotypes (mean ± SD, n = 2 technical replicates). Source data are provided as a Source Data file.
Fig. 6
Fig. 6. SLC25A51 is the functional ortholog of the yeast NAD+ transporter Ndt1p.
a Oxygen consumption rate (OCR) in wt and SLC25A51-deficient HAP1 cells reconstituted with mitochondrially localized GFP (mGFP) or the yeast NAD+ transporter NTD1. Results of three independent biological replicates are shown. The bars show average value across biological replicates. Statistical significance was calculated with a one-way ANOVA with Dunnett’s multiple comparison test. ns: nonsignificant, ***p-value < 0.01. Source data are provided as a Source Data file. b Fold change in mitochondrial NAD content in wt or SLC25A51-deficienent cells expressing mitoGFP or Ndt1p (mean ± SD, n = 2 technical replicates). Source data are provided as a Source Data file. c Effect of SLC25A51 on the growth of the Δndt1Δndt2 yeast strain. Yeast strains were grown in a YNB medium supplemented with 2% ethanol. The values of optical density at 600 nm refer to cell cultures after the indicated periods of growth. Data from a representative experiment are reported. Similar results were obtained in three independent experiments. d Effect of SLC25A51 on the mitochondrial NAD+ content of the Δndt1Δndt2 yeast strain. Mitochondrial extracts were assayed for NAD+ content by HPLC analysis. Data represent means ± SE of three independent experiments and were subjected to one-way analysis of variance followed by Tukey’s post hoc tests (**p-value < 0.05, *p-value < 0.1). EV: empty vector, pA51: SLC25A51 plasmid.

Comment in

References

    1. Hediger MA, Clémençon B, Burrier RE, Bruford EA. The ABCs of membrane transporters in health and disease (SLC series): introduction. Mol. Asp. Med. 2013;34:95–107. doi: 10.1016/j.mam.2012.12.009. - DOI - PMC - PubMed
    1. Perland E, Fredriksson R. Classification systems of secondary active transporters. Trends Pharmacol. Sci. 2017;38:305–315. doi: 10.1016/j.tips.2016.11.008. - DOI - PubMed
    1. Meixner, E. et al. A substrate‐based ontology for human solute carriers. Mol. Syst. Biol. 16, e9652 (2020). - PMC - PubMed
    1. César-Razquin A, et al. A call for systematic research on solute carriers. Cell. 2015;162:478–487. doi: 10.1016/j.cell.2015.07.022. - DOI - PubMed
    1. Dixon SJ, Costanzo M, Baryshnikova A, Andrews B, Boone C. Systematic mapping of genetic interaction networks. Annu. Rev. Genet. 2009;43:601–625. doi: 10.1146/annurev.genet.39.073003.114751. - DOI - PubMed

Publication types