. 2020 Dec 1;11(1):6149.
doi: 10.1038/s41467-020-19918-z.

Functionally impaired plasmacytoid dendritic cells and non-haematopoietic sources of type I interferon characterize human autoimmunity

Affiliations

Functionally impaired plasmacytoid dendritic cells and non-haematopoietic sources of type I interferon characterize human autoimmunity

Antonios Psarras et al. Nat Commun. .

Abstract

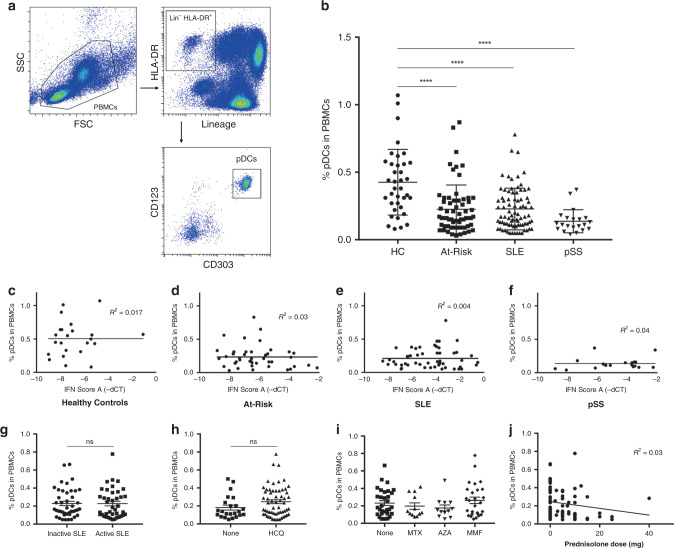
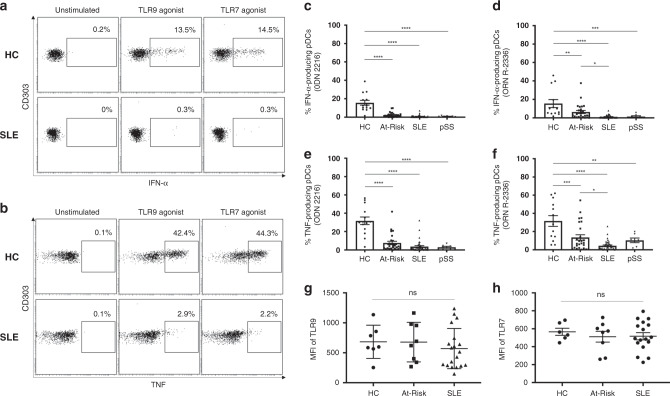
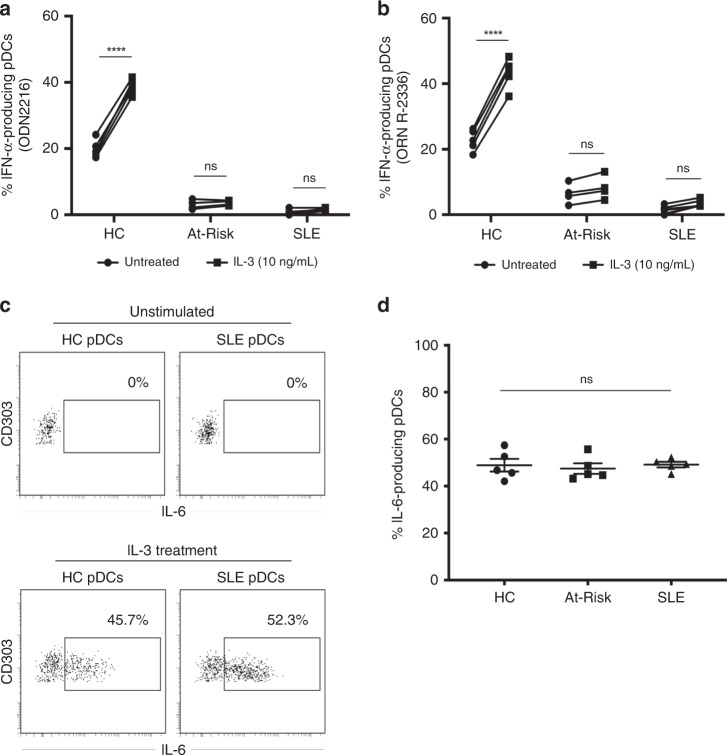
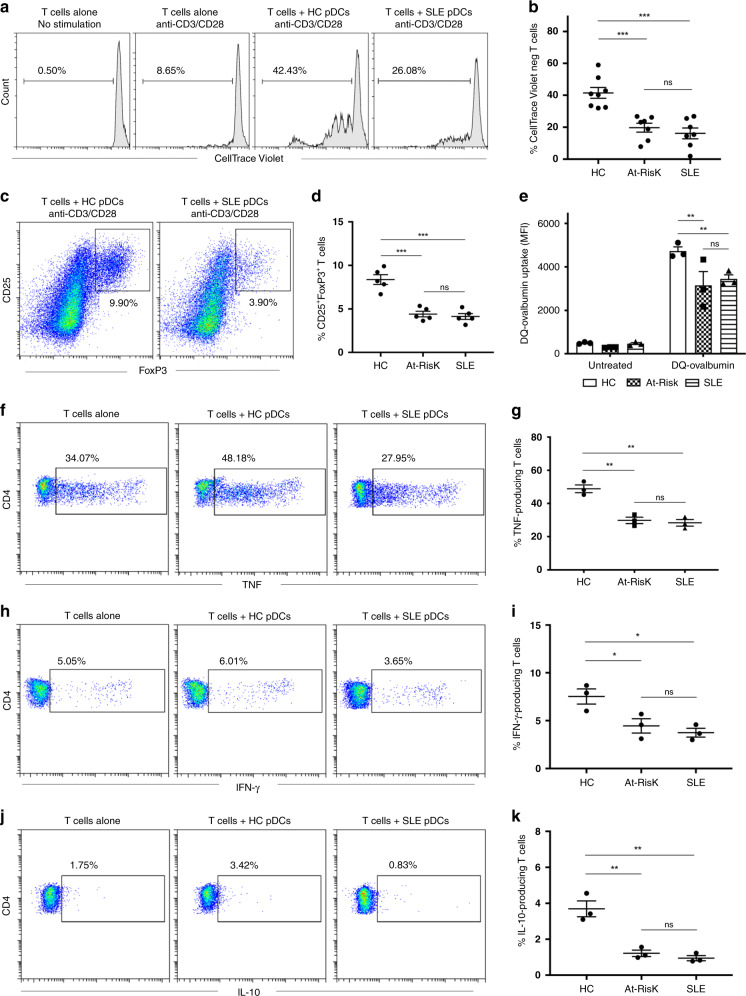
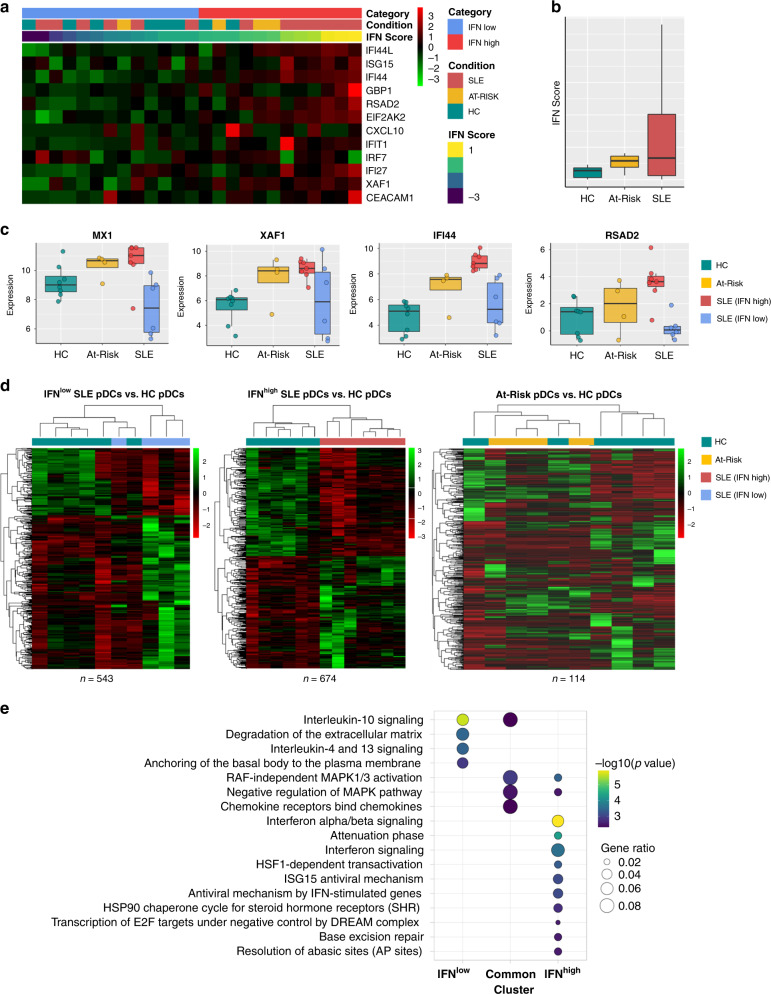
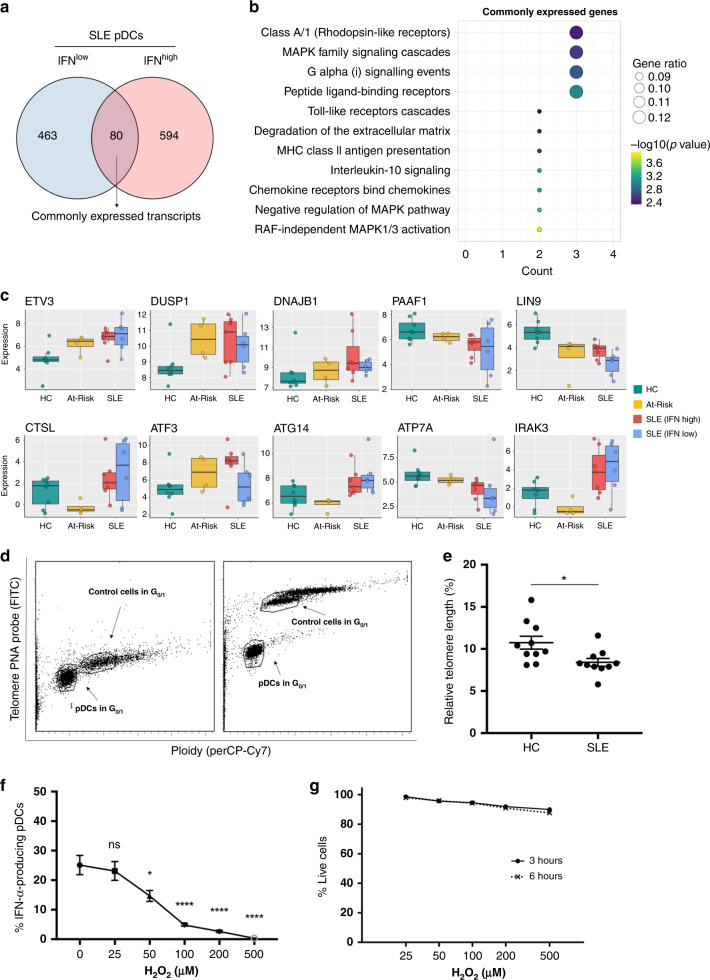
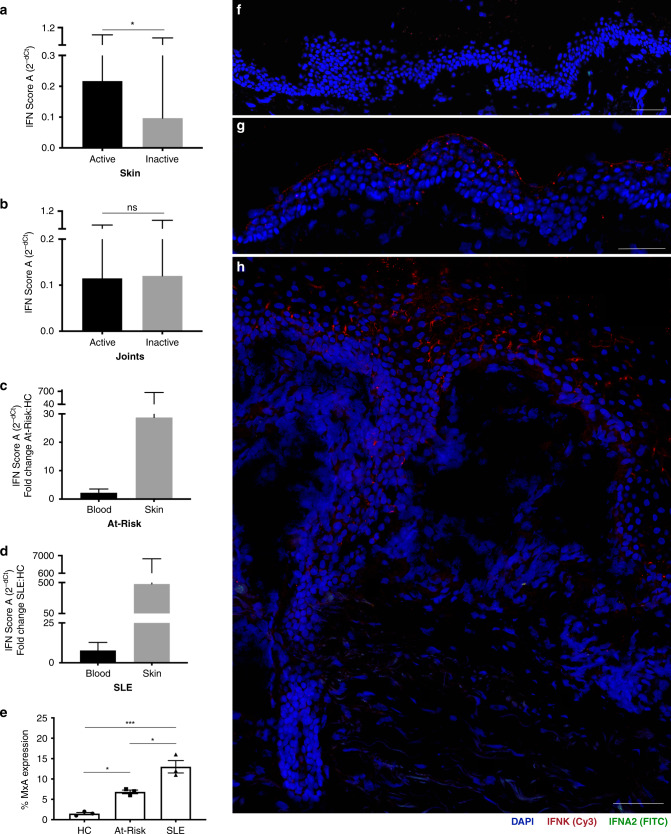
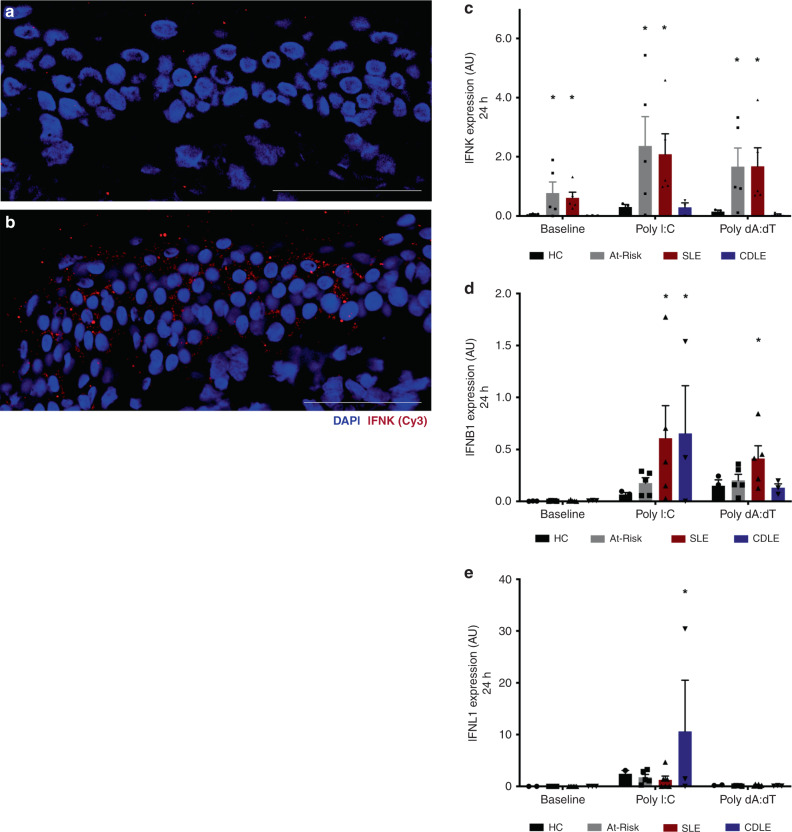
Autoimmune connective tissue diseases arise in a stepwise fashion from asymptomatic preclinical autoimmunity. Type I interferons have a crucial role in the progression to established autoimmune diseases. The cellular source and regulation in disease initiation of these cytokines is not clear, but plasmacytoid dendritic cells have been thought to contribute to excessive type I interferon production. Here, we show that in preclinical autoimmunity and established systemic lupus erythematosus, plasmacytoid dendritic cells are not effector cells, have lost capacity for Toll-like-receptor-mediated cytokine production and do not induce T cell activation, independent of disease activity and the blood interferon signature. In addition, plasmacytoid dendritic cells have a transcriptional signature indicative of cellular stress and senescence accompanied by increased telomere erosion. In preclinical autoimmunity, we show a marked enrichment of an interferon signature in the skin without infiltrating immune cells, but with interferon-κ production by keratinocytes. In conclusion, non-hematopoietic cellular sources, rather than plasmacytoid dendritic cells, are responsible for interferon production prior to clinical autoimmunity.


Conflict of interest statement

M.W. declares that they have received honoraria for educational activity and consultancy from Novartis, Janssen, Abbvie, and Celgene. P.E. declares that they have received consultancy fees from BMS, Abbott, Pfizer, MSD, Novartis, Roche, and UCB, and research grants paid to their employer from Abbott, BMS, Pfizer, MSD, and Roche. G.C.T. declares that they have received consultancy fees from Jansen and is on the Scientific Advisory Boards of Silicon Pharmaceuticals and ABPRO. E.M.V. declares that they have received consultancy fees from Roche, GSK, Lilly, and AstraZeneca, and research grants paid to his employer from Roche and AstraZeneca. The remaining authors declare no competing interests.

Figures

Fig. 1
Fig. 1. Decrease in circulating pDCs in autoimmunity is independent of disease activity and therapy.
a Gating strategy to identify the pDC population within PBMCs: pDCs are characterized by the lack of expression of lineage markers (CD3, CD19, CD56, CD14, CD11c), intermediate to high expression of HLA-DR, high expression of CD123 (IL-3R) and CD303 (BDCA-2). b Average percentage of pDCs in PBMCs of age- and sex-matched healthy controls (HC; n = 37), At-Risk individuals (At-Risk; n = 64), patients with systemic lupus erythematosus (SLE; n = 81) and primary Sjögren’s Syndrome (pSS; n = 21). cf Association between the percentage of pDCs in PBMCs and type I IFN activity in the blood (IFN score A) in HC, At-Risk, SLE, and pSS. g Percentage of pDCs in PBMCs in SLE patients with inactive and active disease. h Percentage of pDCs in PBMCs in SLE patients treated with or without hydroxychloroquine (HCQ). i Percentage of pDCs in PBMCs in SLE patients treated with other immunosuppressants (MTX = methotrexate, AZA = azathioprine, MMF = mycophenolate mofetil). j Association between the percentage of pDCs in PBMCs and the dose of prednisolone in patients with SLE. Data are represented as mean ± SEM. ns = not significant; ****P < 0.0001. Two-way ANOVA (b), nonlinear regression (cf and j), unpaired two-tailed t-test (gi).
Fig. 2
Fig. 2. TLR-stimulated pDCs produce less IFN-α and TNF in autoimmunity.
a, b Freshly isolated PBMCs were cultured in the absence or presence of TLR9 (ODN 2216) or TLR7 (ORN R-2336) agonists for 6 h, then IFN-α and TNF production by pDCs was measured using intracellular staining. Results shown are representative of healthy control (HC) and a patient with SLE. The average percentage of IFN-α produced by TLR9-stimulated (c) and TLR7-stimulated (d) pDCs in HC (n = 14), At-Risk (n = 26), SLE (n = 40), and pSS (n = 7) patients. The average percentage of TNF produced by TLR9-stimulated (e) and TLR7-stimulated (f) pDCs in HC (n = 14), At-Risk (n = 26), SLE (n = 40), and pSS (n = 7) patients. g, h Intracellular expression of TLR9 and TLR7 was measured using flow cytometry in HC (n = 7), At-Risk (n = 8), and SLE (n = 19) patients. Data are represented as mean ± SEM. *P < 0.05; **P < 0.01; ***P < 0.001; ****P < 0.0001. Two-way ANOVA (ch).
Fig. 3
Fig. 3. IL-3 triggers TLR-independent production of IL-6 by pDCs.
PBMCs from healthy controls (HC; n = 6), At-Risk individuals (At-Risk; n = 4), and SLE patients (n = 7) were cultured for 18 h in the absence or presence of IL-3 (10 ng/mL). The cells were then stimulated by TLR9 (ODN 2216) or TLR7 (ORN R-2336) agonists for six additional hours. The production of cytokines was measured by intracellular staining. a IL-3 significantly enhanced TLR9-mediated IFN-α production by pDCs of healthy controls (P < 0.0001); this effect was not seen in pDCs of At-Risk (P = 0.94) and SLE (P = 0.53) patients. b IL-3 significantly enhanced TLR7-mediated IFN-α production by pDCs of healthy controls (P < 0.0001); this effect was not that prominent in pDCs of At-Risk (P = 0.71) and SLE (P = 0.43) patients. c Treatment with IL-3 (10 ng/mL) induced the production of IL-6 by pDCs of both healthy controls and SLE patients without exogenous TLR stimulation. d No difference was found in IL-6 production by the pDCs of healthy controls, At-Risk individuals, and SLE patients after stimulation with IL-3. The production of IL-6 was detected by intracellular staining. Data are represented as mean ± SEM. ***P < 0.001; ns = not significant. Two-way ANOVA (ad).
Fig. 4
Fig. 4. pDCs display impaired T-cell activation in autoimmunity.
a Allogeneic naive CD4+ T cells were labeled with CellTrace Violet and cultured alone or with pDCs purified from healthy controls (HC) or patients with active SLE for 5 days in the presence of anti-CD3/CD38 beads at ratio 2:1 to avoid excessive T-cell activation and expansion. T-cell proliferation was analyzed by flow cytometry based on CellTrace Violet dilution. One representative experiment is shown out of four independent experiments. b Average percentage of proliferated CD4+ T cells co-cultured with pDCs from healthy controls (n = 8), At-Risk individuals (n = 7), and SLE patients (n = 7). c Induction of CD4+CD25highFoxP3+ T cells from naive CD4+ T cells co-cultured for 5 days with pDCs from healthy controls or SLE patients in the presence of anti-CD3/CD28 beads at ratio 2:1. One representative experiment is shown out of three independent experiments. d Percentage of CD4+CD25highFoxP3+ T cells derived from the co-culture with pDCs from healthy controls (n = 5), At-Risk individuals (n = 5), and SLE patients (n = 5). fk Allogeneic naive CD4+ T cells were cultured alone or with pDCs from healthy controls or SLE patients for 5 days in the presence of anti-CD3/CD38 beads at ratio 2:1. On the fifth day, the cells were stimulated with PMA/Ionomycin, and the production of TNF (f), IFN-γ (h), and IL-10 (j) by CD4+ T cells was measured by intracellular staining. One representative experiment is shown out of three independent experiments. The average percentage of TNF (g), IFN-γ (i), and IL-10 (k) produced CD4+ T cells co-cultured with pDCs from healthy controls, At-Risk individuals, and SLE patients. Data are represented as mean ± SEM. *P < 0.05; **P < 0.001; ***P < 0.0001; ns = not significant. Two-way ANOVA (b, d, e, g, i, k).
Fig. 5
Fig. 5. pDCs from IFNlow and IFNhigh SLE patients have distinct transcriptomic profiles.
a Sorted pDCs from HC (n = 7), At-Risk (n = 4), and SLE (n = 13) were classified according to the expression level of the IFN score described. b Average expression level of IFN score measured in samples described in a. c Expression level of representative ISGs in sorted pDCs from sample groups described in a. d Differentially expressed transcripts in IFNlow SLE pDCs (n = 543), IFNhigh SLE pDCs (n = 674), and At-Risk pDCs (n = 114) compared to HC pDCs. e Summary of the Reactome Pathway Enrichment in differentially expressed genes of the pDCs from IFNlow and IFNhigh subgroups compared to HC pDCs.
Fig. 6
Fig. 6. pDCs have features of cellular stress and immune senescence in autoimmunity.
a Venn diagram showing the number of differentially expressed transcripts (n = 80) common to both IFNlow and IFNhigh pDCs from SLE patients compared to pDCs from HC. b Reactome Pathway Enrichment in DEGs in differentially expressed genes in IFNlow and IFNhigh pDCs from SLE patients shown in a. c Expression level of representative genes differentially expressed in both IFNlow and IFNhigh pDCs from SLE patients in comparison with pDCs from HC. d Purified pDCs from freshly isolated PBMCs were hybridized without (d; right) or with (d; left) telomere PNA probe. Gates were set in G0/1 phase for both sample cells (pDCs) and tetraploid control cells (1301 cell lines). e Determination of the relative telomere length as the ratio between the telomere signal of pDCs purified from HC (n = 10) and SLE (n = 10) patients and the control cells (1301 cell line) with correction for the DNA index of G0/1 cells. f Viable cells were defined as double negative when stained for annexin V and 7-AAD; viability was assessed at 3 and 6 h after exposure to H2O2. One hundred percent of viable cells were defined by the number of cells alive of the non-H2O2-exposed cells (0 μM) at the two time points. g Freshly isolated PBMCs from healthy donors (n = 4) were exposed to H2O2 (0–500 μM) for 15 min. After H2O2 exposure, cells were washed thoroughly and resuspended in a culture medium before they were stimulated with 2 μM ODN 2216 for 6 h. The production of IFN-α by pDCs was measured in viable cells by intracellular staining. Data are represented as mean ± SEM. ns not significant; *P < 0.05; ****P < 0.001. The unpaired two-tailed t-test (e), 1-way ANOVA (g).
Fig. 7
Fig. 7. Patients with SLE and At-Risk individuals have a diffuse expression of epidermal IFNK.
Association of IFN score A with an active and inactive mucocutaneous disease in SLE patients (a). Association of IFN score A with an active and inactive musculoskeletal disease in SLE patients (b). For graphical representation, mean and SEM were transformed using 2−dCt so that higher expression was shown as a taller bar (a, b). Fold increase in IFN score A of At-Risk individuals (c) in blood (2.21; 95% CI 1.37, 3.53) and skin (28.74; 95% CI 1.29, 639.48) compared to healthy controls. Fold increase in IFN score A of SLE patients (d) in blood (7.80; 95% CI 4.75, 12.80) and skin (479.33; 95% CI 39.32, 5842.78) compared to healthy controls. e Percentage of MxA expression at the protein level in skin biopsies of healthy controls (HC; n = 3), non-lesional skin biopsies of At-Risk individuals (At-Risk; n = 3), and non-lesional skin biopsies of SLE patients (SLE; n = 3). Skin biopsies were hybridized using RNAscope in situ hybridization technology with custom-designed target probes for IFNA2 and IFNK. Hybridization signals were amplified and detected using TSA Plus fluorescein (FITC) for IFNA2 and TSA Plus Cyanine 3 (Cy3) for IFNK. Nuclei were highlighted using DAPI. Representative in situ hybridization images of f healthy control, g IFNhigh At-Risk individual with no clinical or histopathological signs of inflammation, h IFNhigh SLE patient with an active skin lesion. Data are represented as mean ± SEM. Scale bars: 100 µm. ns = not significant; *P < 0.05; ***P < 0.01; ns = not significant. The unpaired two-tailed t-test (a, b), two-way ANOVA (e).
Fig. 8
Fig. 8. Stimulated keratinocytes have a high expression of type I IFNs in autoimmunity.
a IFNK expression in the epidermis of SLE patient with the inactive disease before UV provocation. b IFNK expression in the epidermis of the same SLE patient after UV provocation. ce Human keratinocytes were isolated from fresh skin biopsies and were then cultured in the absence or presence of Poly I:C (1 μg/mL) or Poly dA:dT (100 ng/mL). The expression level of IFNK (c), IFNB1 (d), IFNL1 (e) in keratinocytes from healthy controls (HC), At-Risk individuals (At-Risk), SLE patients (SLE), and patients with cutaneous discoid lupus erythematosus (CDLE) after in vitro culture for 24 h. Data are represented as mean ± SEM. Scale bars: 100 µm. *P < 0.05. Two-way ANOVA (ce).

Comment in

References

    1. Psarras A, Emery P, Vital EM. Type I interferon-mediated autoimmune diseases: pathogenesis, diagnosis and targeted therapy. Rheumatology. 2017;56:1662–1675. - PubMed
    1. Crow MK. Type I interferon in the pathogenesis of lupus. J. Immunol. 2014;192:5459–5468. doi: 10.4049/jimmunol.1002795. - DOI - PMC - PubMed
    1. Deng Y, Tsao BP. Genetic susceptibility to systemic lupus erythematosus in the genomic era. Nat. Rev. Rheumatol. 2010;6:683–692. doi: 10.1038/nrrheum.2010.176. - DOI - PMC - PubMed
    1. Sigurdsson S, et al. Polymorphisms in the tyrosine kinase 2 and interferon regulatory factor 5 genes are associated with systemic lupus erythematosus. Am. J. Hum. Genet. 2005;76:528–537. doi: 10.1086/428480. - DOI - PMC - PubMed
    1. Niewold TB, et al. IRF5 haplotypes demonstrate diverse serological associations which predict serum interferon alpha activity and explain the majority of the genetic association with systemic lupus erythematosus. Ann. Rheum. Dis. 2012;71:463–468. doi: 10.1136/annrheumdis-2011-200463. - DOI - PMC - PubMed

Publication types

MeSH terms