. 2020 Dec 1;11(1):6139.
doi: 10.1038/s41467-020-19976-3.

Glycoproteomics-based signatures for tumor subtyping and clinical outcome prediction of high-grade serous ovarian cancer

Affiliations

Glycoproteomics-based signatures for tumor subtyping and clinical outcome prediction of high-grade serous ovarian cancer

Jianbo Pan et al. Nat Commun. .

Abstract

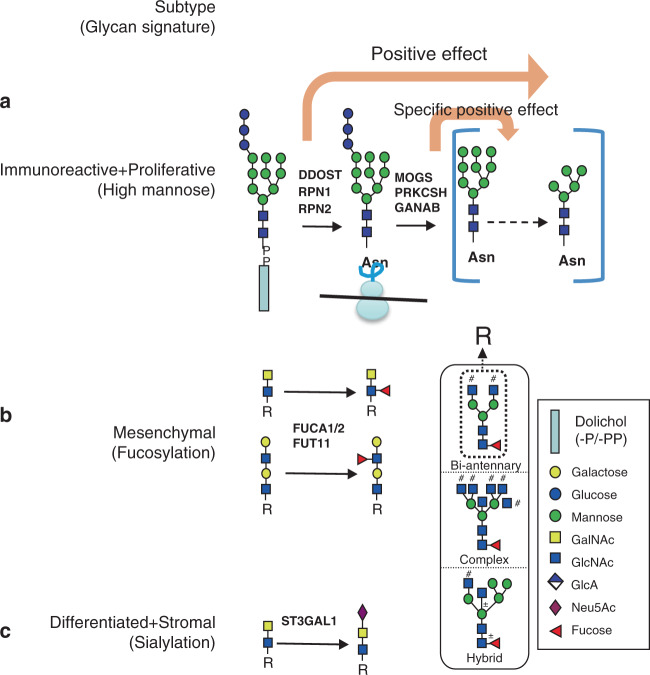
Inter-tumor heterogeneity is a result of genomic, transcriptional, translational, and post-translational molecular features. To investigate the roles of protein glycosylation in the heterogeneity of high-grade serous ovarian carcinoma (HGSC), we perform mass spectrometry-based glycoproteomic characterization of 119 TCGA HGSC tissues. Cluster analysis of intact glycoproteomic profiles delineates 3 major tumor clusters and 5 groups of intact glycopeptides. It also shows a strong relationship between N-glycan structures and tumor molecular subtypes, one example of which being the association of fucosylation with mesenchymal subtype. Further survival analysis reveals that intact glycopeptide signatures of mesenchymal subtype are associated with a poor clinical outcome of HGSC. In addition, we study the expression of mRNAs, proteins, glycosites, and intact glycopeptides, as well as the expression levels of glycosylation enzymes involved in glycoprotein biosynthesis pathways in each tumor. The results show that glycoprotein levels are mainly controlled by the expression of their individual proteins, and, furthermore, that the glycoprotein-modifying glycans correspond to the protein levels of glycosylation enzymes. The variation in glycan types further shows coordination to the tumor heterogeneity. Deeper understanding of the glycosylation process and glycosylation production in different subtypes of HGSC may provide important clues for precision medicine and tumor-targeted therapy.


Conflict of interest statement

The authors declare no competing interests.

Figures

Fig. 1
Fig. 1. Clustering analysis of high-grade serous ovarian carcinoma based on glycoproteomics data.
Bi-clustering of intact glycopeptide expression in 119 tumor tissues. Tumors are displayed as columns, grouped by intact glycopeptide clusters as indicated by different colors. Intact glycopeptides used for the tumor classification are displayed as rows with glycans shown in the right heatmap. Color of each cell indicates Z score (log2 of relative abundance scaled by intact glycopeptide standard deviations) of the intact glycopeptide in that sample. Transcriptome, proteomic-based subtypes, HRD annotations and the proposed SPEG, IGP clusters are indicated in color above the heatmap.
Fig. 2
Fig. 2. Specificity of intact glycopeptides and glycans in tumor clusters.
a Correspondence of intact glycopeptides and proteomics clusters. Values correspond to the square of number of subjects for each proteomic subtype that belong to a corresponding IGP cluster divided by both sample number of the proteomic subtype and sample number of the IGP cluster. * Indicates a p value <0.01 based on a hypergeometric test. b Averaged Z score of each group of intact glycopeptides. For every group in IGP cluster 1, n = 27 samples; for every group in IGP cluster 2, n = 49 samples; for every group in IGP cluster 3, n = 43 samples. The box outlines denote the IQR, the solid line in the box denotes median “averaged Z score”, and the whiskers outside of the box extend to the minimum and maximum “averaged Z score”. c The glycans for each IGP group. d Three examples show the different expressions in different tumor clusters. In IGP cluster 1, n = 27 samples; in IGP cluster 2, n = 49 samples; in IGP cluster 3, n = 43 samples. The box outlines denote the IQR, the solid line in the box denotes median intensity, and the whiskers outside of the box extend to the minimum and maximum intensities. Source data are provided as a Source data file.
Fig. 3
Fig. 3. Kaplan–Meier plot of overall survival stratified by IGP clusters or IGP group signatures.
a Three clusters. In IGP cluster 1, n = 27 samples; in IGP cluster 2, n = 49 samples; in IGP cluster 3, n = 43 samples. b Group 1 signature. c Group 3 signature. d Group 4 signature. In bd, for both groups with highest scores and lowest scores, n = 50 samples. Logrank_test without adjustment is used in bd.
Fig. 4
Fig. 4. Sample-wise correlation analysis between glycosites and proteins.
a Barplot of sample-wise correlation between glycosite-containing peptides and global proteins of 119 HGSCs. IGP clusters are shown in bottom panel. b Boxplot of sample-wise correlations in 3 IGP clusters. In IGP cluster 1, n = 27 samples; in IGP cluster 2, n = 49 samples; in IGP cluster 3, n = 43 samples. p = 0.272 (IGP cluster 1 vs. IGP cluster 2), p = 8.73e−3 (IGP cluster 1 vs. IGP cluster 3), and p = 2.65e−5 (IGP cluster 2 vs. IGP cluster 3) two-tailed unpaired Student’s t-test. The box outlines denote the IQR, the solid line in the box denotes median correlation value, and the whiskers outside of the box extend to the minimum and maximum correlation values. c Glyco-related gene variations at mutation, copy number amplification, mRNA, and protein levels. The number of up-regulated glyco-related gene are compared between top 50 samples with higher correlations and 50 samples with lower correlations using two-tailed unpaired Student’s t-test without adjustment. NS indicates non-significance, * indicates significance. Only protein level shows a significant difference (p = 0.03). Source data are provided as a Source data file.
Fig. 5
Fig. 5. Correlation analysis between mRNA, proteins, and intact glycopeptides.
a Correlation analysis following the central dogma. b Correlation analysis between proteins and intact glycopeptides in five subgroups of intact glycopeptides with different glycans. In group 1, n = 26 glycopeptides; In group 2, n = 79 glycopeptides; In group 3, n = 85 glycopeptides; In group 4, n = 43 glycopeptides; In group 5, n = 95 glycopeptides. For b, the box outlines denote the IQR, the solid line in the box denotes median correlation value, and the whiskers outside of the box extend to the minimum and maximum correlation values. Source data are provided as a Source data file.
Fig. 6
Fig. 6. Heatmap of expression correlation between N-linked glycosylation enzyme and intact glycopeptides with different glycans.
a Bi-clustering was performed on correlations between intact glycopeptides (column) and glycosylation enzyme expression in total protein level (row) across 119 tumor samples. Red indicates positive correlation while blue indicates negative correlation. b Boxplot panel of the correlation difference between enzyme expression (protein level) and specific intact glycopeptides. For PRKCSH, n (No) = 128 glycopeptides, n (Yes) = 47 glycopeptides, p = 1.84e-15 (Yes vs. No); For MAN1A1, n (No) = 128 glycopeptides, n (Yes) = 47 glycopeptides, p = 4.93e−17 (Yes vs. No); for FUCA1, n (No) = 97 glycopeptides, n (Yes) = 78 glycopeptides, p = 4.10e−4 (Yes vs. No); for ST3GAL1, n (No) = 117 glycopeptides, n (Yes) = 58 glycopeptides, p = 9.04e−7 (Yes vs. No). Two-tailed unpaired t-test without adjustment is used in b. The box outlines denote the IQR, the solid line in the box denotes median correlation value, and the whiskers outside of the box extend to the minimum and maximum correlation values. Source data are provided as a Source data file.
Fig. 7
Fig. 7. Glycoprocessing models of different HGSC subtypes.
To summarize the molecular feature of ovarian cancer subtypes, we proposed three models involving glycans, glycosylation enzymes, and glycan biosynthesis pathways.

References

    1. Torre, L. A. et al. Ovarian cancer statistics, 2018. CA Cancer J. Clin.68, 284–296 (2018). - PMC - PubMed
    1. Siegel, R. L., Miller, K. D. & Jemal, A. Cancer statistics, 2018. CA Cancer J. Clin.68, 7–30 (2018). - PubMed
    1. Peres, L. C. et al. Invasive epithelial ovarian cancer survival by histotype and disease stage. J. Natl Cancer Inst.111, 60–68 (2019). - PMC - PubMed
    1. Swanton, C. Intratumor heterogeneity: evolution through space and time. Cancer Res.72, 4875–4882 (2012). - PMC - PubMed
    1. Kim, S. et al. Tumor evolution and chemoresistance in ovarian cancer. NPJ Precis. Oncol.2, 20 (2018). eCollection 2018. - PMC - PubMed

Publication types