. 2020 Dec 1;10(1):20923.
doi: 10.1038/s41598-020-77859-5.

Abrupt warming and salinification of intermediate waters interplays with decline of deep convection in the Northwestern Mediterranean Sea

Affiliations

Abrupt warming and salinification of intermediate waters interplays with decline of deep convection in the Northwestern Mediterranean Sea

Félix Margirier et al. Sci Rep. .

Abstract

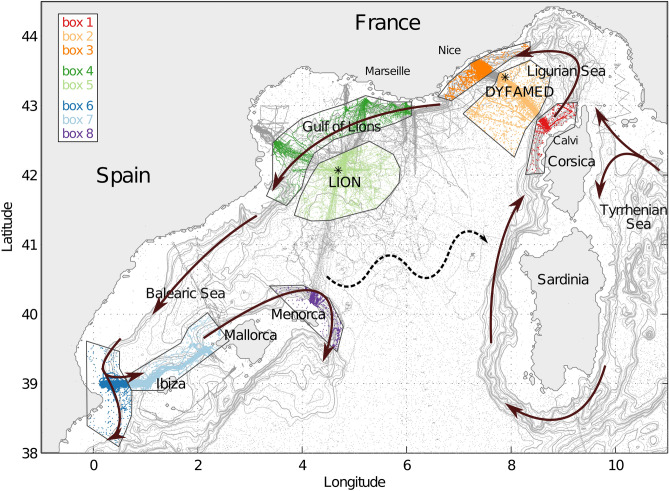
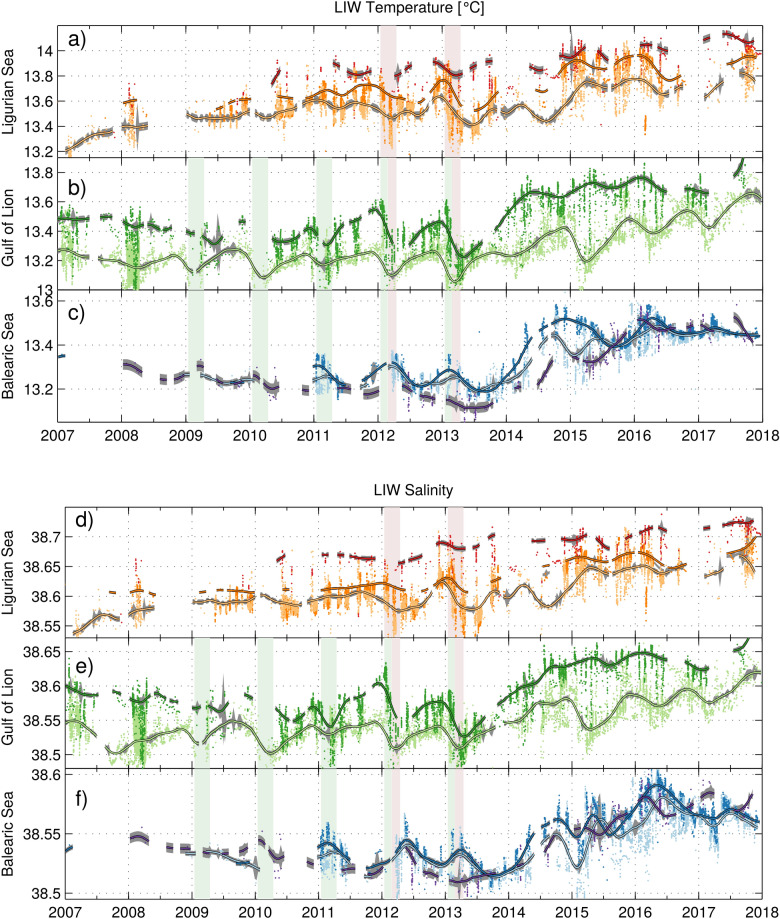
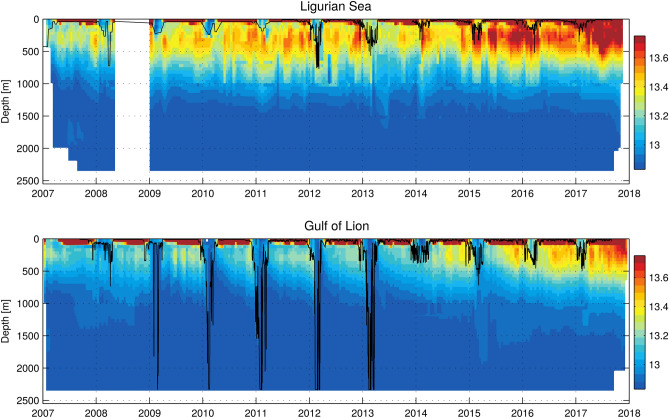
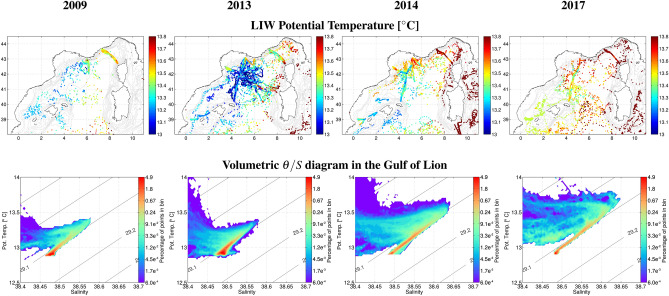
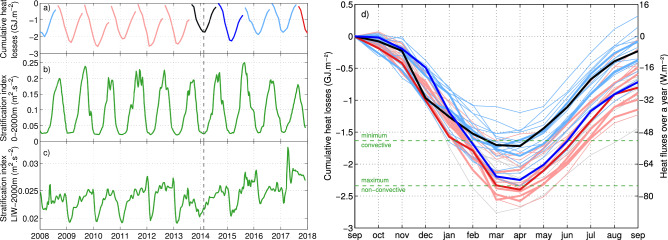
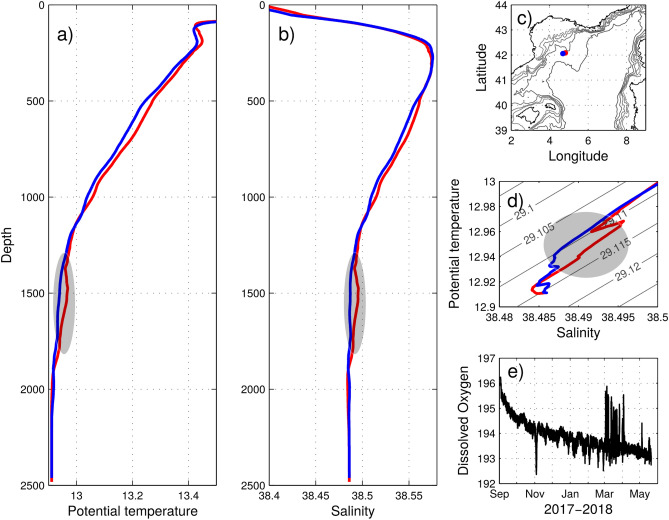
The Mediterranean Sea is a hotspot for climate change, and recent studies have reported its intense warming and salinification. In this study, we use an outstanding dataset relying mostly on glider endurance lines but also on other platforms to track these trends in the northwestern Mediterranean where deep convection occurs. Thanks to a high spatial coverage and a high temporal resolution over the period 2007-2017, we observed the warming (+0.06 [Formula: see text]C year[Formula: see text]) and salinification (+0.012 year[Formula: see text]) of Levantine Intermediate Water (LIW) in the Ligurian Sea. These rates are similar to those reported closer to its formation area in the Eastern Mediterranean Sea. Further downstream, in the Gulf of Lion, the intermediate heat and salt content were exported to the deep layers from 2009 to 2013 thanks to deep convection processes. In 2014, a LIW step of +0.3 [Formula: see text]C and +0.08 in salinity could be observed concomitant with a weak winter convection. Warmer and more saline LIW subsequently accumulated in the northwestern basin in the absence of intense deep convective winters until 2018. Deep stratification below the LIW thus increased, which, together with the air-sea heat fluxes intensity, constrained the depth of convection. A key prognostic indicator of the intensity of deep convective events appears to be the convection depth of the previous year.


Conflict of interest statement

The authors declare no competing interests.

Figures

Figure 1
Figure 1
Color-coded regional areas: orange Ligurian Sea, green Gulf of Lion and blue Balearic Sea. Each region is decomposed in sub-regions defined by the general circulation. The scattered dots represent all the profiles collected between 01/01/2007 and 01/01/2018 in the respective regional areas in color and outside in grey. The two mooring locations (LION and DYFAMED) are indicated by the black stars. The LIW general circulation is indicated by the arrows and the north Balearic Front by the dashed one. The background map was generated with ETOPO5 (Data Announcement 88-MGG-02, Digital relief of the Surface of the Earth. NOAA, National Geophysical Data Center, Boulder, Colorado, 1988).
Figure 2
Figure 2
Temperature and salinity 2007–2018 time series in the: (a,d) Ligurian Sea, (b,e) Gulf of Lion and (c,f) Balearic Sea . The color-code is that of Fig. 1. The winters with deep convection in the Ligurian Sea and the Gulf of Lion are indicated by purple and green vertical patches, respectively. The black contoured curves represent the 90-day running mean and the grey patches around them the running standard error in each regional subset of data (the very large number of points explains its low value).
Figure 3
Figure 3
Depth-time diagrams of temperature at (top) DYFAMED (43.41 N 7.89 E) and (bottom) LION (42.04 N 4.68 E) for the Ligurian Sea and Gulf of Lion respectively. Here, all the profiles within a 15 km radius from the mooring location were used, and merged with the mooring line measurements. The black contour represents the mixed layer depth, computed as in Houpert et al..
Figure 4
Figure 4
(top row) LIW core temperature in the northwestern Mediterranean Sea during the two contrasted periods (2009–2013 and 2014–2017). LIW temperature and salinity (not shown) remain constant prior to 2014, the first winter with no deep convection. The heat and salt then increased throughout the basin. (bottom row) Year by year volumetric θ-S diagrams with all profiles in Area 5 ’offshore Gulf of Lion’ (Fig. 1). Red accounts for a high density of points and thus volume of water. The period with deep convection (of these only 2009 and 2013 are shown) presents a high volume of waters with the same properties (WMDW), while in the following years the LIW occupies a larger portion of the water column, as the waters are distributed on the mixing line between the WMDW and LIW. The background map was generated with ETOPO5 (Data Announcement 88-MGG-02, Digital relief of the Surface of the Earth. NOAA, National Geophysical Data Center, Boulder, Colorado, 1988).
Figure 5
Figure 5
(a) Cumulative monthly heat losses to the atmosphere over each year at the LION mooring location, starting in September of the previous year and finishing in August (light red for convective years, light blue for non-convective years, the year labels on the x-axis are positioned on January of each particular year). The 2014 and 2015 (starting in September 2013 and 2014) non-convective years are indicated in black and dark blue, and the 2018 (starting in September 2017) return of convection in dark red (only the first part of winter 2018 is shown here, see (d) for the whole coverage). The stratification index (see Methods): (b) 0–2000 m and (c) LIW-2000 m at the LION mooring line location are also represented. The dashed black vertical line represents the time of the regime shift. (d) Cumulative monthly heat losses to the atmosphere over each year (starting in September of the previous year, see (a)), in light red for deep convective years (identified as year with convection reaching more than 1000 m deep), light blue for non-convective ones (when convection reached less than 1000 m deep) and in grey for unreported years, starting in 1979. The black line indicates the 2014 transition winter (cumulative monthly heat losses over a year starting in September 2013 with a minimum of − 1.71 GJ m-2: equivalent to − 94.2 W m-2 over 7 months after which that minimum is observed), the dark blue the 2015 ensuing year (− 2.24 GJ m-2: equivalent to − 123.4 W m-2 over 7 months). The years 2008–2018 are plotted in thicker lines than the 1979–2007 historical period. The return of convection in winter 2018 is indicated in dark red (cumulative minimum of − 2.39 GJ m-2: equivalent to − 131.7 W m-2 over 7 months). The minimum cumulative loss initiating deep convection was − 1.63 GJ m-2: equivalent to − 104.8 W m-2 over 6 months, the maximum with no deep convection was − 2.33 GJ m-2: equivalent to − 128.4 W m-2 over 7 months.
Figure 6
Figure 6
(a) Potential temperature and (b) salinity depth profiles collected during the MOOSE-GE 2018 cruise in spring: (c) leg 1, stations 040 in blue (21/04/2018 19h15 UTC) and 041 in red (21/04/2018 21h52 UTC). (d) θ-S diagram for the two corresponding profiles. The newly formed deep waters detected on profile 041 in red are marked by the grey patch. They were detected down to 1800 m. (e) Dissolved oxygen (μ mol kg-1) time series at 2000 m between 04/09/2017 and 22/05/2018 recorded at the LION mooring line.

References

    1. Lascaratos A, Nittis K. A high resolution 3-d numerical study of intermediate water formation in the levantine sea. J. Geophys. Res. 1998;1031:18497–18512. doi: 10.1029/98JC01196. - DOI
    1. Nadia P, Masetti E. Variability of the large scale general circulation of the mediterranean sea from observations and modelling: A review. Palaeogeogr. Palaeoclimatol. Palaeoecol. 2000;158:153–173. doi: 10.1016/S0031-0182(00)00048-1. - DOI
    1. Millot C, Taupier-Letage I. Circulation in the Mediterranean Sea. Hanb. Environ. Chem. 2005;5K:29–66. doi: 10.1007/b107143. - DOI
    1. Testor, P. & Gascard, J.-C. Post-convection spreading phase in the northwestern mediterranean sea. Deep Sea Res. Part I Oceanogr. Res. Papers869–893. 10.1016/j.dsr.2006.02.004 (2006).
    1. Menna M, Poulain P-M. Mediterranean intermediate circulation estimated from argo data in 2003–2010. Ocean Sci. 2010;6:331–343. doi: 10.5194/os-6-331-2010. - DOI

Publication types