. 2020 Nov 12:11:586226.
doi: 10.3389/fphys.2020.586226. eCollection 2020.

Characterization of the Blood Brain Barrier Disruption in the Photothrombotic Stroke Model

Affiliations

Characterization of the Blood Brain Barrier Disruption in the Photothrombotic Stroke Model

Rebecca Z Weber et al. Front Physiol. .

Abstract

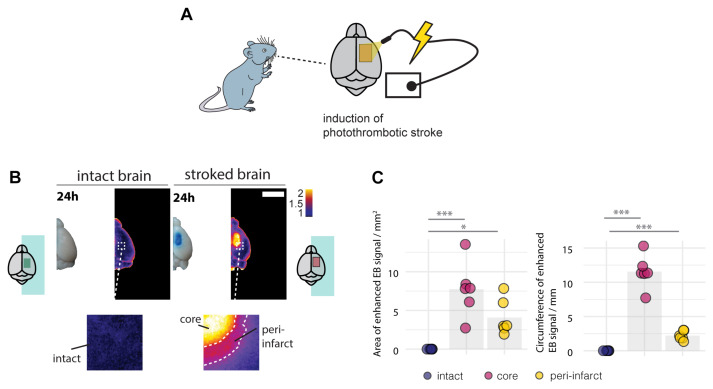
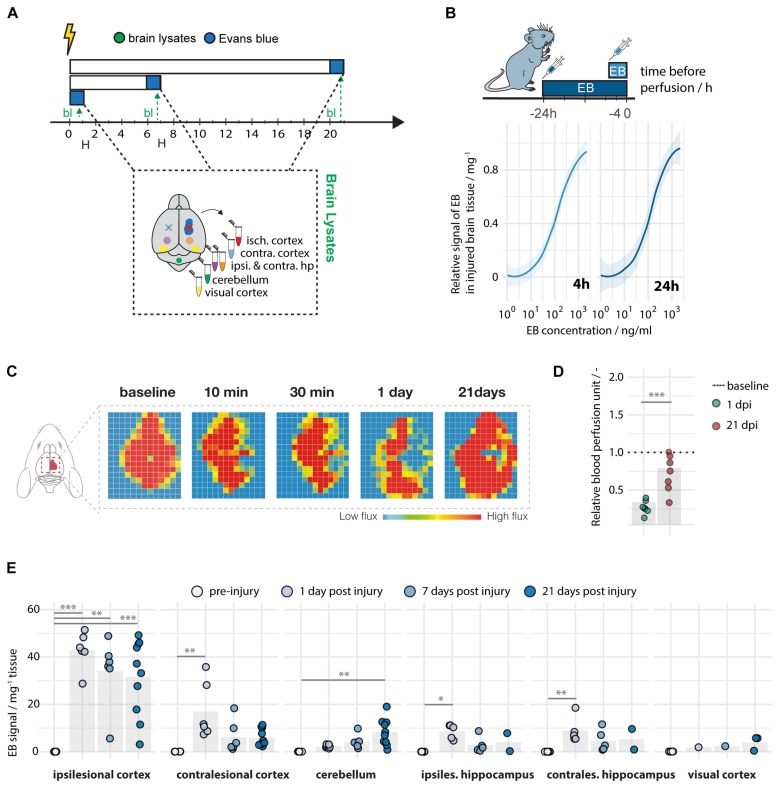
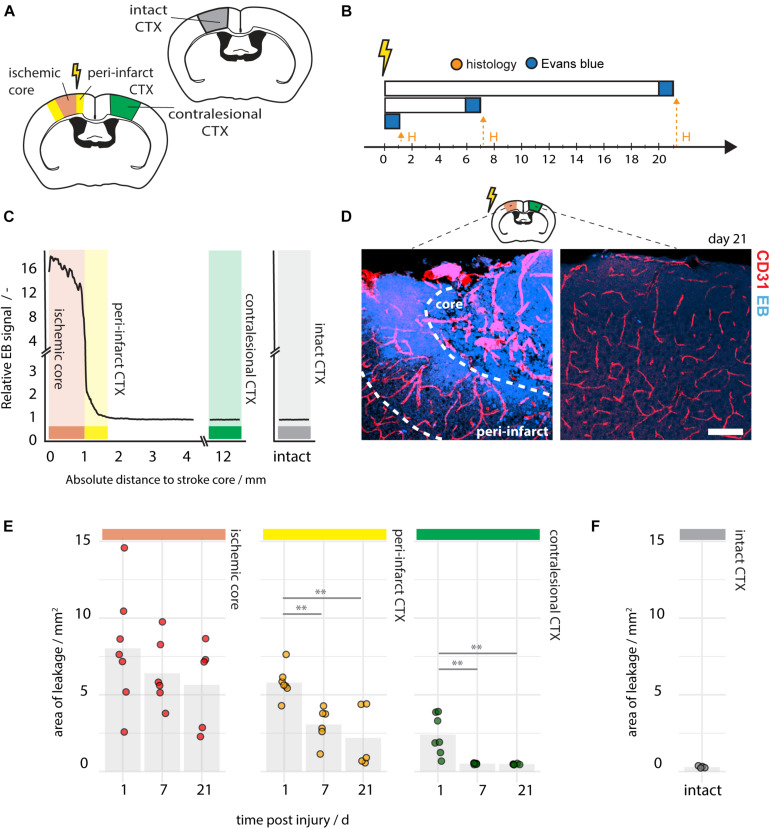
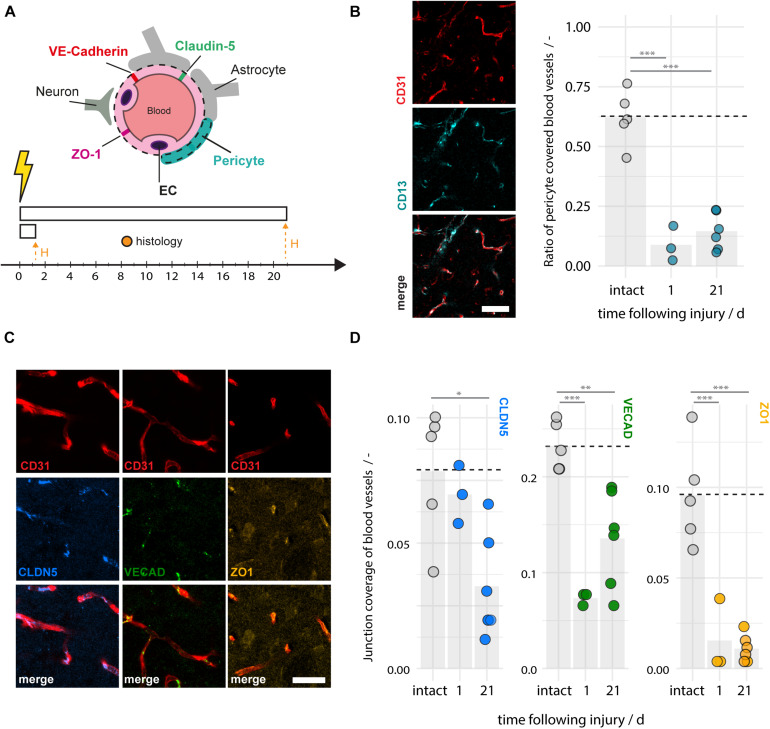
Blood brain barrier (BBB) damage is an important pathophysiological feature of ischemic stroke which significantly contributes to development of severe brain injury and therefore is an interesting target for therapeutic intervention. A popular permanent occlusion model to study long term recovery following stroke is the photothrombotic model, which so far has not been anatomically characterized for BBB leakage beyond the acute phase. Here, we observed enhanced BBB permeability over a time course of 3 weeks in peri-infarct and core regions of the ischemic cortex. Slight increases in BBB permeability could also be seen in the contralesional cortex, hippocampus and the cerebellum at different time points, regions where lesion-induced degeneration of pathways is prominent. Severe damage of tight and adherens junctions and loss of pericytes was observed within the peri-infarct region. Overall, the photothrombotic stroke model reproduces a variety of features observed in human stroke and thus, represents a suitable model to study BBB damage and therapeutic approaches interfering with this process.

Keywords: BBB; edema; ischemia; leakage; pericytes; photothrombotic stroke; tight junctions.


Figures

FIGURE 1
FIGURE 1
Disruption of the blood brain barrier 24 h following the photothrombotic stroke. (A) Schematic representation of photothrombotic stroke induction in the sensorimotor cortex. (B) Macroscopic and pseudo-colored image in stroked and non-stroked animals showing the Evans blue (EB) extravasation in stroke core and penumbra. Scale bar: 5 mm. (C) Quantitative assessment of area and circumference of EB signals. Each dot in the plots represents one animal and significance of mean differences between the groups was assessed using Tukey’s HSD. Asterisks indicate significance: P < 0.05, ∗∗P < 0.01, ∗∗∗P < 0.001.
FIGURE 2
FIGURE 2
Spatiotemporal leakage following photothrombotic stroke. (A) Schematic representation of time course at baseline (N = 5), day 1 (N = 5–10), day 7 (N = 5–7), and day 21 (N = 2–10) following stroke. (B) Limit of detection and quantification of Evans blue in brain tissue. (C) Representative images of images of cerebral blood perfusion at 10, 30 min, 1 and 21 days following stroke. (D) Quantification of cerebral blood perfusion relative to baseline. (E) Quantitative assessment of Evans blue signal across different brain regions and time points. Data are represented as mean ± SD. Each dot in the plots represents one animal and significance of mean differences between the groups was assessed using Tukey’s HSD. Asterisks indicate significance: P < 0.05, ∗∗P < 0.01, ∗∗∗P < 0.001 isch cx; ischemic cortex, contra cx; contralesional cortex, hp; hippocampus, cb; cerebellum, vcx, visual cortex. EB; Evans Blue, bl; brain lysates.
FIGURE 3
FIGURE 3
Histological assessment of BBB permeability following photothrombotic stroke. (A) Schematic representation of region of interest within the ischemic core (red), the peri-infarct region (yellow), the contralesional cortex (green), and the intact cortex (gray). (B) Time course of the experimental pipeline of 1 day (N = 8), 7 days (N = 6), and 21 days (N = 5) following injury. (C) Spatial distribution of EB signal along the ischemic, contralesional and intact cortex at 21 dpi. (D) Representative images of EB signal in the peri-infarct and contralesional region at 21 dpi. Scale bar: 100 μm. (E) Quantification of EB -positive area of the stroke core, the peri-infarct cortex and the contralesional cortex at days 1, 7, and 21 post injury. (F) EB -positive area in intact mice (N = 4). Each dot in the plots represents one animal and significance of mean differences between the groups was assessed using unpaired two-tailed one-sample Student’s t-test. Asterisks indicate significance: ∗∗P < 0.01. Dpi, days post injury; H, histology; ctx, cortex; EB, Evans blue.
FIGURE 4
FIGURE 4
Disruption of pericyte coverage and tight and adherens junction proteins in the peri-infarct region 1–21 days after photothrombotic stroke. (A) Schematic representation of blood brain barrier composition and time course of experiment (N = 3–6). (B) Representative images of blood vessels (CD31, red) covered by pericytes (CD13, cyan) and the quantitative evaluation of pericyte coverage in intact and peri-infarct cortex at 1 and 21dpi. Scale bar: 50 μm. (C) Representative images of tight and adherens junction proteins Claudin5 (blue), VE-Cadherin (green), and ZO-1 (yellow) associated with blood vessels (CD31, red). Scale bar: 20 μm. (D) Quantitative evaluation of tight and adherens junction coverage of blood vessels in the intact and peri-infarct cortex at 1 and 21 dpi. Each dot in the plots represents one animal and significance of mean differences between the groups was assessed using unpaired two-tailed one-sample Student’s t-test. Asterisks indicate significance: P < 0.05, ∗∗P < 0.01, ∗∗∗P < 0.001. CTX, cortex, H, histology.

References

    1. Abdullahi W., Tripathi D., Ronaldson P. T. (2018). Blood-brain barrier dysfunction in ischemic stroke: targeting tight junctions and transporters for vascular protection. Am. J. Physiol. Cell Physiol. 315 C343–C356. 10.1152/ajpcell.00095.2018 - DOI - PMC - PubMed
    1. Allred R. P., Adkins D. L., Woodlee M. T., Husbands L. C., Maldonado M. A., Kane J. R., et al. (2008). The vermicelli handling test: a simple quantitative measure of dexterous forepaw function in rats. J. Neurosci. Methods 170 229–244. 10.1016/j.jneumeth.2008.01.015 - DOI - PMC - PubMed
    1. Armulik A., Genové G., Mäe M., Nisancioglu M. H., Wallgard E., Niaudet C., et al. (2010). Pericytes regulate the blood–brain barrier. Nature 468 557–561. 10.1038/nature09522 - DOI - PubMed
    1. Baumgartner P., El Amki M., Bracko O., Luft A. R., Wegener S. (2018). Sensorimotor stroke alters hippocampo-thalamic network activity. Sci. Rep. 8:15770. 10.1038/s41598-018-34002-9 - DOI - PMC - PubMed
    1. Belayev L., Busto R., Zhao W., Ginsberg M. D. (1996). Quantitative evaluation of blood-brain barrier permeability following middle cerebral artery occlusion in rats. Brain Res. 739 88–96. 10.1016/s0006-8993(96)00815-3 - DOI - PubMed

LinkOut - more resources