

Prediction of the World Health Organization Grade of rectal neuroendocrine tumors based on CT histogram analysis
- PMID: 33263225
- PMCID: PMC7877354
- DOI: 10.1002/cam4.3628
Prediction of the World Health Organization Grade of rectal neuroendocrine tumors based on CT histogram analysis
Abstract
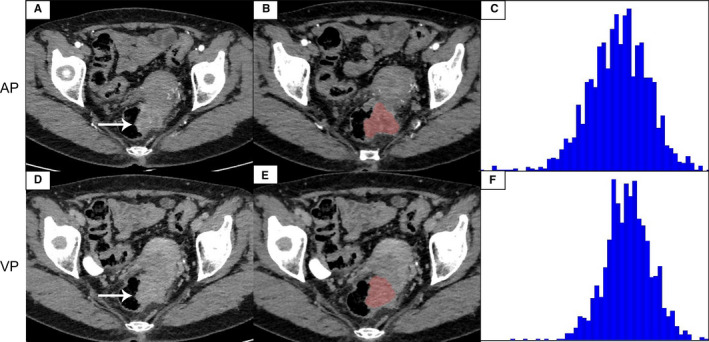
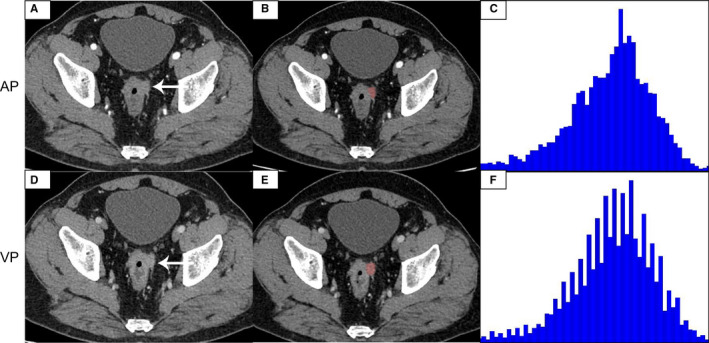
Objectives: To investigate the diagnostic value of contrast-enhanced computed tomography (CECT) histogram analysis in predicting the World Health Organization (WHO) grade of rectal neuroendocrine tumors (R-NETs).
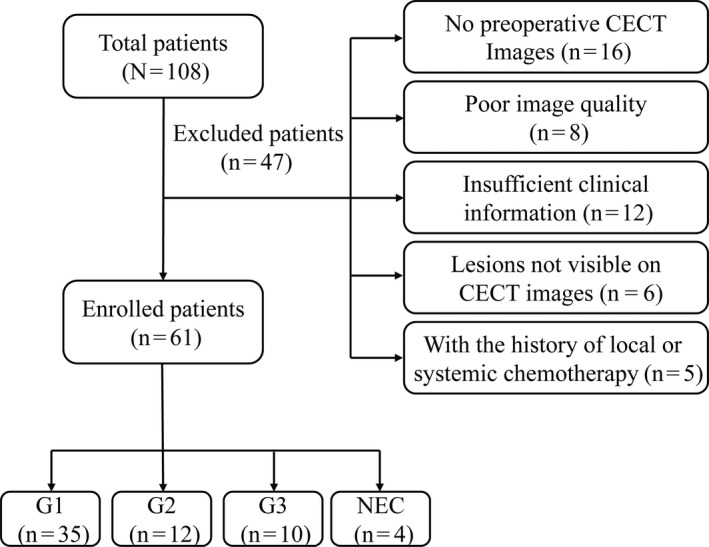
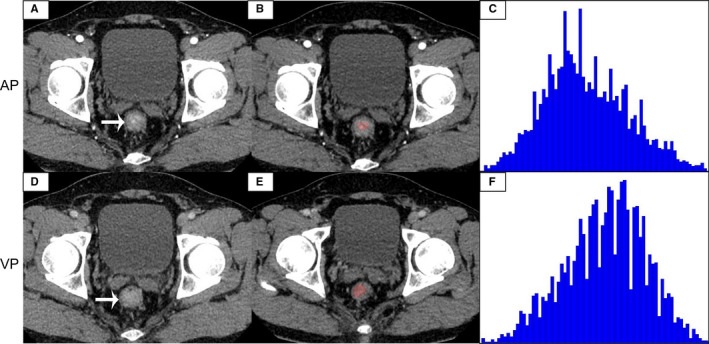
Materials and methods: A total of 61 (35 G1, 12 G2, 10 G3, and 4 NECs) patients who underwent preoperative CECT and treated with surgery to be confirmed as R-NETs were included in this study from January 2014 to May 2019. We depicted ROIs and measured the CECT texture parameters (mean, median, 10th, 25th, 75th, 90th percentiles, skewness, kurtosis, and entropy) from arterial phase (AP) and venous phase (VP) images by two radiologists. We calculated intraclass correlation coefficient (ICC) and compared the histogram parameters between low-grade (G1) and higher grade (HG) (G2/G3/NECs) by applying appropriate statistical method. We obtained the optimal parameters to identify G1 from HG using receiver operating characteristic (ROC) curves.
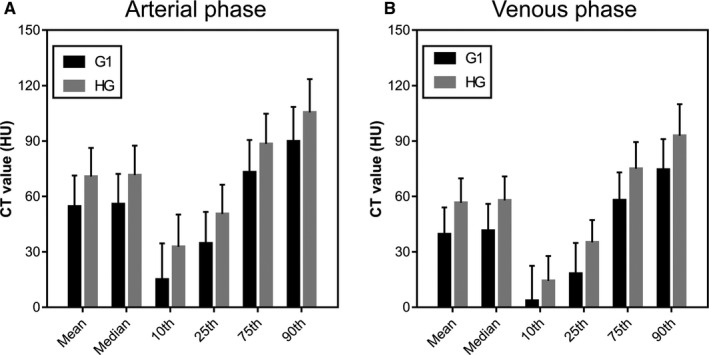
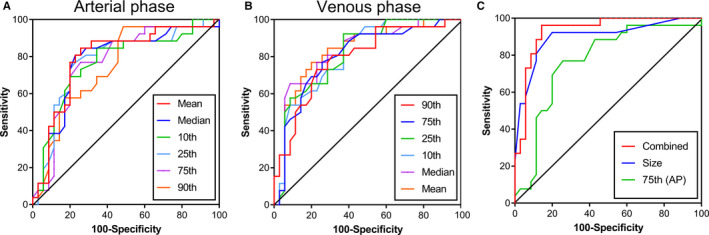
Results: The capability of AP and VP histogram parameters for differentiating G1 from HG was similar in several histogram parameters (mean, median, 10th, 25th, 75th, and 90th percentiles) (all p < 0.001). Skewness, kurtosis, and entropy on AP images showed no significant differences between G1 and HG (p = 0.853, 0.512, 0.557, respectively). Entropy on VP images was significantly different (p = 0.017) between G1 and HG, however, skewness and kurtosis showed no significant differences (p = 0.654, 0.172, respectively). ROC analysis showed a good predictive performance between G1 and HG, and the 75th (AP) generated the highest area under the curve (AUC = 0.871), followed by the 25th (AP), mean (VP), and median (VP) (AUC = 0.864). Combined the size of tumor and the 75th (AP) generated the highest AUC.
Conclusions: CECT histogram parameters, including arterial and venous phases, can be used as excellent indicators for predicting G1 and HG of rectal neuroendocrine tumors, and the size of the tumor is also an important independent predictor.
Keywords: computed tomography; histogram analysis; the grade rectal neuroendocrine tumors.
© 2020 The Authors. Cancer Medicine published by John Wiley & Sons Ltd.
Conflict of interest statement
The authors of this manuscript declare that there is no conflict of interest that could be perceived as prejudicing the impartiality of the research reported.
Figures
Similar articles
-
Usefulness of texture analysis for grading pancreatic neuroendocrine tumors on contrast-enhanced computed tomography and apparent diffusion coefficient maps.Jpn J Radiol. 2021 Jan;39(1):66-75. doi: 10.1007/s11604-020-01038-9. Epub 2020 Sep 3. Jpn J Radiol. 2021. PMID: 32885378
-
Differentiation of atypical pancreatic neuroendocrine tumors from pancreatic ductal adenocarcinomas: Using whole-tumor CT texture analysis as quantitative biomarkers.Cancer Med. 2018 Oct;7(10):4924-4931. doi: 10.1002/cam4.1746. Epub 2018 Aug 27. Cancer Med. 2018. PMID: 30151864 Free PMC article.
-
Non-small cell lung cancer: Whole-lesion histogram analysis of the apparent diffusion coefficient for assessment of tumor grade, lymphovascular invasion and pleural invasion.PLoS One. 2017 Feb 16;12(2):e0172433. doi: 10.1371/journal.pone.0172433. eCollection 2017. PLoS One. 2017. PMID: 28207858 Free PMC article.
-
[Neuroendocrine neoplasms of the appendix and colorectum].Pathologe. 2011 Jul;32(4):314-20. doi: 10.1007/s00292-011-1438-y. Pathologe. 2011. PMID: 21655999 Review. German.
-
CT texture analysis using the filtration-histogram method: what do the measurements mean?Cancer Imaging. 2013 Sep 23;13(3):400-6. doi: 10.1102/1470-7330.2013.9045. Cancer Imaging. 2013. PMID: 24061266 Free PMC article. Review.
Cited by
-
Rectal neuroendocrine neoplasms: what the radiologists should know.Abdom Radiol (NY). 2022 Dec;47(12):4016-4031. doi: 10.1007/s00261-022-03474-9. Epub 2022 Mar 14. Abdom Radiol (NY). 2022. PMID: 35288791 Review.
-
Correlation of four-phase CT findings of rectal neuroendocrine neoplasms with different World Health Organization grades.Abdom Radiol (NY). 2023 Mar;48(3):855-864. doi: 10.1007/s00261-022-03771-3. Epub 2022 Dec 28. Abdom Radiol (NY). 2023. PMID: 36576516
-
Differentiating gastric schwannoma from gastric stromal tumor (≤5 cm) by histogram analysis based on iodine-based material decomposition images: a preliminary study.Front Oncol. 2023 Nov 17;13:1243300. doi: 10.3389/fonc.2023.1243300. eCollection 2023. Front Oncol. 2023. PMID: 38044988 Free PMC article.
-
Prediction of Ki-67 expression in gastric gastrointestinal stromal tumors using histogram analysis of monochromatic and iodine images derived from spectral CT.Cancer Imaging. 2024 Dec 31;24(1):173. doi: 10.1186/s40644-024-00820-6. Cancer Imaging. 2024. PMID: 39741326 Free PMC article.
-
Assessment of chemotherapy resistance changes in human colorectal cancer xenografts in rats based on MRI histogram features.Front Oncol. 2024 Jan 31;14:1301649. doi: 10.3389/fonc.2024.1301649. eCollection 2024. Front Oncol. 2024. PMID: 38357206 Free PMC article.
References
-
- Cives M, Strosberg JR. Gastroenteropancreatic neuroendocrine tumors. CA Cancer J Clin. 2018;68(6):471‐487. - PubMed
-
- Frilling A, Akerström G, Falconi M, et al. Neuroendocrine tumor disease: an evolving landscape. Endocr Relat Cancer. 2012;19(5):R163‐R185. - PubMed
-
- Fraenkel M, Kim M, Faggiano A, de Herder WW, Valk GD, Knowledge N. Incidence of gastroenteropancreatic neuroendocrine tumours: a systematic review of the literature. Endocr Relat Cancer. 2014;21(3):R153‐R163. - PubMed
-
- Anthony LB, Strosberg JR, Klimstra DS, et al. The NANETS consensus guidelines for the diagnosis and management of gastrointestinal neuroendocrine tumors (nets): well‐differentiated nets of the distal colon and rectum. Pancreas. 2010;39(6):767‐774. - PubMed
Publication types
MeSH terms
Grants and funding
LinkOut - more resources
Full Text Sources
Medical
