. 2020 Dec 2:9:e60223.
doi: 10.7554/eLife.60223.

Analysis of the immune response to sciatic nerve injury identifies efferocytosis as a key mechanism of nerve debridement

Affiliations

Analysis of the immune response to sciatic nerve injury identifies efferocytosis as a key mechanism of nerve debridement

Ashley L Kalinski et al. Elife. .

Abstract

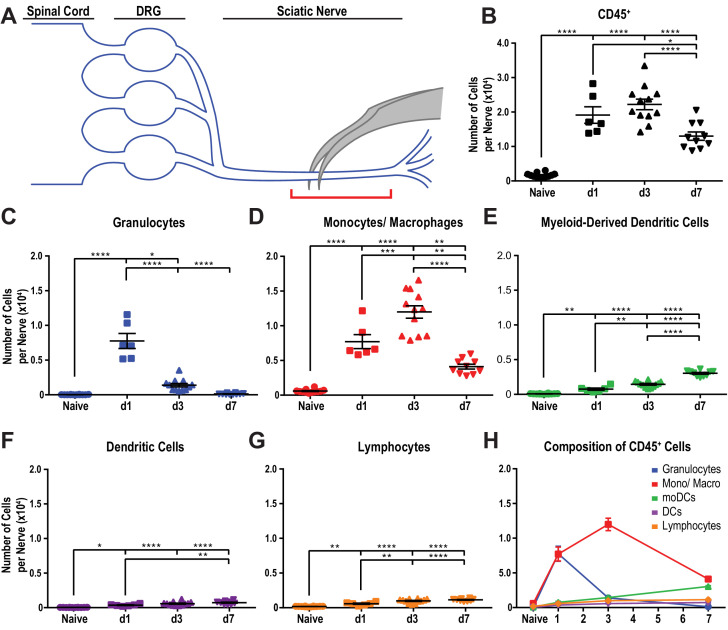
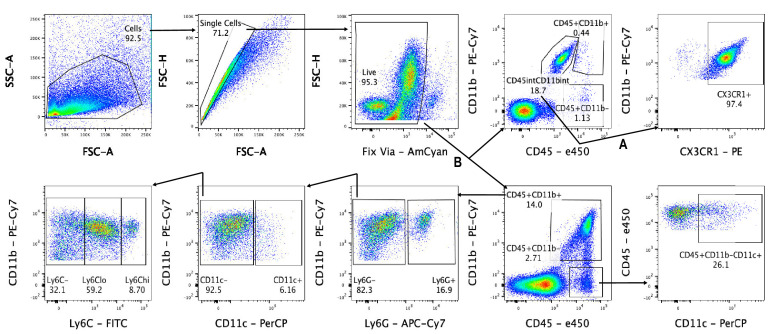
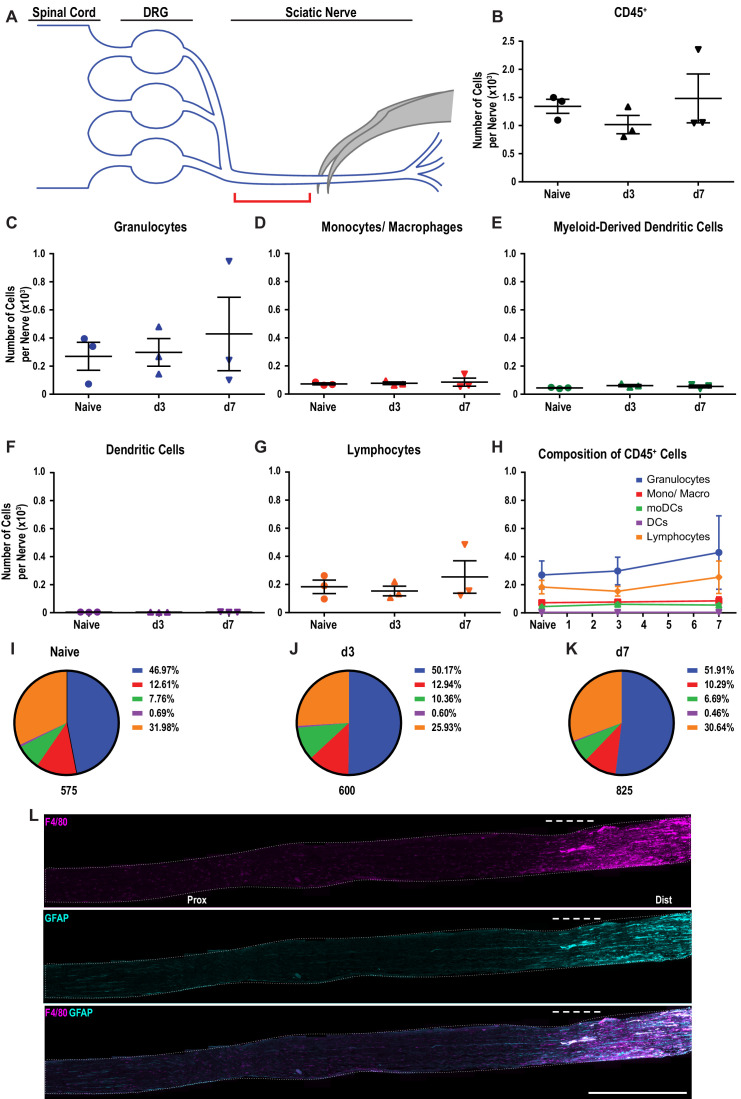
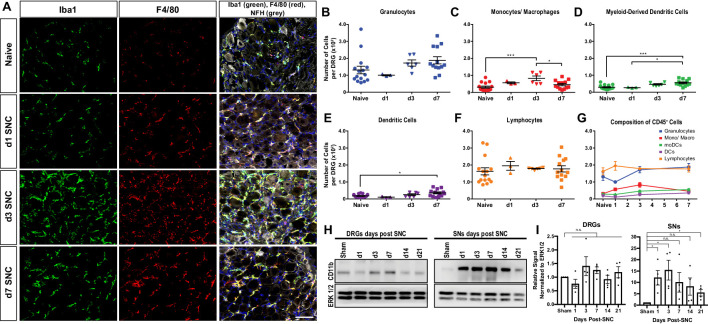
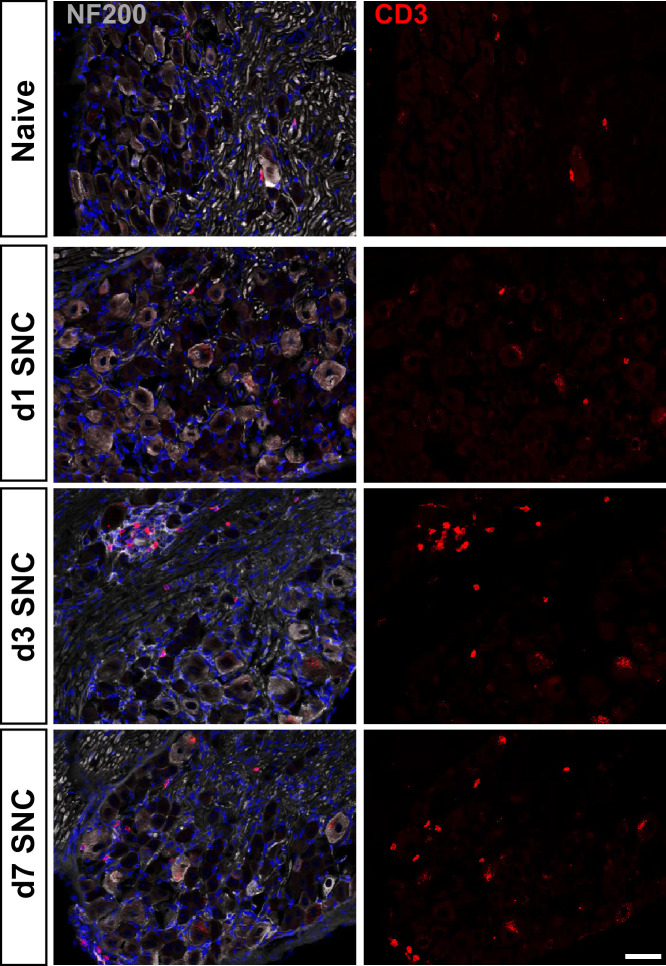
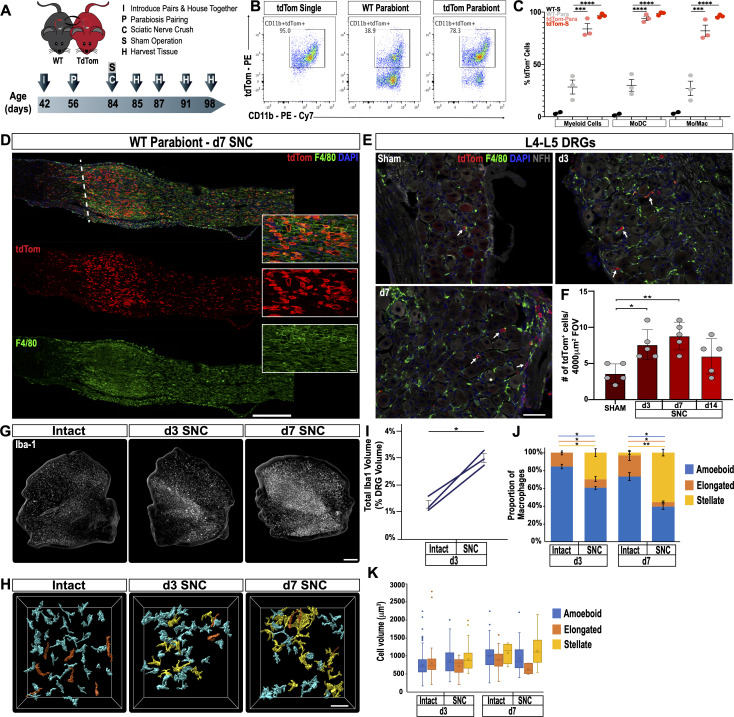
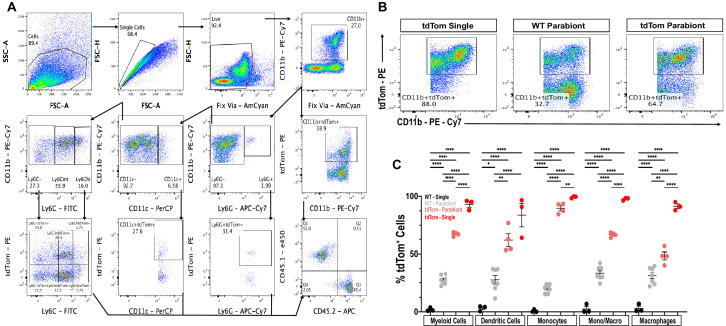
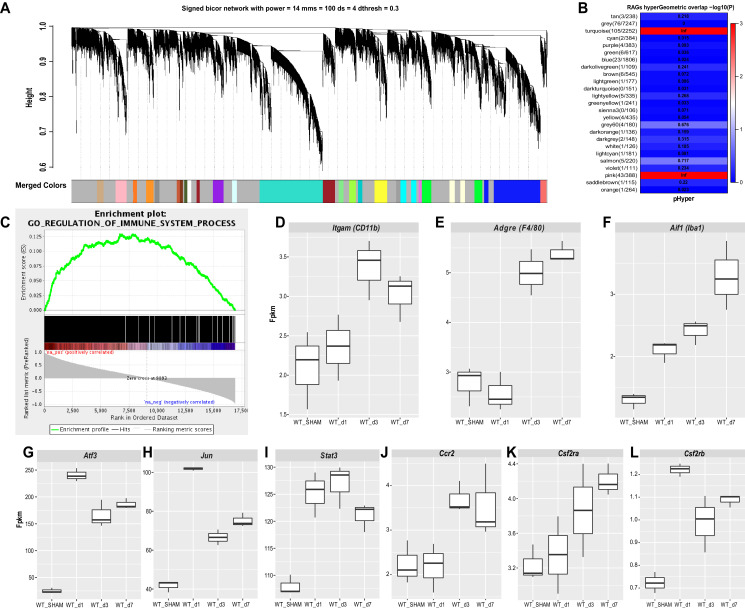
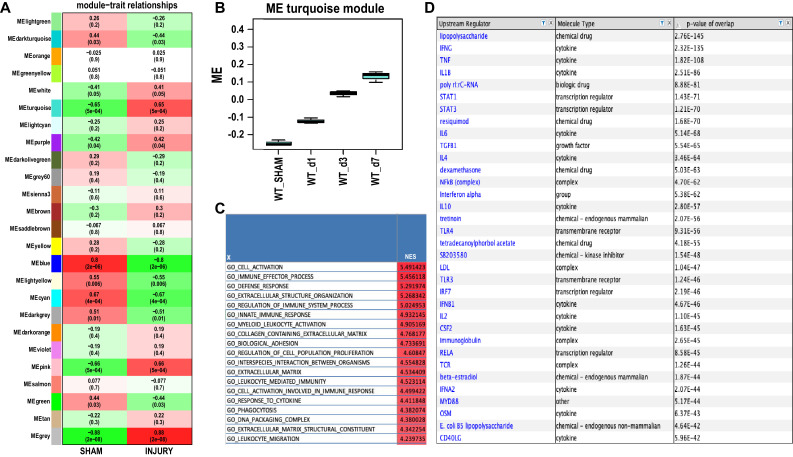
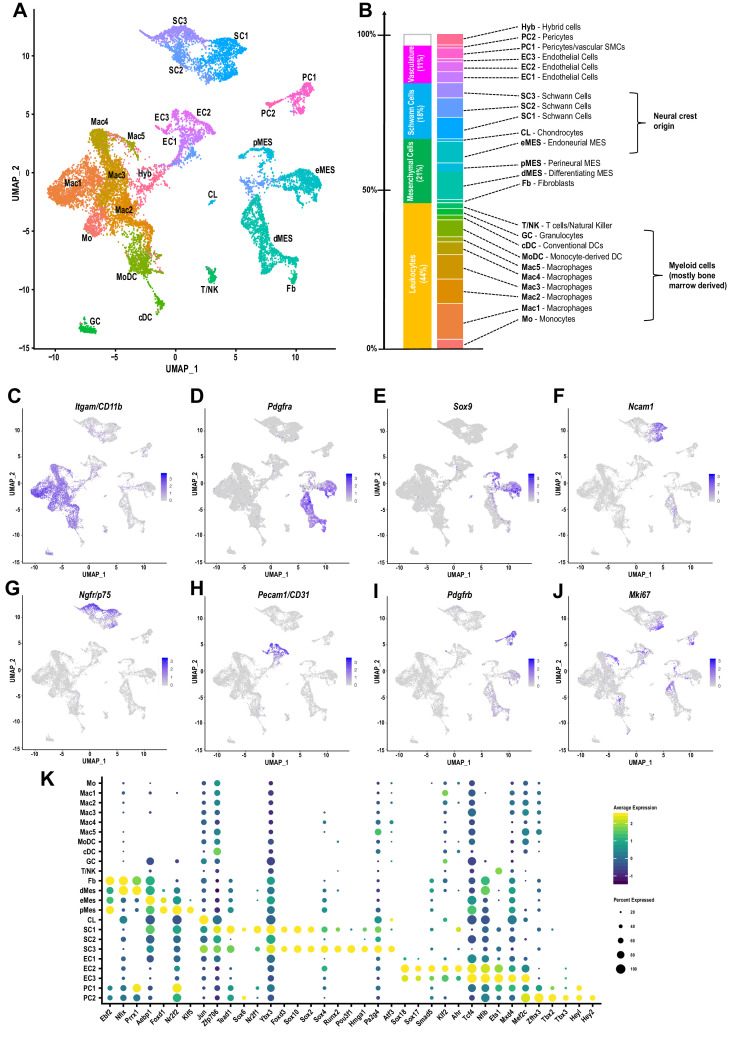
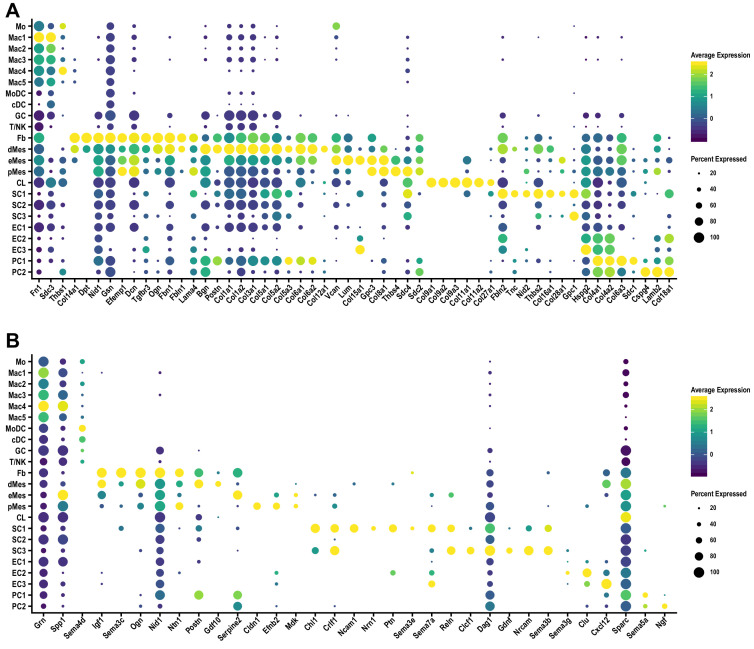
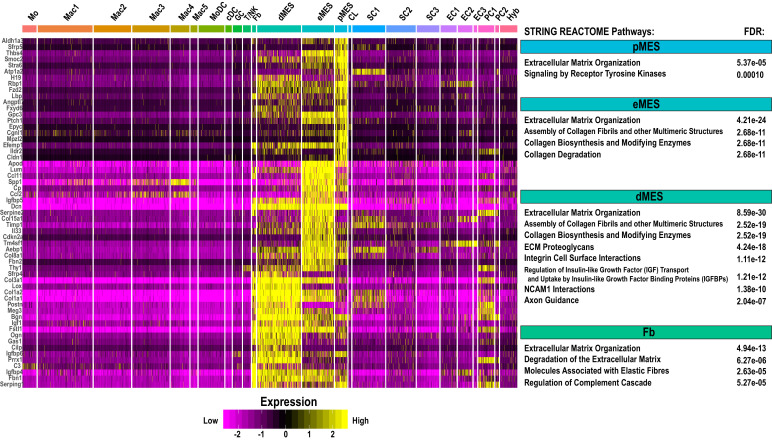
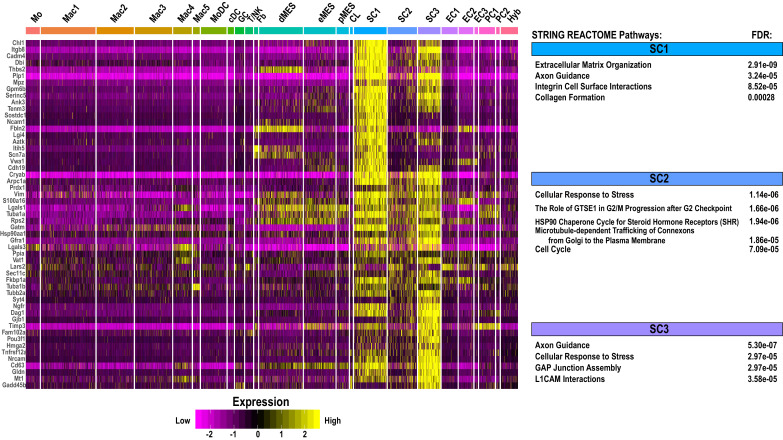
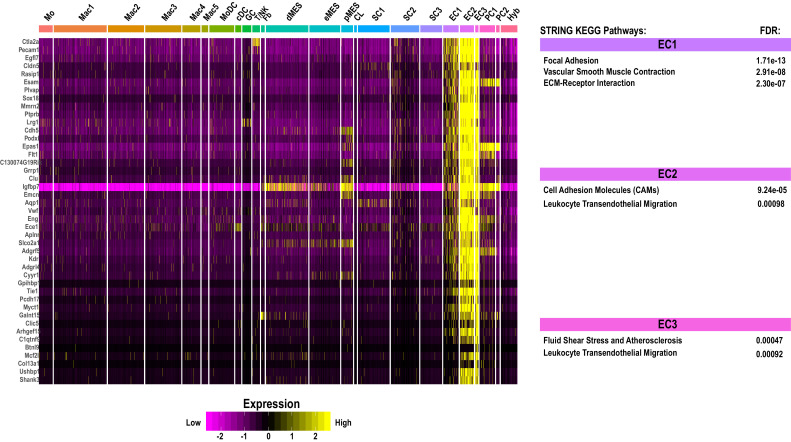
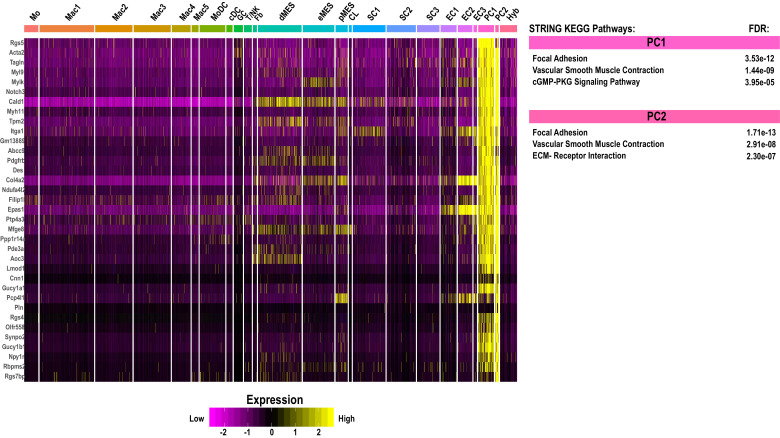
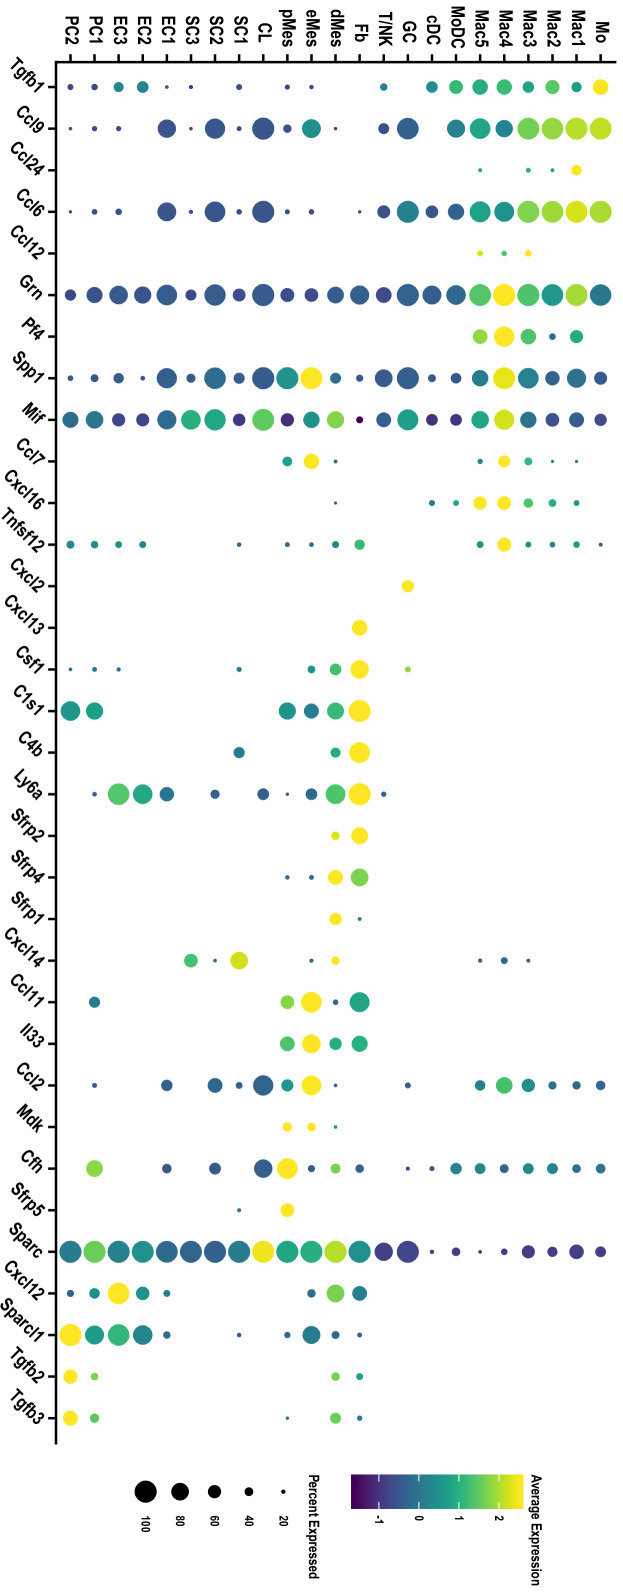
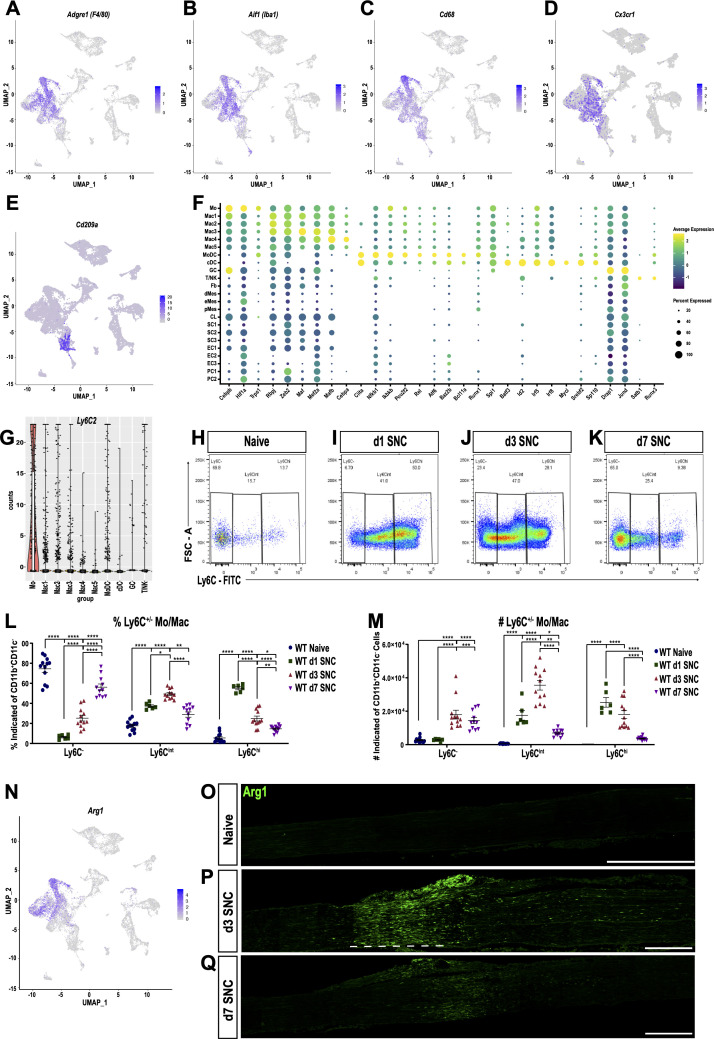
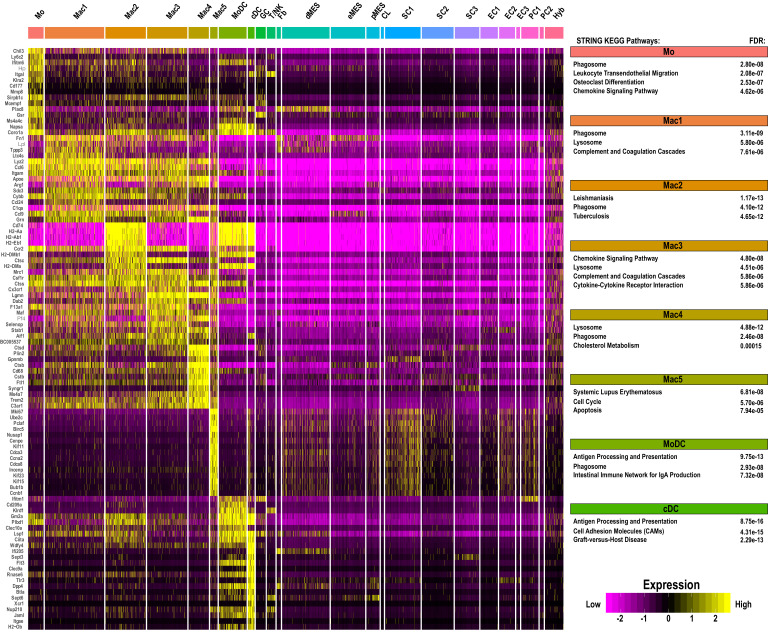
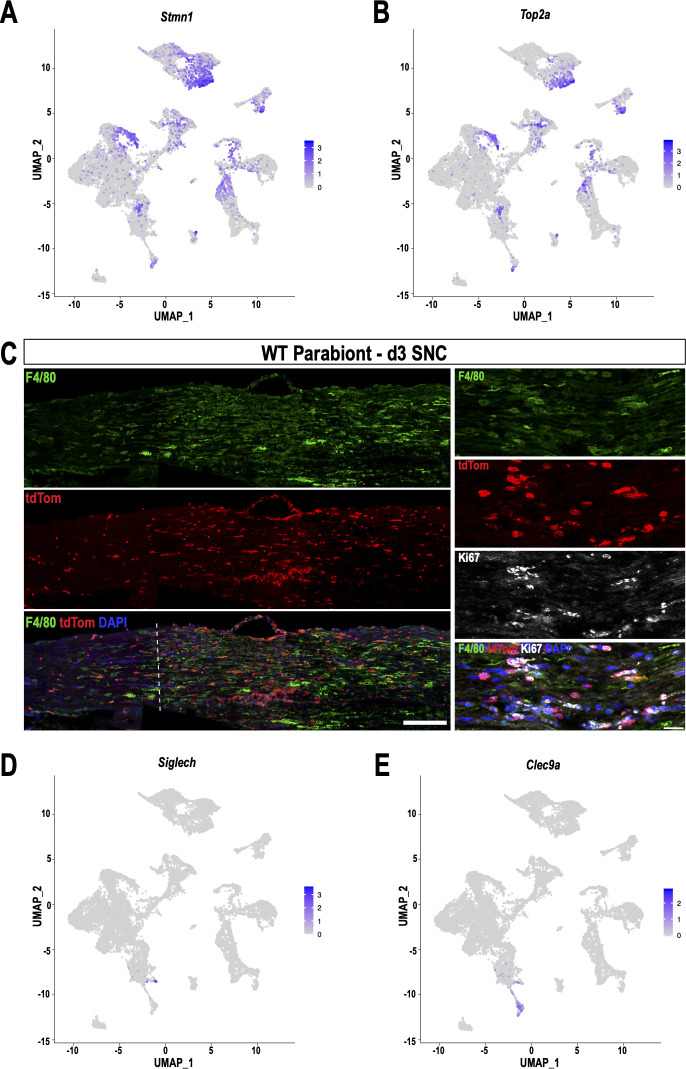
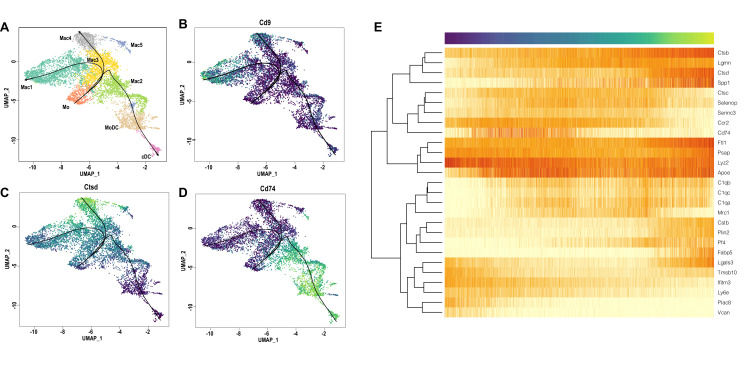
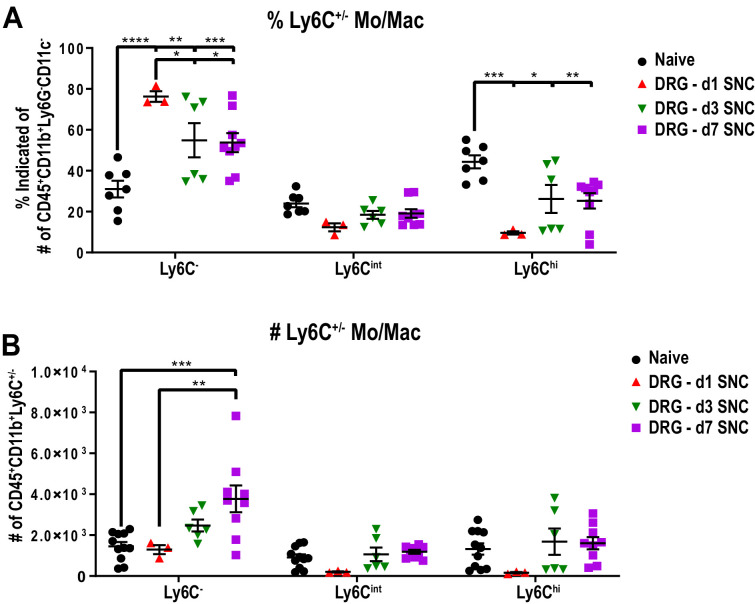
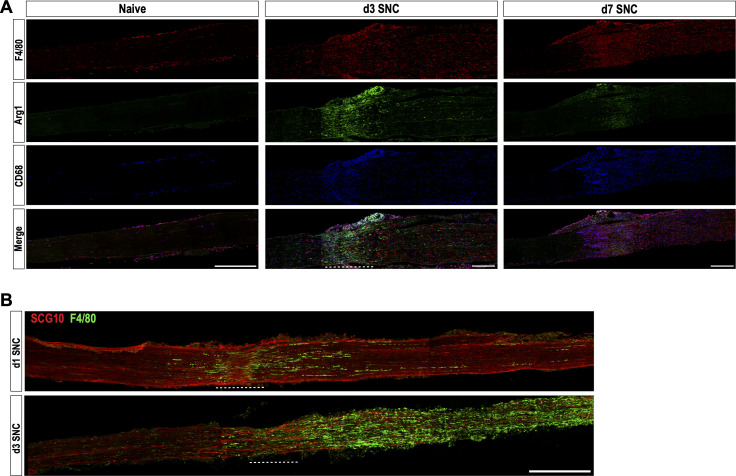
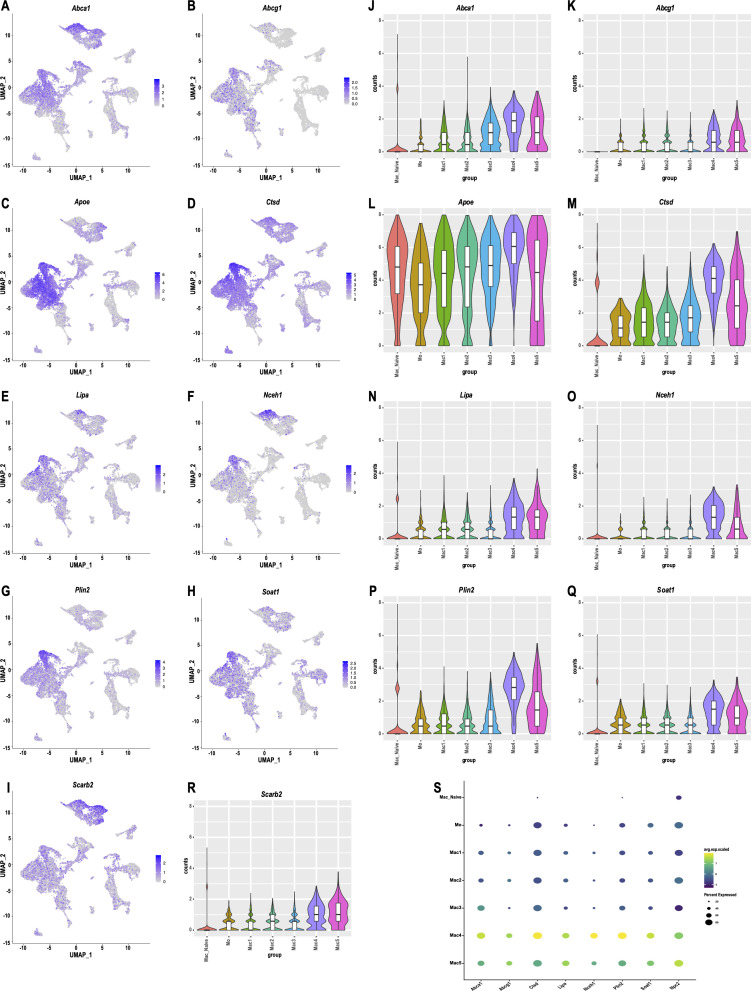
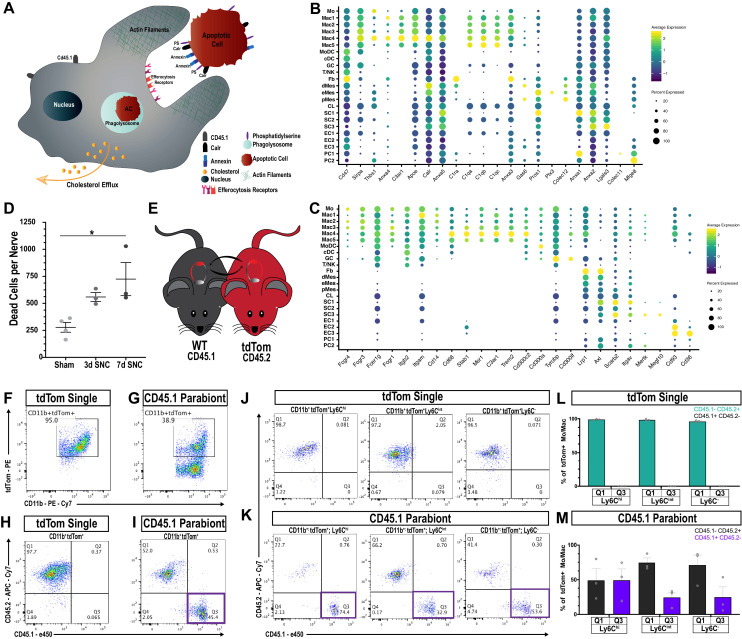
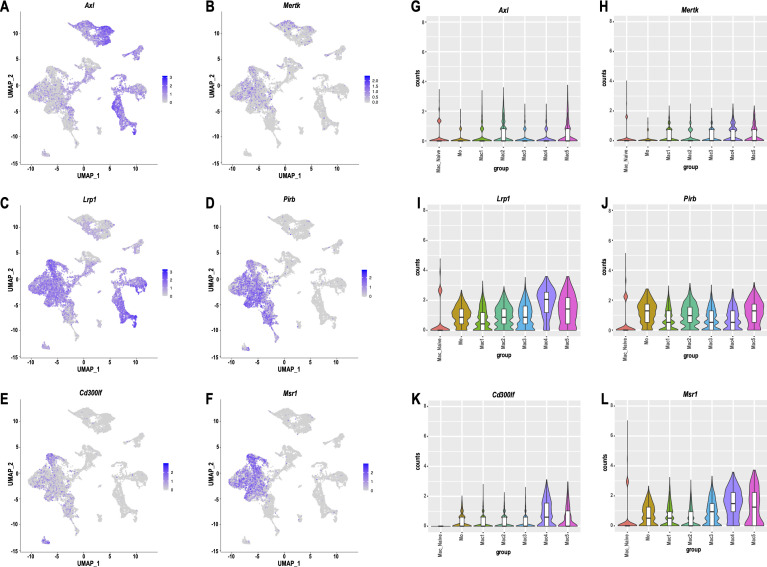
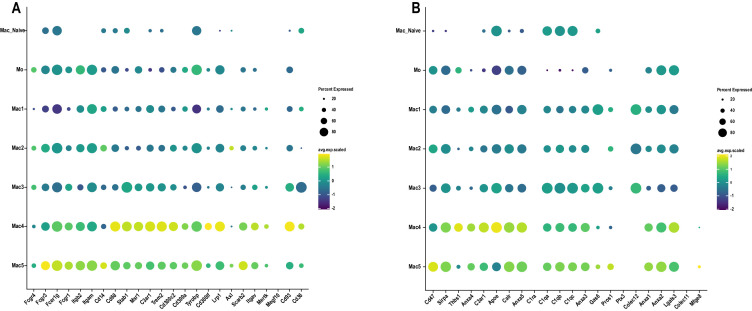
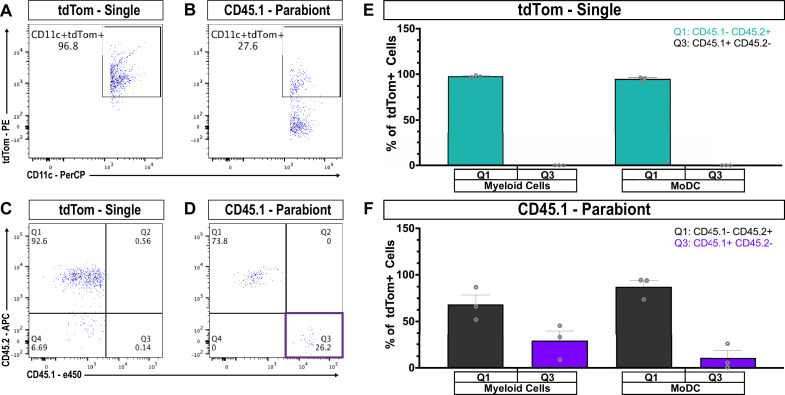
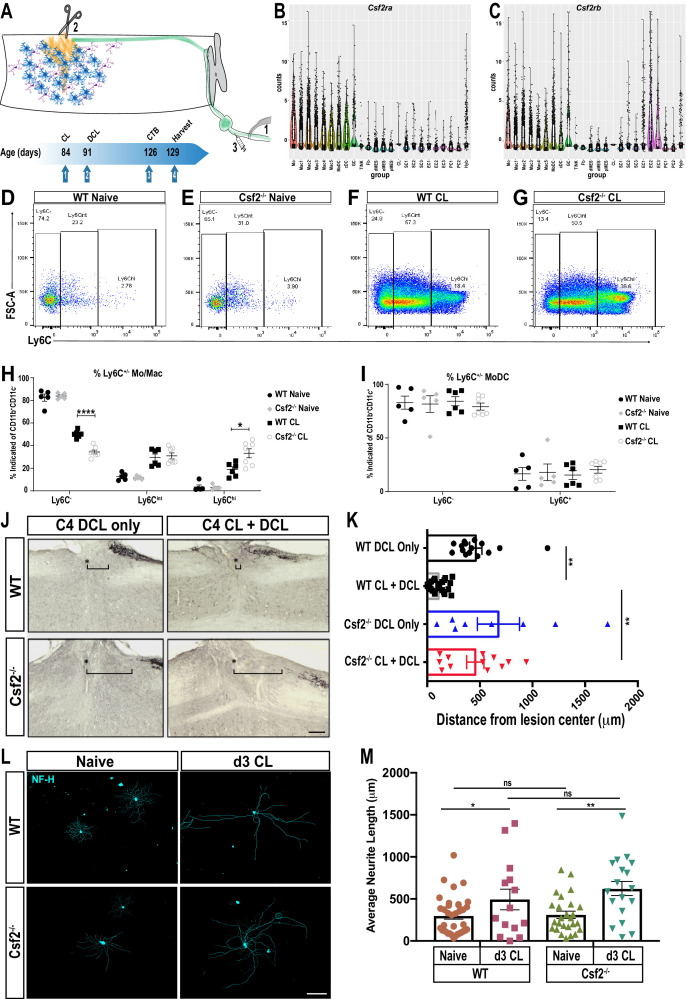
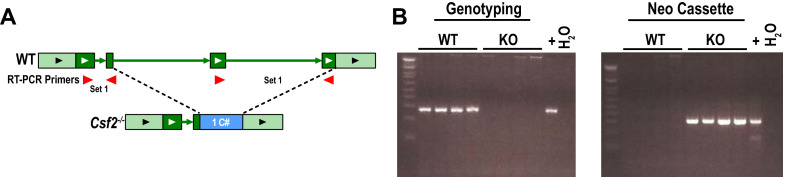
Sciatic nerve crush injury triggers sterile inflammation within the distal nerve and axotomized dorsal root ganglia (DRGs). Granulocytes and pro-inflammatory Ly6Chigh monocytes infiltrate the nerve first and rapidly give way to Ly6Cnegative inflammation-resolving macrophages. In axotomized DRGs, few hematogenous leukocytes are detected and resident macrophages acquire a ramified morphology. Single-cell RNA-sequencing of injured sciatic nerve identifies five macrophage subpopulations, repair Schwann cells, and mesenchymal precursor cells. Macrophages at the nerve crush site are molecularly distinct from macrophages associated with Wallerian degeneration. In the injured nerve, macrophages 'eat' apoptotic leukocytes, a process called efferocytosis, and thereby promote an anti-inflammatory milieu. Myeloid cells in the injured nerve, but not axotomized DRGs, strongly express receptors for the cytokine GM-CSF. In GM-CSF-deficient (Csf2-/-) mice, inflammation resolution is delayed and conditioning-lesion-induced regeneration of DRG neuron central axons is abolished. Thus, carefully orchestrated inflammation resolution in the nerve is required for conditioning-lesion-induced neurorepair.

Keywords: axon regeneration; conditioning lesion; dorsal root ganglia; efferocytosis; mouse; neuroscience; scRNA sequencing; sciatic nerve injury.


Conflict of interest statement

AK, CY, LH, PD, RK, RP, HH, CJ, RK, KC, JJ, EH, DG, BS, RG No competing interests declared

Figures

Figure 1.
Figure 1.. Immune cell profiles in the injured murine sciatic nerve.
(A) Anatomy of lumbar spinal cord and DRGs connected to the sciatic nerve. The location of the crush site within the nerve trunk and the tissue segment collected for flow cytometry (red bracket) are shown. (B) Quantification of live, CD45+ leukocytes, normalized per sciatic nerve trunk. Flow cytometry of nerve tissue collected from naive mice (n = 10 biological replicates, with six nerves per replicate), day 1 (d1) post-SNC (n = 7), d3 (n = 12), and d7 (n = 12). (C). Quantification of granulocytes (CD45+, CD11b+, Ly6G+) per nerve trunk. (D). Quantification of Mo/Mac (CD45+, CD11b+, CD11c-, Ly6G-) per nerve trunk. (E). Quantification of MoDC (CD45+, CD11b+, CD11c+, Ly6G-) per nerve trunk. (F) Quantification of cDC (CD45+, CD11b-, CD11c+, Ly6G-) per nerve trunk. (G). Quantification of lymphocytes (CD45+, CD11b-) per nerve trunk. (H). Composition of CD45+ leukocytes in the nerve trunk at different post-injury time points. Flow data are represented as mean cell number ± SEM. Statistical analysis was performed in GraphPad Prism (v7) using one-way or two-way ANOVA with correction for multiple comparisons with Tukey’s post-hoc test. For B-G, unpaired two-tailed t-test with Welch’s correction. A p value < 0.05 (*) was considered significant. p<0.01 (**), p<0.001 (***), and p<0.0001 (****).
Figure 1—figure supplement 1.
Figure 1—figure supplement 1.. Gating scheme for flow cytometry.
Cells were first gated with forward scatter (FSC-A) and side scatter (SSC-A) to exclude debris. Cells were then gated with forward scatter height (FSC-H) and FSC-A to find single cells and to exclude doublets. Live cells were isolated by negative staining for fixed viability dye (Fix Via). In nerves, DRGs, spinal cord, and spleen, leukocytes were analyzed as follows: lymphocytes were isolated as CD45+, CD11b- cell and then further separated based on CD11c positivity as cDC or as CD45+, CD11b-, CD11c- lymphocytes. Myeloid cells (CD45+, CD11b+) were further separated into Ly6G+ granulocytes. The remaining cells (CD45+, CD11b+, Ly6G-) were characterized as MoDC (CD45+, CD11b+, CD11c+, Ly6G-), Mo/Mac (CD45+, CD11b+, CD11c-, Ly6G-), and Microglia (CD45int, CD11bint, CX3CR1+).
Figure 1—figure supplement 2.
Figure 1—figure supplement 2.. Immune cell profiles in the sciatic nerve proximal to the injury site.
(A) Anatomy of lumbar spinal cord and DRGs connected to the sciatic nerve. The location of the crush site within the nerve trunk and the tissue segment collected for flow cytometry (red bracket) are shown. (B) Quantification of live, CD45+ cell in the proximal nerve, per ~5 mm segment. Flow cytometry of nerve tissue collected from naive mice (n = 3), d3 (n = 3), and d7 (n = 3) following SNC. (C) Quantification of granulocytes (CD45+, CD11b+, Ly6G+) per nerve segment. (D) Quantification of Mo/Mac (CD45+, CD11b+, CD11c-, Ly6G-) per nerve segment. (E) Quantification of MoDC (CD45+, CD11b+, CD11c+, Ly6G-) per nerve segment (F) Quantification of cDC (CD45+, CD11b-, CD11c+, Ly6G-) per nerve segment. (G) Quantification of lymphocytes (CD45+, CD11b-) per nerve segment. (H) Composition of CD45+ leukocytes in the proximal nerve stump at different post-SNC time points. (I–K) Percentile of each cell type at different post-injury time points. For flow cytometry, data are represented as mean cell number ± SEM. Statistical analysis was performed in GraphPad Prism (v7) using one-way or two-way ANOVA with correction for multiple comparisons with Tukey’s post-hoc test. For B-G, unpaired two-tailed t-test with Welch’s correction. A p value < 0.05 (*) was considered significant. p<0.01 (**), p<0.001 (***), and p<0.0001 (****). (L). Longitudinal sections of sciatic nerve trunk at d3 following SNC, stained with anti-F4/80 (red) to label macrophages and anti-GFAP (green) to label repair Schwann cells. The proximal (Prox) and distal (Dist) sides of the nerve, relative to the crush site (dashed line), are indicated. Consistent with flow cytometry, nerve inflammation is not significantly elevated proximal to the nerve crush site. Scale bar, 1000 µm.
Figure 2.
Figure 2.. Immune cell profiles in axotomized DRGs.
(A) Representative images of L4 DRG cross sections from naïve mice, d1, d3, and d7 post-SNC. Macrophages were stained with anti-Iba1 and anti-F4/80. Neurons were stained with anti-NFH. Scale bar, 50 µm. (B) Quantification of granulocytes per DRG detected by flow cytometry. For flow cytometry of DRGs, naïve mice (n = 14 biological replicates), d1 (n = 3), d3 (n = 5), and d7 (n = 12) post-SNC mice were used. Granulocytes (CD45+, CD11b+, Ly6G+) per DRG are shown. (C) Quantification of Mo/Mac (CD45+, CD11b+, CD11c-, Ly6G-) per DRG. (D) Quantification of MoDC (CD45+, CD11b+, CD11c+, Ly6G-) per DRG. (E) Quantification of cDC (CD45+, CD11b-, CD11c+, Ly6G-) per DRG. (F) Quantification of lymphocytes (CD45+, CD11b-) per DRG. (G) Composition of CD45+ leukocytes in lumbar DRGs identified by flow cytometry. Flow data are represented as mean cell number ± SEM. Each data point represents L3-L5 DRGs pooled from three to four animals (18–24 DRGs), biological replicates, n = 3–14. Statistical analysis was performed in GraphPad Prism (v7) using one-way or two-way ANOVA with correction for multiple comparisons with Tukey’s post-hoc test. For B-F, unpaired two-tailed t-test with Welch’s correction. A p value < 0.05 (*) was considered significant. p<0.01 (**), p<0.001 (***), and p<0.0001 (****). (H) Western blots analysis of DRGs and sciatic nerves (SNs) prepared from sham operated mice and mice at different post-SNC time points (d1–d21), probed with anti-CD11b and anti-ERK1/2 as loading control. (I) Quantification of CD11b signal in DRGs and SNs. Unpaired two-tailed Student’s t-test compared to sham operated. n.s. not significant, *p<0.05, biological replicates n = 4 (with four mice for each time point).
Figure 2—figure supplement 1.
Figure 2—figure supplement 1.. T cells in naive and axotomized DRGs.
Representative images of L4 DRG cross sections from naïve mice, d1, d3, and d7 post-SNC. T cells were labeled with anti-CD3 (red), neurons with anti-NF200 (white). DAPI (blue) was used for nuclear staining (blue). Scale bar, 50 µm.
Figure 3.
Figure 3.. Sciatic nerve injury triggers massive accumulation of hematogenous leukocytes in the injured nerve but not axotomized DRGs.
(A) Parbiosis complex of a wildtype (WT) and a tdTomato (tdTom) mouse. Mice were surgically paired at postnatal day 56. The timeline of the experiment is shown. (B) Flow cytometric analysis of sciatic nerve trunks collected from non-parabiotic (single) tdTom mice, WT parabionts, and tdTom parabionts. Dotplot of live (CD11b+, tdTom+) cells in the d3 post-SNC nerve. (C) Quantification of tdTom+ myeloid cells in the 3d injured nerve of WT single mice (WT-S), WT parabiont (WT-para), tdTom parabiont (tdTom-para), and tdTom single (tdTom-S) mice. The fraction of tdTom+ myeloid cells (CD45+, CD11b+), MoDC (CD45+, CD11b+, CD11c+, Ly6G-), and Mo/Mac (CD45+, CD11b+, CD11c-, Ly6G-) is shown. For quantification of tdTom+ immune cells, nerves from the WT parabiont and the tdTom parabiont were harvested separately (three mice per data point) with n = 2–3 biological replicates. Flow data are represented as fraction of tdTomcells ± SEM. Statistical analysis was performed in GraphPad Prism (v8) using one-way ANOVA with correction for multiple comparisons with Tukey’s post-hoc test. p value of < 0.001 (***) and p<0.0001 (****). (D) Longitudinal sciatic nerves sections of the WT parabiont at d7 post-SNC. The nerve crush site is marked with a white dotted line, proximal is to the left, distal to the right. Anti-F4/80 (green) and tdTom+ cells (red) staining is shown. Scale bar, 500 µm, for insets, 20 µm. (E) Lumbar DRG cross sections of WT parabionts harvested from sham operated mice, at d3, and d7 post-SNC. Sections were stained with anti-F4/80 (green) and anti-NF200 (white). Hematogenous (tdTom+) leukocytes are marked with white arrows. Scale bar, 50 µm. (F) Quantification of tdTom+ cells per field of view (FOV = 4000 µm2) in DRG sections of the WT parabiont. Data are shown as number of tdTomcells ± SEM, n = 3–5 mice per time point. Student’s t test with p<0.5 (*) considered statistically significant, p<0.01 (**). (G) Whole mount anti-Iba1 immunofluorescence staining of L4 DRGs from intact, d3, and d7 post-SNC time points. Scale bar, 200 µm. (H) Morphological reconstruction of Iba1+ cells in DRGs with Imaris. Analysis of DRG resident macrophages revealed amoeboid (cyan) and elongated (orange) morphologies if the nerve was not injured. At d3 and d7 post-SNC, a subpopulation of Iba1+ cells with stellate (yellow) morphology was observed in DRGs. Scale bar, 50 µm. (I) Quantification of total volume of Iba1+ structures in DRGs, rendered by Imaris. The total volume of Iba1+ structures per DRG was quantified on the intact side and the injured side of the same mouse at d3 post-SNC (n = 3 mice). Paired Students t test, p value < 0.05 (*), was considered significant. (J) Quantification of Iba1+ cells with amoeboid, elongated, and stellate morphologies. (K) Quantification of cell volume of individual Iba1+ cells with amoeboid, elongated, and stellate morphologies. At d3 post-SNC, a total of 416 cells were reconstructed on the intact side and a total of 234 cells on the injured side. At d7 post-SNC, a total of 136 cells were reconstructed on the intact side and a total of 93 cells on the injured side. The distribution of morphological categories ± SEM (J) and cell volumes ± SEM (K) are shown. Paired, two-tailed Student’s t test, a p value < 0.05 (*) was considered significant. p<0.01 (**).
Figure 3—figure supplement 1.
Figure 3—figure supplement 1.. Flow cytometry gating scheme to assess chimerism of parabiotic mice.
(A) Cells were first gated with forward scatter (FSC-A) and side scatter (SSC-A) to exclude debris. Cells were then gated with forward scatter height (FSC-H) and FSC-A to find single cells and to exclude doublets. Live cells were isolated by negative staining for fixed viability dye (Fix Via). After live cell gating, myeloid cells were isolated by CD11b positivity and assessed for the percentage of tdTom+ cells. Following gating for granulocytes (CD11b+, Ly6G+), MoDC (CD11b+, CD11c+, Ly6G-), and Mo/Mac (CD11b+, Ly6G-, CD11c-) were identified. Mo/Mac were further subdivided into Ly6Chi, Ly6Cint and Ly6C- cells. The fraction of tdTom+ cells for each cell type was determined. (B) Representative flow cytometry dot plots of splenic myeloid cells (CD11b+, tdTom+) in WT (CD45.1) parabiont and non-parabiotic (tdTom single) and parabiotic mice. (C) Quantification of chimerism in the spleen. The percentile of tdTom+ myeloid cells, MoDC, Mo/Mac that are (Ly6Chi), (Ly6Cint), and Mac (Ly6C-) is shown (n = 3–7 biological replicates). Flow data are represented as mean ± SEM. Statistical analysis was performed in GraphPad Prism (v8) using one-way ANOVA with correction for multiple comparisons with Tukey’s post-hoc test. A p value < 0.05 (*) was considered significant. p<0.01 (**), and p<0.0001 (****).
Figure 4.
Figure 4.. Stable upregulation of immune function associated gene co-expression networks in axotomized DRGs.
Analysis of bulk RNAseq data from naïve and axotomized DRGs. DRGs were harvested from sham operated mice, d1, d3, and d7 post-SNC. (A) Network analysis of whole transcriptomes from naive and axotomized DRGs. Gene dendrogram identifies several co-expression modules. (B) Gene ontology (GO) analysis revealed significant and stable upregulation of the pink and turquoise modules. (C) Gene set enrichment analysis. Shown is the enrichment plot for GO terms of the turquoise module with overrepresentation of immune system processes. (D–F) Quantification of SNC-induced upregulation of commonly used macrophage markers Itgam (CD11b), Adgre1 (F4/80), and Aif1 (Iba1) in axotomized DRGs. (G–I) Quantification of SNC-induced upregulation of the RAGs Atf3, Jun, and Stat3 in DRGs. (J–L) Quantification of SNC-induced upregulation of the chemokine receptor Ccr2, and the GM-CSF receptor subunits Csf2ra and Csf2rb in DRGs. Gene expression levels are shown as Fpkm (fragments per kilobase of transcript per million mapped reads).
Figure 4—figure supplement 1.
Figure 4—figure supplement 1.. Module – trait relationships in axotomized DRGs and analysis of the turquoise module.
(A) Heatmap of the correlation of WGCNA modules with indicated experimental conditions (sham operated mice and following nerve injury). The values in each cell are Pearson's correlation co-efficient and Student asymptotic p-values (parenthesis). The green to red color represents strong negative to positive-correlation of experimental condition and Module Eigen (ME) gene expression. (B) Induction of turquoise gene co-expression module in axotomized DRGs of wild-type (WT) mice following SNC at d1, d3, and d7 (ME gene expression). (C) GO terms enriched in the turquoise module. Normalized enrichment scores (NES) are shown. (D) Ingenuity pathway analysis (IPA) predicted upstream regulators of injury-induced immune pathways in axotomized DRGs. GSEA’s core enrichment genes in immune pathways obtained from differentially expressed genes comparing d1 to sham DRGs; FDR < 0.1 were used as input for IPA.
Figure 5.
Figure 5.. The cellular landscape of injured peripheral nerve.
(A) Singe-cell transcriptome of injured mouse sciatic nerve at d3 post-SNC, n = 3 biological replicates. Unsupervised Seurat-based clustering identifies 24 cell clusters. Cell type identity for each cluster was determined by expression analysis of established markers. (B) List of all cell types identified by scRNA-sequencing. The size (percentile) of cell clusters and lineage relationships are shown. Abbreviations for cell cluster identities are indicated and used throughout the manuscript. (C–J) Feature plots of established cell markers used for identification of major cell types in the injured nerve. Shown are UMAP plots with markers for myeloid cells (Itgam/CD11b), fibroblast-like/mesenchymal cells (Pdgfra, Sox9), repair Schwann cells (Ncam1, Ngfr/p75), endothelial cells (Pecam/CD31), pericytes/smooth muscle vascular cells (Pdgfrb), and mitotically active cells (Mki67/Ki67). Expression levels are color coded and calibrated to average gene expression. (K) Dotplot shows cell-type-specific expression of the most abundant transcription regulators (TRs) in Fb, dMES, eMES, pMES, CL, SC1-3, EC1-3, PC1, and PC2 clusters identified by scRNA-seq of 3d injured sciatic nerve. Dotplot analysis shows the average gene expression (color coded) and percent of cells (dot size) that express the listed TRs in each cluster.
Figure 5—figure supplement 1.
Figure 5—figure supplement 1.. Cell-cluster-specific expression of ECM components and molecules that regulate axon growth in the injured sciatic nerve.
(A) Dotplot analysis of extracellular matrix molecules prominently expressed in the d3 post-SNC nerve. (B) Dotplot analysis of gene products implicated in axon growth, guidance, and regeneration in the d3 post-SNC nerve. Expression levels, normalized to average gene expression (color coded) are shown. For each cell, cluster the percentile of cells expressing a specific gene is indicated by the dot size.
Figure 5—figure supplement 2.
Figure 5—figure supplement 2.. Single-cell gene expression in mesenchymal cell clusters in injured sciatic nerve.
Heatmap of top genes enriched in perineural mesenchymal cells (pMES), endoneurial mesenchymal cells (eMES), differentiating mesenchymal cells (dMES), and epineural fibroblasts (Fb) in the d3 post-SNC nerve. Expression levels are calibrated to median gene expression. STRING REACTOME Pathways are listed. FDRs (false discovery rates) are shown.
Figure 5—figure supplement 3.
Figure 5—figure supplement 3.. Single-cell gene expression in Schwann cell clusters in injured sciatic nerve.
Heatmap of top genes enriched in repair Schwann cell clusters (SC1, SC2, and SC3) in the d3 post-SNC nerve. Expression levels are calibrated to median gene expression. STRING REACTOME pathways are listed. FDRs (false discovery rates) are shown.
Figure 5—figure supplement 4.
Figure 5—figure supplement 4.. Single-cell gene expression in endothelial cell clusters in injured sciatic nerve.
Heatmap of top genes enriched in endothelial cell clusters (EC1, EC2, and EC3) in the d3 post-SNC nerve. Expression levels are calibrated to median gene expression. STRING KEGG Pathway analysis and FDRs (false discovery rates) are shown.
Figure 5—figure supplement 5.
Figure 5—figure supplement 5.. Single-cell gene expression in pericyte cell clusters in injured sciatic nerve.
Heatmap of top genes enriched in pericyte clusters (PC1 and PC2) in the d3 post-SNC nerve. Expression levels are calibrated to median gene expression. STRING REACTOME Pathways are listed. FDRs (false discovery rates) are shown.
Figure 5—figure supplement 6.
Figure 5—figure supplement 6.. Single-cell gene expression of immune modulatory molecules in the injured PNS tissue.
Dotplot analysis of gene products with immune modulatory function in the d3 post-SNC nerve. Expression levels, normalized to average gene expression (color coded). For each cell cluster, the percentile of cells that express the listed gene (dot size) is shown.
Figure 6.
Figure 6.. Macrophage subpopulation in the injured nerve are functionally distinct and localize to specific sites.
(A–E) Feature plots of Adgre1 (F4/80), Aif1 (Iba1), Cd68 (Scavenger receptor class D), Cx3cr1 (Fractalkine receptor), and CD209a (DC-SIGN) expression in the d3 post-SNC nerve. (F) scRNAseq dot plot analysis of transcription regulators (TRs) enriched in leukocytes. Average gene expression and percentage of cells expressing the TR are shown. (G) Violin plot of Ly6c2 (Ly6C) expression in immune cells of the d3 post-SNC nerve. (H–K) Flow cytometric analysis of sciatic nerve Mo/Mac (CD45+, CD11b+, Ly6G-, CD11c-) in naive mice, d1, d3, and d7 post-SNC mice. Mo/Mac maturation was assessed by Ly6C surface staining. (L, M) Quantification of Ly6C distribution on Mo/Mac in naïve nerves and at different post-SNC time points (n = 11 biological replicates per time point); (L) Percentile of Ly6C-, Ly6Cint, and Ly6Chi Mo/Mac and (M) number of Ly6C-, Ly6Cint, and Ly6Chi Mo/Mac. Flow data are represented as mean ± SEM. Statistical analysis was performed in GraphPad Prism (v7) using one-way or two-way ANOVA with correction for multiple comparisons with Tukey’s post-hoc test. A p value < 0.05 (*) was considered significant. p<0.01 (**), p<0.001 (***), and p<0.0001 (****). (N) Feature plot showing Arg1 (Arginase-1) expression in the 3d post-SNC nerve. (O–Q) Longitudinal sciatic nerve sections of Arg1-YFP reporter mice, from naive mice (O), d3 (P), and d7 (Q) post-SNC mice. YFP+ cells (green) are localized to the injury site (underlined with a dashed line), proximal is to the left. Representative example of n = 4 biological replicates. Scale bar, 200 µm.
Figure 6—figure supplement 1.
Figure 6—figure supplement 1.. Single-cell gene expression in myeloid cell clusters of injured sciatic nerve.
Heatmap of top genes enriched in monocytes (Mo), macrophage clusters 1–5 (Mac1-5), MoDC, and cDC in the d3 post-SNC nerve. Expression levels are calibrated to median gene expression. STRING KEGG Pathway analysis and FDRs (false discovery rates) are shown.
Figure 6—figure supplement 2.
Figure 6—figure supplement 2.. Identification of blood-borne, stem-like myeloid cells in the injured sciatic nerve.
(A) Feature plots of Stmn1 (Stathmin-1) and (B) Top2a (DNA topoisomerase II alpha) highlight proliferating cells, including Mac5 cells and a small group of myeloid cells located between clusters Mac2 and MoDC. (C) Longitudinal sciatic nerve section of 3d WT parabiont, the dotted line marks the injury site, proximal is to the left. TdTom+ cells are blood-borne immune cells originating from the tdTom parabiont. Macrophages are stained with anti-F4/80 (green), scale bar, 100 µm. Higher magnification images of the injury site. Some tdTom+F4/80+ macrophages are stained with anti-Ki67 (white). Scale bar, 50 µm. (D) Feature plots of Siglech, a marker for pDC and (E) Clec9a, a marker for cDC, in the 3d injured nerve.
Figure 6—figure supplement 3.
Figure 6—figure supplement 3.. Monocyte-to-macrophage differentiation based on single-cell expression modeling.
Pseudo time trajectory analysis of cell differentiation in the d3 post-SNC nerve (A–D) Predicted cell differentiation in the myeloid cell compartment. Slingshot analysis was used to predict how Mo (monocytes) differentiate into specific Mac subpopulations and MoDC. Feature plots for Cd9 (Tetraspanin), Ctsd, and Cd74 are shown as representative examples. (E) Pseudo time gene expression changes of top genes used for trajectory analysis.
Figure 6—figure supplement 4.
Figure 6—figure supplement 4.. Mo/Mac maturation in axotomized DRGs, assessed by Ly6C surface expression.
Flow cytometric analysis of Mo/Mac in naive and axotomized DRGs. The surface distribution of Ly6C on Mo/Mac (CD45+, CD11b+, Ly6G-, CD11c-) is shown. (A) The percentile of Ly6C cells and (B) the number of Ly6C cells in naive DRGs, d1, d3, and d7 post-SNC. Mo/Mac were binned into Ly6Chi, Ly6Cint, and Ly6C- cells. Flow data are represented as mean ± SEM. Each data point represents L3-L5 DRGs pooled from three to four animals (18–24 DRGs), biological replicates, n = 3–9. Statistical analysis was performed in GraphPad Prism (v7) using one-way or two-way ANOVA with correction for multiple comparisons with Tukey’s post-hoc test. A p value < 0.05 (*) was considered significant. p<0.01 (**), p<0.001 (***), and p<0.0001 (****).
Figure 6—figure supplement 5.
Figure 6—figure supplement 5.. Evidence for distinct immune compartments in the injured sciatic nerve.
(A) Longitudinal sections of naïve and injured (3d and 7d) sciatic nerves from Arg1-YFP reporter mice. The injury site is underlined with a dotted line. Proximal is to the left. Distribution of F4/80+, Arg1-YFP+, and CD68+ macrophages is shown. Scale bar, 200 µm. (B) Longitudinal sciatic nerve sections of adult mice at d1 and d3 post-SNC. The crush site is marked with a dotted line, proximal is to the left. Nerves were stained with anti-SCG10 to visualize regenerating sensory axons and anti-F4/80 to stain for a subpopulation of macrophages. At d1, F4/80+ macrophages are found near the crush site. At d3, F4/80+ macrophages are abundantly present throughout the distal nerve stump, adjacent to SCG10+ regenerating sensory axons. Scale bar, 500 µm.
Figure 6—figure supplement 6.
Figure 6—figure supplement 6.. Expression of gene products that regulate cholesterol transport and metabolism in macrophages of injured and naive nerve.
Feature plots of gene products implicated in cholesterol transport and lowering of cellular cholesterol levels. (A) Abca1/CERP (ATP-binding cassette subfamily A1). (B) Abcg1 (ATP-binding cassette subfamily G1). (C) Apoe (Apolipoprotein E). (D) Ctsd (Cathepsin D). (E) Lipa (Lipase A). (F) Nceh1 (Neutral cholesterol ester hydrolase 1). (G) Plin2 (Perilipin 2). (H) Soat1 (Sterol O-acyltransferase 1), (I) Scarb2 (Scavenger receptor class B 2). Calibration of gene expression for feature each plot is shown. (J–R) Violin plots for cholesterol regulatory gene products in naïve Mac, Mo, and Mac1-5 subpopulations. (S) Dot plot showing expression of cholesterol transporters and metabolic enzymes in naive nerve Mac in comparison to Mo and Mac1-5 in injured nerve. Expression levels are normalized to average gene expression (color coded). For each cell cluster, the percentile of cells that express the listed gene (dot size) is shown.
Figure 7.
Figure 7.. Macrophages ‘eat’ dying leukocytes in the injured nerve.
(A) Cartoon of phagocyte with actin rich phagocytic cup eating a tdTom+apoptotic cell (AC). ‘Eat me’ signals displayed on the surface of AC allow direct or indirect recognition via engulfment receptors. Following engulfment by phagocytes, AC are digested in the phagolysosome. Cellular cholesterol levels are controlled by upregulation of specific efflux mechanisms. (B) scRNAseq dotplot analysis of ‘don’t eat me’ molecules (Cd47, Sirpa) and bridging molecules prominently expressed across cell types in the d3 post-SNC nerve. Average gene expression and percentage of cells expressing the gene are shown. (C) scRNAseq dotplot analysis of engulfment receptors in the d3 post-SNC nerve. Average gene expression and percentage of cells expressing the gene are shown. (D) Flow cytometric analysis of dead cells accumulating in the d3 and d7 nerve (n = 3 biological replicas per time point). Data are represented as mean ± SEM. (E) Parabiosis complex of WT (CD45.1) mouse with a (CD45.2) tdTom reporter mouse. (F) Flow cytometry dot plot showing tdTom+ myeloid cells (CD45.2+, CD11b+) in the sciatic nerve of non-parabiotic (tdTom single) mice. (G) Flow cytometry dot plot showing tdTom+ myeloid cells (CD11b+) in the sciatic nerve of the WT CD45.1 parabiont. (H) Flow cytometry dot plot of CD11b+, tdTom+-gated cells from non-parabiotic (tdTom+ single) mice, analyzed for CD45.1 and CD45.2 surface staining. (I). Flow cytometry dot plot of CD11b+, tdTom+-gated cells from the CD45.1 parabiont, analyzed for CD45.1 and CD45.2 surface staining. Quadrant 3 (Q3) identifies CD45.1+, tdTom+, CD45.2- myeloid cells, indicative of ongoing efferocytosis. (J) Flow cytometry dot plots of Mo/Mac in the injured nerve of non-parabiotic (tdTom single) mice. Mo/Mac maturation was assessed by Ly6C surface staining. Shown are monocytes (Ly6Chi), Mo/Mac (Ly6Cint), and Mac (Ly6C-). (K) Flow cytometry dot plots of Mo/Mac in the injured nerve of the CD45.1 parabiont. Shown are monocytes (Ly6Chi), Mo/Mac (Ly6Cint), and Mac (Ly6C-). The quadrant with CD45.1+, tdTom+, CD45.2- cells (Q3) is highlighted. Biological replicates n = 3, with three parabiotic pairs per replica. (L, M) Quantification of CD45.1+, tdTom+, CD45.2- cells in quadrant Q3 and CD45.2+, tdTom+, CD45.1- cells in Q1. (L) In the injured nerve of (tdTom single) mice, no CD45.1+ cells are detected. (M) In the injured nerve of the WT CD45.1 parabiont, CD45.1+, tdTom+, CD45.2- Mo (Ly6Chi), Mo/Mac (Ly6Cint), and Mac (Ly6C-) are found; n = 3 biological replicates, with three parabiosis pairs pooled per replicate.
Figure 7—figure supplement 1.
Figure 7—figure supplement 1.. Expression of gene products implicated in myelin binding and phagocytosis.
(A–F) Feature plots and (G–L) Violin plots of Axl (TAM receptor tyrosine kinase AXL), Mertk (TAM receptor tyrosine kinase MER), Lrp1 (Low-density lipoprotein receptor-related protein 1), Pirb (Paired Ig-like receptor B), Cd300lf (CD300 molecule like family member F), and Msr1 (Macrophage scavenger receptor 1) expression in the d3 post-SNC nerve. Violin plots in G-L show relative expression in Mac from naive nerve and 3d injured Mo and Mac1-5 subpopulations.
Figure 7—figure supplement 2.
Figure 7—figure supplement 2.. Expression analysis of bridging molecules and engulfment receptors in macrophages of naive nerve and injured nerve.
(A) Dotplot showing expression of engulfment receptors in in naïve Mac in comparison to Mo and Mac1-5 in injured nerve. (B). Dotplot showing expression of ‘don’t eat me’ (Cd47 and Sirpa) signals, as well as bridging molecules, in in naive Mac in comparison to Mo and Mac1-5 in injured nerve. Expression levels are normalized to average gene expression (color coded). For each cell cluster, the percentile of cells that express the listed gene (dot size) is shown.
Figure 7—figure supplement 3.
Figure 7—figure supplement 3.. Contribution of MoDC to efferocytosis in the injured sciatic nerve.
(A) Flow cytometric analysis of 3d sciatic nerve from non-parabiotic (tdTom single) mice. Dot plot shows that 96.8% of MoDC (CD11b+, CD11c+, Ly6G-) are tdTom+(B) Flow cytometric analysis of 3d sciatic nerves from CD45.1 parabionts. Dot plot shows that 27.6% of MoDC are tdTom+(C) In the 3d sciatic nerves of non-parabiotic (tdTom single) mice, no tdTom+, CD45.1+ MoDC are present. (D) In the 3d sciatic nerve of the CD45.1 parabiont, CD45.1+ and CD45.2+ MoDC are found. (E) Quantification of CD45.1 and CD45.2 myeloid cells (CD11b+) and MoDC in the 3d sciatic nerve of non-parabiotic (single) tdTom mice. As expected, CD45.1+ cells are not detected. (F) Quantification of CD45.1 and CD45.2 myeloid cells (CD11b+) and MoDC in the 3d sciatic nerve of the CD45.1 parabiont. The presence of tdTom+, CD45.1+, CD45.2-, CD11b+, CD11c+, Ly6G- cells, indicates that MoDC participate in efferocytosis.
Figure 8.
Figure 8.. GM-CSF is required for conditioning lesion induced dorsal column axon regeneration.
(A) Schematic showing conditioning lesion to the sciatic nerve (1) followed by dorsal column lesion (2) and tracer injection in the nerve (3). Experimental time line of conditioning lesion (CL), dorsal column lesion (DCL), cholera-toxin B (CTB) injection, and time of tissue harvest are shown. (B, C) Violin plots of Csf2ra and Csf2rb expression in the d3 post-SNC sciatic nerve, as assessed by whole nerve tissue scRNAseq analysis. (D–G) Flow cytometry dot plots of WT and Csf2-/- nerves from naive mice and 3d following conditioning lesion (CL) to the sciatic nerve. Ly6C surface staining was used to assess maturation of the Mo/Mac population. Ly6Chi (immature), Ly6Cint, and Ly6C- (mature) cells are shown. (H) Quantification of percentage of Mo/Mac (CD45+ CD11b+ CD11c- Ly6G-) that are Ly6C-, Ly6Cint and Ly6Chi in WT and Csf2-/- mice without (naive) and with CL. (I) Quantification of surface Ly6C on MoDC (CD45+ CD11b+ CD11c+) in WT and Csf2-/- mice without (naïve) and with CL. Unpaired t-test with correction for multiple comparisons using Holm-Sidak method, *p<0.05; ****p<0.0001. (J) Sagittal sections through cervical spinal cords of wild-type (WT) and Csf2-/- mice, 5 weeks following bilateral DCL at cervical level 4 (C4). The spinal cord lesion site is labeled with a star (*), rostral is to the left and caudal is to the right. To enhance dorsal column axon regeneration, a CL to the sciatic nerve was performed 7 days prior to DCL (CL + DCL). Dorsal column axons were visualized by CTB injection in the sciatic nerve. The brackets indicated the distance between the lesion center and the rostral tip of CTB labeled axons. (K) Quantification of axon regeneration. The distance between CTB labeled axon tips and the center of the spinal lesion was measured; 0 µm marks the injury site, the gap between the lesion center and traced axons (=retraction) is shown for WT and Csf2-/- without CL. For each genotype and experimental condition n ≥ 8 biological replicates. One-way ANOVA with Tukey posthoc correction. **p<0.01. Scale bar, 200 µm. (L) Representative images primary DRG neurons isolated from WT and Csf2-/- mice, with and without a d3 CL. Cultures were stained with of anti-neurofilament H (NF-H) (M) Quantification of neurite length. Neuromath was used to quantify neurite length, neurites less than 30 µm in length were excluded from the analysis. n ≥ 114 neurons, n = 2 biological replicates. Two-tailed Student’s t-Test with Tukey posthoc correction was used. *p<0.05; **p<0.01. Scale bar, 500 µm.
Figure 8—figure supplement 1.
Figure 8—figure supplement 1.. Locus and PCR genotyping of Csf2-/- mice.
(A) Schematic of Csf2 gene locus of WT and germline Csf2-/- mice. Primer sets were designed both inside (set 2) and outside (set 2) of the deleted region. (B) Agarose gel shows PCR genotyping results from naïve brains of WT and Csf2-/- (KO) animals against primer set 2 (left) or against the neomycin cassette (right). In the absence of genomic DNA (water (H2O) control), no PCR product is observed.

Similar articles

Cited by

References

    1. Abe N, Cavalli V. Nerve injury signaling. Current Opinion in Neurobiology. 2008;18:276–283. doi: 10.1016/j.conb.2008.06.005. - DOI - PMC - PubMed
    1. Accolla RS, Ramia E, Tedeschi A, Forlani G. CIITA-Driven MHC class II expressing tumor cells as antigen presenting cell performers: toward the construction of an optimal Anti-tumor vaccine. Frontiers in Immunology. 2019;10:1806. doi: 10.3389/fimmu.2019.01806. - DOI - PMC - PubMed
    1. Altmann C, Vasic V, Hardt S, Heidler J, Häussler A, Wittig I, Schmidt MHH, Tegeder I. Progranulin promotes peripheral nerve regeneration and reinnervation: role of notch signaling. Molecular Neurodegeneration. 2016;11:69. doi: 10.1186/s13024-016-0132-1. - DOI - PMC - PubMed
    1. Arthur-Farraj PJ, Latouche M, Wilton DK, Quintes S, Chabrol E, Banerjee A, Woodhoo A, Jenkins B, Rahman M, Turmaine M, Wicher GK, Mitter R, Greensmith L, Behrens A, Raivich G, Mirsky R, Jessen KR. c-Jun reprograms schwann cells of injured nerves to generate a repair cell essential for regeneration. Neuron. 2012;75:633–647. doi: 10.1016/j.neuron.2012.06.021. - DOI - PMC - PubMed
    1. Atwal JK, Pinkston-Gosse J, Syken J, Stawicki S, Wu Y, Shatz C, Tessier-Lavigne M. PirB is a functional receptor for myelin inhibitors of axonal regeneration. Science. 2008;322:967–970. doi: 10.1126/science.1161151. - DOI - PubMed

Publication types

MeSH terms

Substances

Associated data