. 2020 Dec 2:9:e60299.
doi: 10.7554/eLife.60299.

Central processing of leg proprioception in Drosophila

Affiliations

Central processing of leg proprioception in Drosophila

Sweta Agrawal et al. Elife. .

Abstract

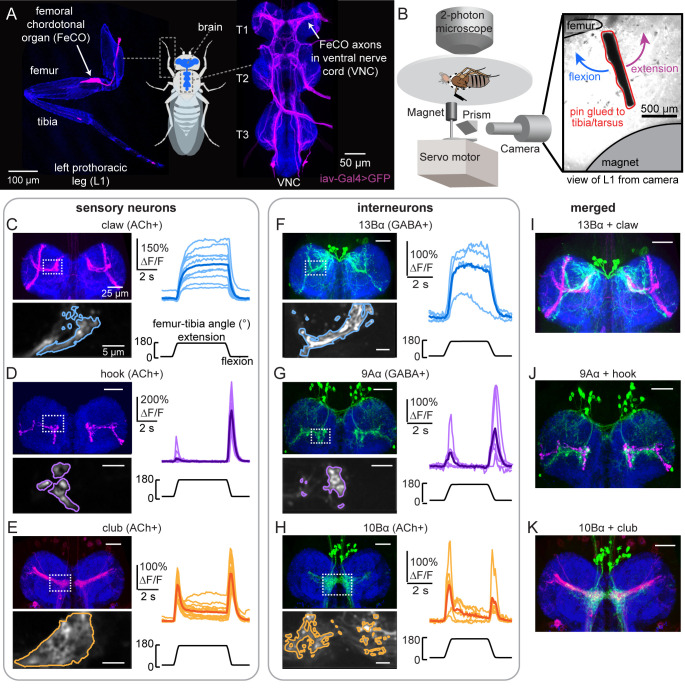
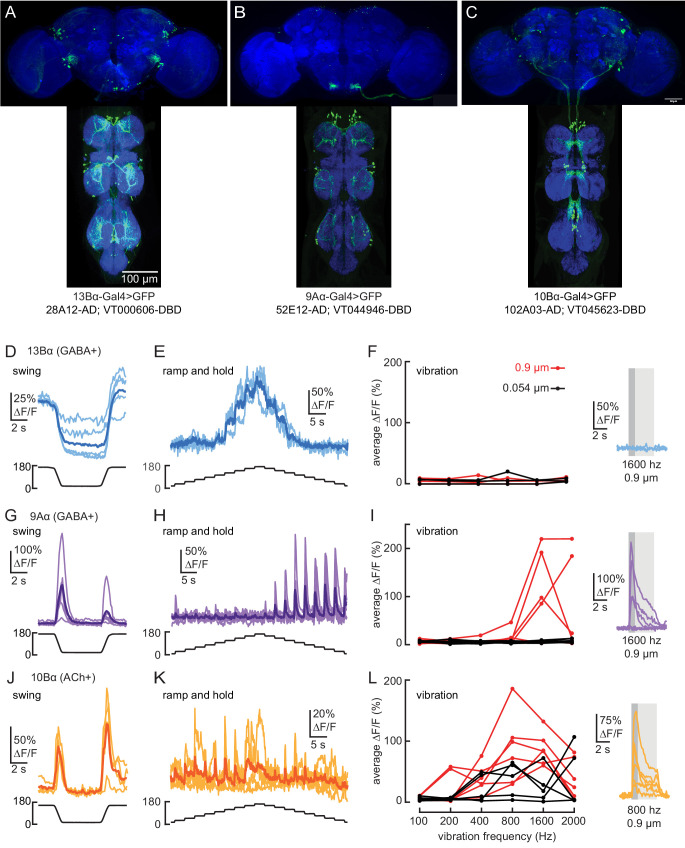
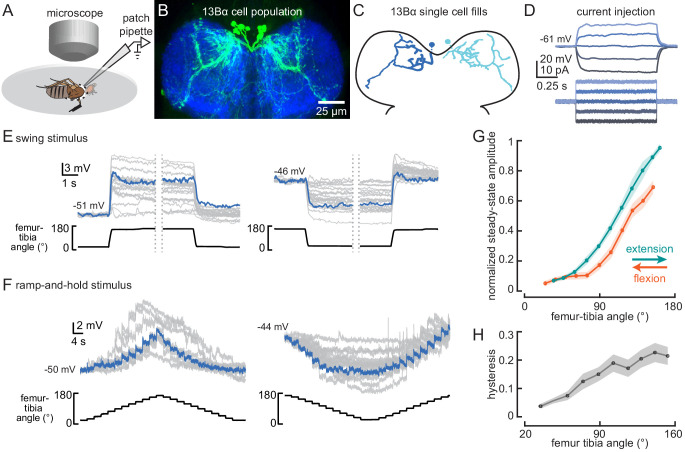
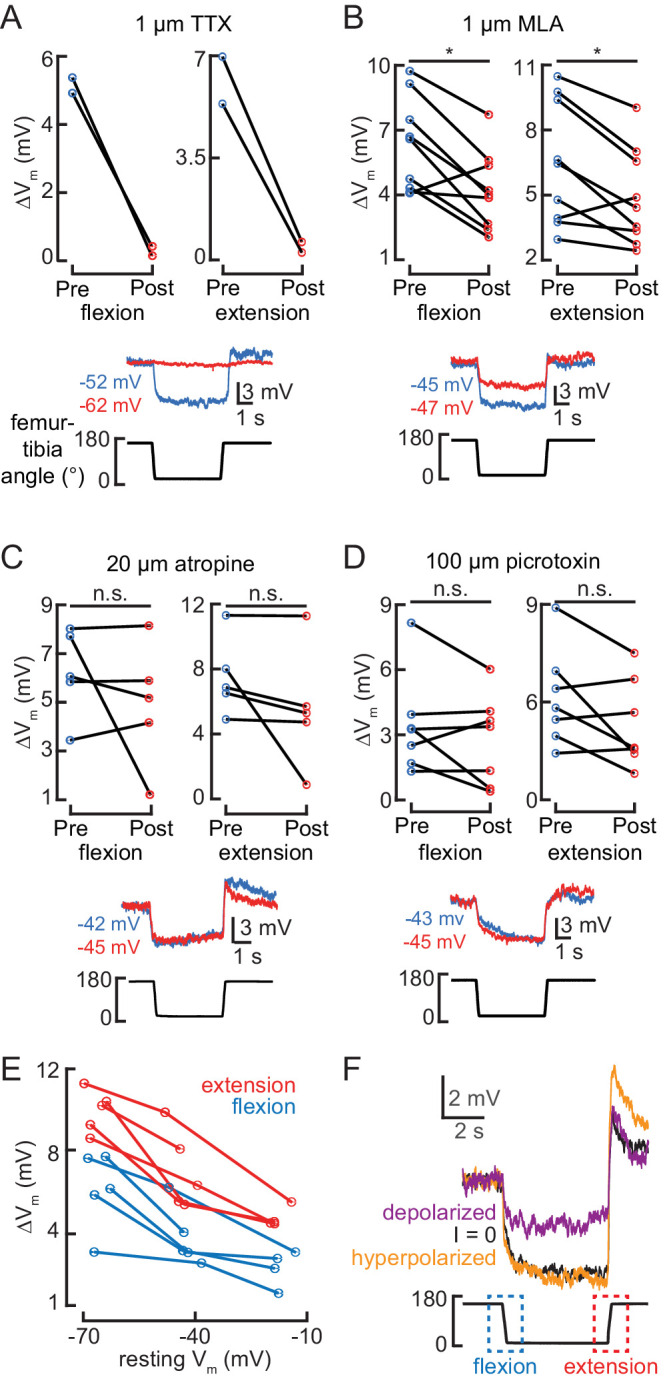
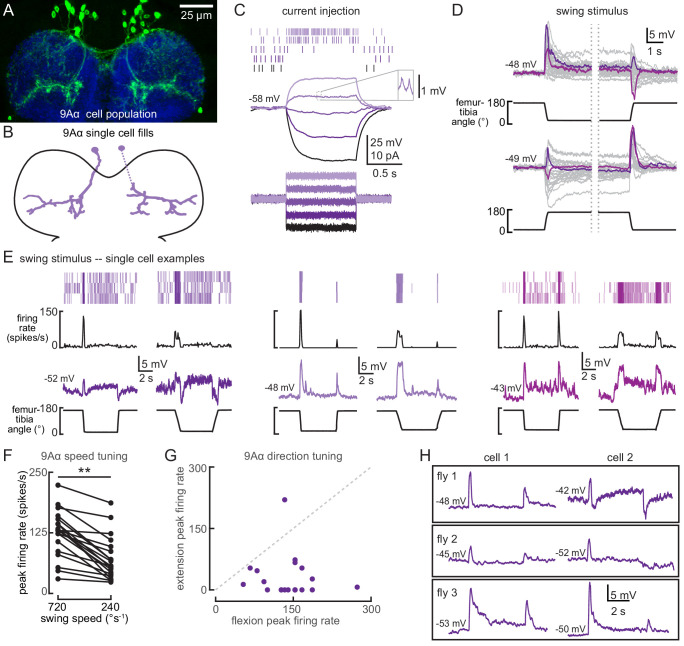
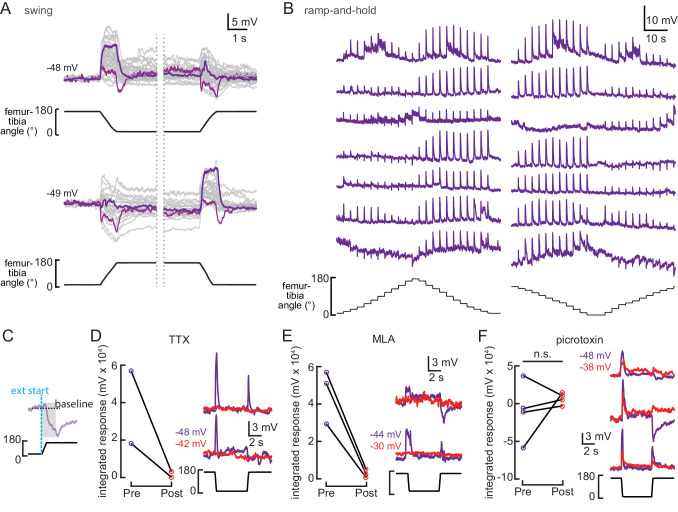
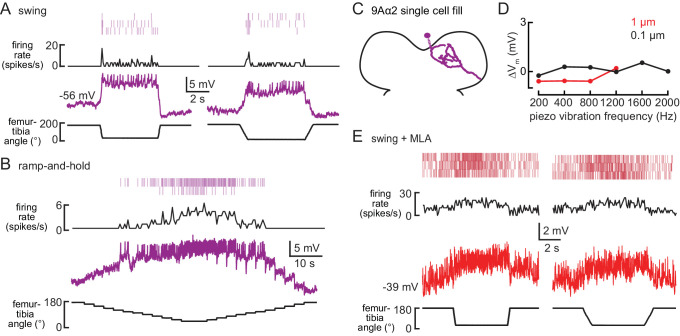
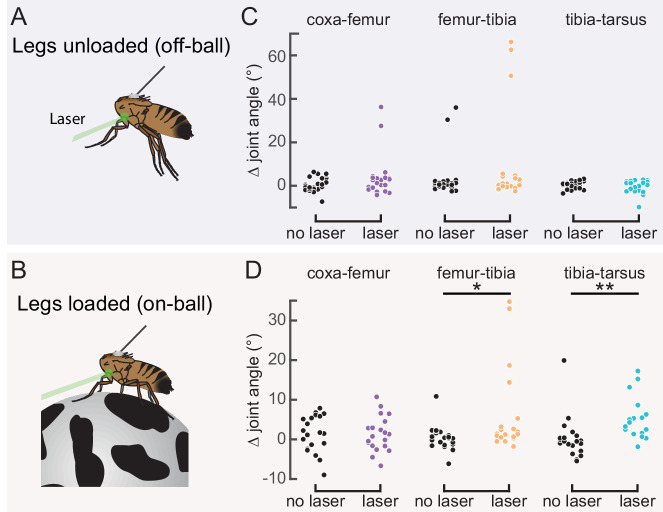
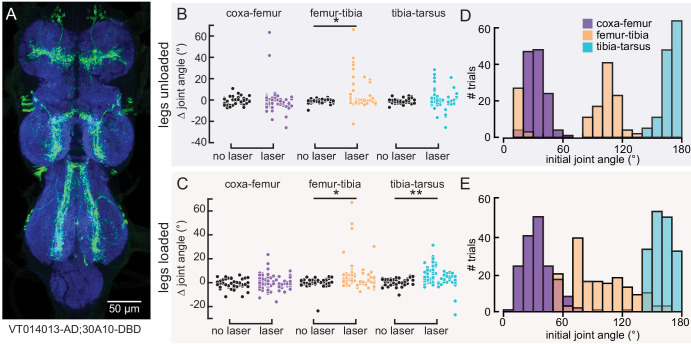
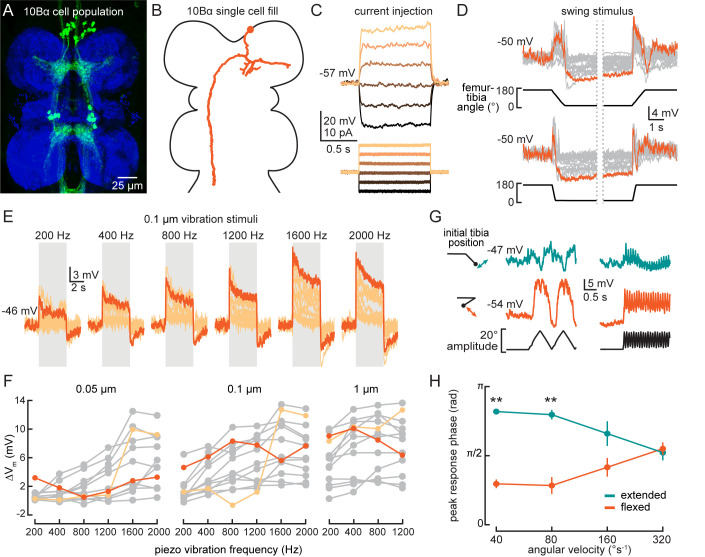
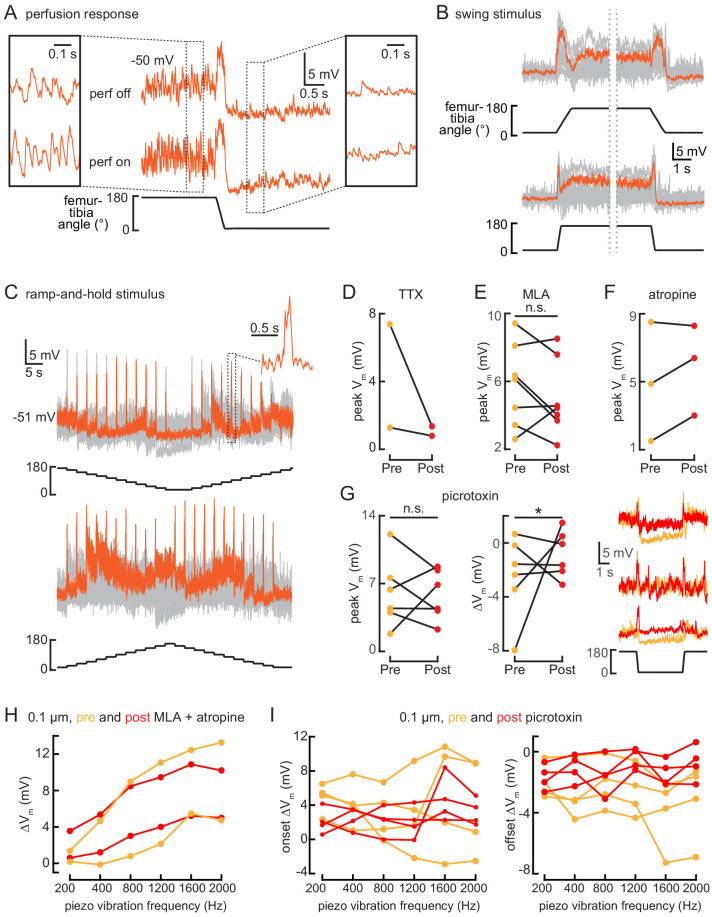
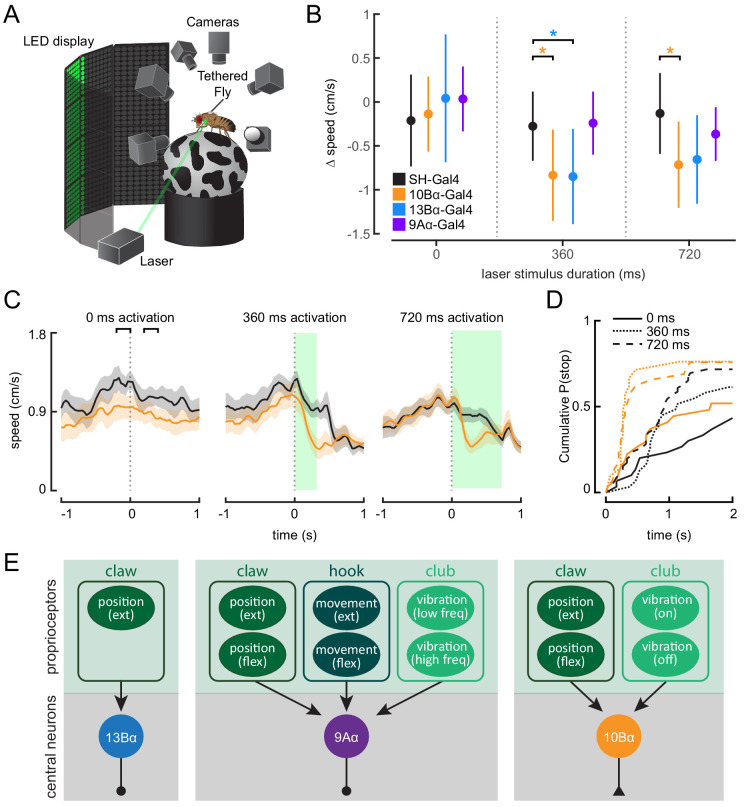
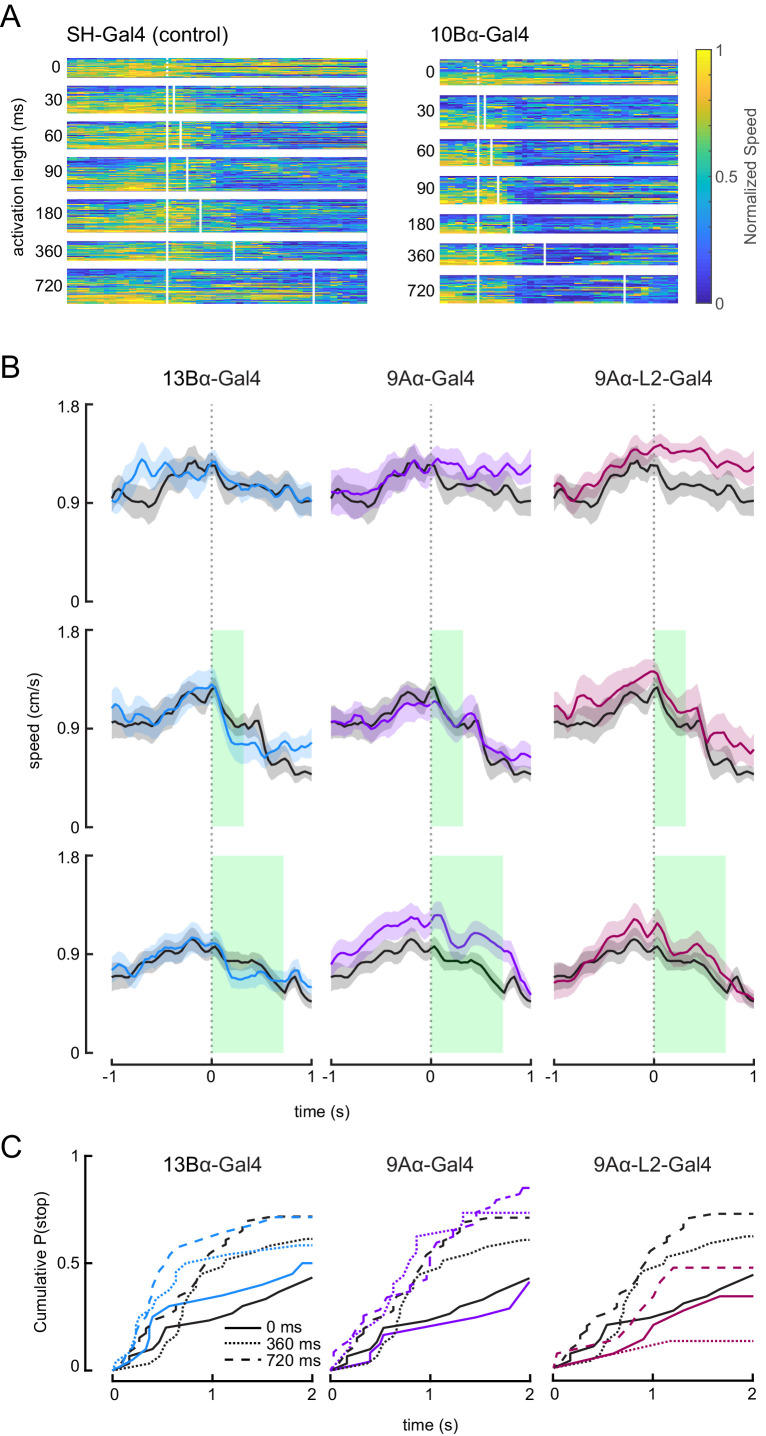
Proprioception, the sense of self-movement and position, is mediated by mechanosensory neurons that detect diverse features of body kinematics. Although proprioceptive feedback is crucial for accurate motor control, little is known about how downstream circuits transform limb sensory information to guide motor output. Here we investigate neural circuits in Drosophila that process proprioceptive information from the fly leg. We identify three cell types from distinct developmental lineages that are positioned to receive input from proprioceptor subtypes encoding tibia position, movement, and vibration. 13Bα neurons encode femur-tibia joint angle and mediate postural changes in tibia position. 9Aα neurons also drive changes in leg posture, but encode a combination of directional movement, high frequency vibration, and joint angle. Activating 10Bα neurons, which encode tibia vibration at specific joint angles, elicits pausing in walking flies. Altogether, our results reveal that central circuits integrate information across proprioceptor subtypes to construct complex sensorimotor representations that mediate diverse behaviors, including reflexive control of limb posture and detection of leg vibration.

Keywords: D. melanogaster; behavior; electrophysiology; motor control; neuroscience; proprioception; sensorimotor.


Conflict of interest statement

SA, ED, AS, PG, DS, JT, JT No competing interests declared

Figures

Figure 1.
Figure 1.. Transformation of leg proprioceptive signals from sensory to central neurons.
(A) Left: Confocal image of the prothoracic (front) leg showing the location of the femoral chordotonal organ (FeCO) cell bodies and dendrites (magenta). Blue: cuticle auto-fluorescence. Right: confocal image of FeCO neurons in the fly ventral nerve cord (VNC). Blue: neuropil stain (nc82); Magenta: FeCO axons. (B) Experimental setup for two-photon calcium imaging from VNC neurons while controlling and tracking the femur-tibia joint. A steel pin was glued to the tibia, painted black, and moved via a magnet mounted on a servo motor. The tibia was vibrated by a piezoelectric crystal fixed to the magnet. Right: an example frame from a video used to track joint angle. (C–H) Calcium signals from FeCO sensory neurons or central neurons in response to swing movements of the femur-tibia joint. Top left: anatomy (magenta or green) of each cell type in the prothoracic VNC (blue: nc82). The dashed white box indicates the recording region. Bottom left: GCaMP6f fluorescence within the recording region during an example trial. The pixels comprising each region of interest are outlined. Right: changes in GCaMP6f fluorescence (ΔF/F) during femur-tibia swing movements. The thicker line is the response average (n=10, 13, 14, 4, 6, 6). (I–K) Overlay of sensory axons (magenta) and central neurons (green). Data in C–E were reproduced with permission from Mamiya et al., 2018. All VNC images were aligned using the Computational Morphometry Toolkit (Jefferis et al., 2007).
Figure 1—figure supplement 1.
Figure 1—figure supplement 1.. Transformation of leg proprioceptive signals by 13Bα, 9Aα, and 10Bα cells in the fly VNC.
(A–C) VNC and brain expression of the split-Gal4 lines predominantly used to label each cell type. Blue: neuropil stain (nc82), Green: GFP. (D and E) Calcium signals from 13Bα neurons during tibia swing (D, n = 5) or ramp-and-hold (E, n = 3). The thicker line shows the response average. (F) Left: 13Bα activity during vibration stimuli. Each line represents an average response from one fly to three stimulus repetitions. Right: calcium signals from 13Bα cells during a 1600 Hz, 0.9 µm amplitude vibration. The light gray box indicates when the vibration was applied, and the dark gray box indicates the window of activity averaged for the left plot. (G and H) Calcium signals from 9Aα during tibia swing (G, n = 6) or ramp-and-hold (H, n = 7). (I) Left: 9Aα activity during vibration stimuli. Right: calcium signals from 9Aα cells during a 1600 Hz, 0.9 µm amplitude vibration. (J and K) Calcium signals from 10Bα neurons during tibia swing (J, n = 4) or ramp-and-hold (K, n = 5). (L) Left: 10Bα activity during vibration stimuli. Right: calcium signals during an 800 Hz, 0.9 µm amplitude vibration.
Figure 2.
Figure 2.. 13Bα neurons encode tibia position via tonic changes in membrane potential.
(A) The experimental setup from Figure 1B was modified for whole-cell electrophysiology. (B) Confocal image of 13Bα neurons (green) in the prothoracic ventral nerve cord. (C) Morphology of two 13Bα neurons reconstructed after filling with Neurobiotin. (D) Voltage responses to current injection from an example 13Bα recording. (E) Whole-cell current clamp recordings during the indicated swings of the femur-tibia joint. Each trace is the average response of a cell to three presentations of the same movement. An example trace is highlighted in blue (left: n = 19; right: n = 23). (F) Current clamp recordings during ramp-and-hold movements of the femur-tibia joint. (left: n = 10; right: n = 15) (G) Steady-state activity (average ± SEM) at different joint angles during flexion (orange) or extension (green) measured from ramp-and-hold trials (tibia began fully flexed). Steady-state responses were measured during the middle second of each 3 s step. Individual traces were normalized to the same maximum amplitude. (H) Hysteresis (difference between the response to flexion and extension (G), average ± SEM) of the steady-state response plotted in G.
Figure 2—figure supplement 1.
Figure 2—figure supplement 1.. Pharmacological manipulation of synaptic inputs to 13Bα neurons.
(A–D) Top: the change in membrane potential after the femur is flexed (left) or extended (right) before (blue) and after (red) drug application. Each line is the response of a single cell (*p<0.05; n.s.: not significant, Wilcoxon matched-pairs signed-rank test). Example membrane potential traces before (blue) and after (red) drug application are shown below. (E) Depolarizing the resting membrane potential of 13Bα neurons in whole-cell current-clamp decreases the cell’s change in membrane potential during joint movement, suggesting that its encoding is mediated by changes in excitatory input. The change in membrane potential after the femur was flexed (blue) or extended (blue) is plotted. Each point represents the average response of a cell to three stimulus presentations. (F) An example recording from a 13Bα cell when it was hyperpolarized (orange) or depolarized (orange) using current injection. The black trace shows the cell’s activity in the absence of current injection.
Figure 3.
Figure 3.. Optogenetic activation of 13Bα neurons causes flexion of the femur-tibia joint.
(A and B) Schematic (left) and example frame (right) illustrating optogenetic activation of 13Bα neurons in headless flies either suspended from a tether (legs unloaded, A) or positioned on a ball (legs loaded, B). A green laser (530 nm) is focused at the coxa-body joint of the fly’s left front leg (outlined in yellow) and all leg joints are monitored with high-speed video. Yellow arrows illustrate the left middle leg’s lateral movements. Top row of panels: legs unloaded; Bottom row: legs loaded. (C and D) Average change in joint angle (± SEM) of the coxa-femur (purple/black), femur-tibia (orange/dark gray), or tibia-tarsus (blue/light gray). Colored traces are from trials with a 720 ms laser stimulus (as indicated by the green bracket), and the black and gray traces are from trials with no laser stimulus. Asterisks mark those leg joints that demonstrated a significant change in joint angle when the laser was on compared to the no-laser trials (*p<0.05, bootstrapping with false discovery rate correction). Fly is either unloaded (C, n = 4 flies) or loaded (D, n = 7 flies). (E and F) Average change in the femur-tibia joint angle during laser stimulation grouped by initial joint angle. Only trials in which the fly flexed the tibia are included. Fly is either unloaded (E, n = 30 trials) or loaded (F, n = 19 trials). None of the groups was significantly different from one another (p<0.05, one-way ANOVA with Tukey–Kramer correction for comparisons across multiple populations). (G-H) Probability that we observed a femur-tibia flexion across all trials. Bars are color coded according to initial joint angle as in E and F. G: n = 43 trials, F: n = 74 trials.
Figure 3—figure supplement 1.
Figure 3—figure supplement 1.. Optogenetic activation of 13Bα neurons causes movement of the L1 and L2 legs.
(A and B) Distribution of observed behaviors after the laser turned on when flies were either unloaded (A, No laser: n = 11 trials; Laser: 44 trials) or loaded (B, No laser: n = 26 trials; Laser: n = 74 trials). L1: front left leg; L2: middle left leg. (C and D) The maximal observed femur-tibia flexion per trial as a function of the pre-laser initial joint angle when flies were either unloaded (C, n = 43 trials) or loaded (D, n = 74 trials). Points are color coded based on the behavioral classifier from A and B. (E and F) Distribution of initial joint angles for all trials when flies were either unloaded (E, n = 50 trials) or loaded (F, n = 100 trials).
Figure 4.
Figure 4.. 9Aα neurons are a functionally heterogenous population that encode tibia movement direction.
(A) Confocal image of 9Aα neurons (green) in the prothoracic ventral nerve cord (VNC). (B) Morphology of two 9Aα neurons reconstructed after filling with Neurobiotin. (C) Voltage responses to current injection from an example 9Aα recording. Detected spikes are indicated above the voltage traces. Inset shows example spikes, enlarged for clarity. (D) Whole-cell current clamp recordings during tibia swing. Each trace is the averaged response to three stimulus presentations. Two example traces are highlighted in purple and magenta (top: n = 35, bottom: n = 27). (E) Example whole-cell current clamp recordings from three cells during fast (720°s−1) and slow (240°s−1) swings. Each pair of traces is recorded from a single cell. (F) Peak firing rates (averaged across three stimulus presentations) for different flexion speeds (**p<0.005, Wilcoxon matched-pairs signed-rank test). (G) For each cell, the peak firing rate when the tibia was flexed relative to when the tibia was extended. Points along the dashed line would represent cells that are equally sensitive to both directions of movement. Points found below the dashed line are tuned for flexion. (H) Pairs of 9Aα cells in the same fly have distinct responses to the same 720°s−1 swing movement.
Figure 4—figure supplement 1.
Figure 4—figure supplement 1.. 9Aα cells are a heterogenous population of neurons that encode tibial flexion.
(A) Whole-cell current clamp recordings from 9Aα neurons during tibia swing movements. Each trace is the averaged response to three stimulus repetitions. Example traces are highlighted in purple and magenta (top: n = 35, bottom: n = 24). (B) Examples 9Aα responses during ramp-and-hold stimuli. Each row of traces is a recording from an individual cell. (C) Schematic of how we calculated the integrated change in membrane potential in panels D–F. For 0.5 s following the start of femur-tibia extension (gray shading), we integrated the membrane potential relative to a baseline (dashed black line) calculated by averaging the cell’s membrane potential during the 2 s preceding joint extension. (D–F) Left: 9Aα recordings during swing movements before (purple) and after (red) drug application. Graphs plot the integrated change in membrane potential (*p<0.05; n.s.: not significant, Wilcoxon matched-pairs signed-rank test). Right: example traces before (purple) and after (red) drug application.
Figure 5.
Figure 5.. 9Aα neurons encode high frequency tibia vibration.
(A and B) Example whole-cell current clamp recordings from two 9Aα cells during a 0.1 μm tibia vibration. The shaded region indicates the duration of the vibration stimulus. (C) The change in membrane potential during the first 500 ms of vibration across amplitudes and frequencies. Each point is the averaged response of a cell to three stimulus presentations (from left to right, n = 10, 15, 16). (D and E) The change in membrane potential during the first 500 ms after vibration onset before (purple) and after (red) application of an antagonist of nicotinic acetylcholine receptors, MLA (1 μM, D), or before (purple) and after (red) application of the GABA a and GluCl antagonist, picrotoxin (100 μM, E). The inset in E shows the resting membrane potential before (purple) and after (red) application of picrotoxin. Picrotoxin application depolarized the membrane potential in the majority of cells (n = 7).
Figure 5—figure supplement 1.
Figure 5—figure supplement 1.. 9Aα2 neurons encode flexed tibia positions.
(A–B) Whole-cell current clamp recordings from a 9Aα2 neuron during the indicated swing (A) or ramp-and-hold (B) movements of the femur-tibia joint. Average firing rate and spike rasters are shown above. (C) Morphology of a 9Aα2 neuron reconstructed after filling with Neurobiotin. (D) The change in membrane potential during the first 500 ms after vibration stimulus onset. (E) Activity recorded from a 9Aα2 during tibia swing after application of an antagonist of nicotinic acetylcholine receptors, MLA (1 µM). Average firing rate and spike rasters are shown above.
Figure 6.
Figure 6.. Optogenetic activation of 9Aα neurons causes extension of the tibia-tarsus.
(A and B) Schematic of optogenetic activation of 9Aα neurons (using 9Aα-Gal4) in headless flies either suspended from a tether (legs unloaded, A) or positioned on a spherical treadmill (legs loaded, B). A green laser (530 nm) is focused at the coxa-body joint of the fly’s left front leg. (C and D) Change in joint angle after 720 ms during trials in which the laser was on (purple, orange, and blue) or off (black). Each column is data from a single fly. Left: coxa-femur joint; Middle: femur-tibia joint; Right: tibia-tarsus joint. The fly was either unloaded (C, n = 6 flies) or loaded (D, n = 6 flies). *p<0.05, **p<0.005, bootstrapping with false discovery rate correction.
Figure 6—figure supplement 1.
Figure 6—figure supplement 1.. Optogenetic activation of 9Aα neurons using another split-Gal4 line causes a similar extension of the femur-tibia and tibia-tarsus.
(A) Ventral nerve cord (VNC) expression of 9Aα-L2-Gal4. Blue: neuropil stain (nc82), Green: GFP. (B and C) Change in joint angle after 720 ms during trials in which the laser was on (purple, orange, and blue data points) or off (black data points). Each column is data from a single fly. We expressed CsChrimson in 9Aα neurons using 9Aα-L2-Gal4. The fly was either unloaded (B, n = 10 flies) or loaded (C, n = 12 flies). *p<0.05, **p<0.005, bootstrapping with false discovery rate correction. (D and E) Distribution of initial joint angles of 9Aα-L2-Gal4 > CsChrimson flies before the start of the 720 ms stimulus period when flies were either unloaded (D, n = 128 trials) or loaded (E, n = 168 trials).
Figure 7.
Figure 7.. 10Bα neurons encode bidirectional tibia motion and tibia vibration in a position-dependent manner.
(A) Confocal image of 10Bα neurons (green) in the ventral nerve cord (VNC). (B) 10Bα morphology reconstructed after filling with Neurobiotin. (C) Voltage responses to current injection from an example recording. (D) Whole-cell current clamp recordings during tibia swing movements. Each trace is the average response to three stimulus repetitions. An example trace is highlighted in orange (top: n = 18, bottom: n = 18). (E) Responses to a 0.1 μm vibration stimulus (n = 12 cells). The gray box indicates when the vibration stimulus was applied. An example response is highlighted in dark orange. (F) The change in membrane potential during the first 500 ms after vibration onset. Each point is the averaged response to three stimulus repetitions. Two cells with different frequency tuning are highlighted in different shades of orange (left to right, n = 9, 13, 13). (G) Example 10Bα recording demonstrating how the responses of a single 10Bα neuron to the same movement stimulus depend on the tibia’s position. The tibia began either extended (green) or flexed (orange) and was then oscillated with an amplitude of 20° at four different angular velocities. Responses from the slowest (40°s−1) and fastest (320°s−1) oscillation are shown. The phase of the oscillation at which a 10Bα cell is maximally depolarized when the tibia began either flexed (orange) or extended (green) (n = 9, **p<0.005, Wilcoxon matched-pairs signed-rank test).
Figure 7—figure supplement 1.
Figure 7—figure supplement 1.. 10Bα cells encode bidirectional tibia movements and tibia vibration.
(A) Example whole-cell recording from a 10Bα neuron when the tibia was flexed. Saline perfusion was either absent (‘off’, top row) or present (‘on’, bottom row). Insets show an expanded view of the cell’s response when the tibia was extended (left) or flexed (right). When the tibia is extended, vibrations from the saline perfusion cause increased oscillations in the membrane potential. These oscillations disappear when the tibia is flexed. (B and C) 10Bα recordings during swing (B) or ramp-and-hold (C) movements of the femur-tibia joint. An example response is highlighted in orange (B: n = 24; C: top: n = 16, bottom: n = 24). (D–F) The peak membrane potential while the femur is flexed before (orange) and after (red) drug application (*p<0.05; n.s.: not significant, Wilcoxon matched-pairs signed-rank test). (G) Left: the peak membrane potential while the femur is flexed before (orange) and after (red) application of the GABAa and GluCl antagonist, picrotoxin (100 µM). Middle: the change in membrane potential after tibia flexion before (orange) and after (red) application of picrotoxin (n.s.: not significant, *p>0.05, Wilcoxon matched-pairs signed-rank test). Right: example traces before (orange) and after (red) application of picrotoxin. (H and I) The change in membrane potential during the first 500 ms after vibration onset before (orange) and after (red) drug application.
Figure 8.
Figure 8.. Optogenetic activation of 10Bα neurons causes flies to freeze and stop walking.
(A) Schematic of optogenetic activation of 10Bα neurons in tethered flies walking on a spherical treadmill. The treadmill and fly are tracked using high-speed cameras, and an LED display presents visual patterns that encourage walking. A green laser (530 nm) is focused on the coxa of the fly’s left front leg. (B) Difference in speed during the 200 ms preceding the start of the stimulus period compared to a 200 ms window beginning after the start of the stimulus period, as indicated by the brackets in C (*p<0.05, bootstrapping with false discovery rate correction; 0 ms: Control: n = 6 flies; 10Bα: n = 10 flies; 13Bα: n = 7 flies; 9Aα: n = 7 flies; 360 ms: Control: n = 8 flies; 10Bα: n = 10 flies; 13Bα: n = 8 flies; 9Aα: n = 6 flies; 720 ms: Control: n = 13 flies; 10Bα: n = 11 flies; 13Bα: n = 13 flies; 9Aα: n = 11 flies). (C) Average treadmill forward velocity (± SEM) of walking flies during no laser trials (left) or trials with a 360 ms (middle) or 720 ms (right) laser stimulus. Green boxes indicate the duration of optogenetic stimulation. Black brackets indicate the pre- and post-laser onset time periods used to compare the effect of activation between control and interneuron lines in B. (D) Cumulative probability of a fly stopping (velocity <0.3 cm/s) during trials with no laser or trials with a 360 ms or 720 ms laser stimulus (0 ms: Control: 25 trials, 10Bα: 24 trials; 360 ms: Control: 25 trials, 10B: 19 trials; 720 ms: Control: 42 trials, 10Bα: 24 trials). (E) Schematic of the three central neuron populations (13Bα, 9Aα, and 10Bα) and their sensory inputs as determined by our experiments.
Figure 8—figure supplement 1.
Figure 8—figure supplement 1.. Optogenetic activation of 10Bα neurons causes flies to freeze and stop walking.
(A) Heat maps indicating fly’s forward velocity across different genotypes and laser stimulations. Each row is data from a single trial, and velocity has been normalized by dividing by the maximum speed per trial. White boxes indicate when the laser was on. (B) Average treadmill forward velocity (± SEM) of walking flies during no laser trials (top row) or trials with a 360 ms (middle row) or 720 ms (bottom row) laser stimulus. Green boxes indicate the duration of optogenetic stimulation. (C) Cumulative probability of a fly stopping (velocity <0.3 cm/s) during trials with no laser or trials with a 360 ms or 720 ms laser stimulus.

Similar articles

Cited by

References

    1. Allen AM, Neville MC, Birtles S, Croset V, Treiber CD, Waddell S, Goodwin SF. A single-cell transcriptomic atlas of the adult Drosophila ventral nerve cord. eLife. 2020;9:e54074. doi: 10.7554/eLife.54074. - DOI - PMC - PubMed
    1. Angelaki DE, Cullen KE. Vestibular system: the many facets of a multimodal sense. Annual Review of Neuroscience. 2008;31:125–150. doi: 10.1146/annurev.neuro.31.060407.125555. - DOI - PubMed
    1. Arber S. Motor circuits in action: specification, connectivity, and function. Neuron. 2012;74:975–989. doi: 10.1016/j.neuron.2012.05.011. - DOI - PubMed
    1. Azarfar A, Calcini N, Huang C, Zeldenrust F, Celikel T. Neural coding: a single neuron's perspective. Neuroscience & Biobehavioral Reviews. 2018;94:238–247. doi: 10.1016/j.neubiorev.2018.09.007. - DOI - PubMed
    1. Azevedo AW, Dickinson ES, Gurung P, Venkatasubramanian L, Mann RS, Tuthill JC. A size principle for recruitment of Drosophila leg motor neurons. eLife. 2020;9:e56754. doi: 10.7554/eLife.56754. - DOI - PMC - PubMed

Publication types

MeSH terms