. 2021 Feb 26;180(1):89-102.
doi: 10.1093/toxsci/kfaa177.

Differential Toxicological Outcome of Corn Oil Exposure in Rats and Mice as Assessed by Microbial Composition, Epithelial Permeability, and Ileal Mucosa-Associated Immune Status

Affiliations

Differential Toxicological Outcome of Corn Oil Exposure in Rats and Mice as Assessed by Microbial Composition, Epithelial Permeability, and Ileal Mucosa-Associated Immune Status

Kuppan Gokulan et al. Toxicol Sci. .

Abstract

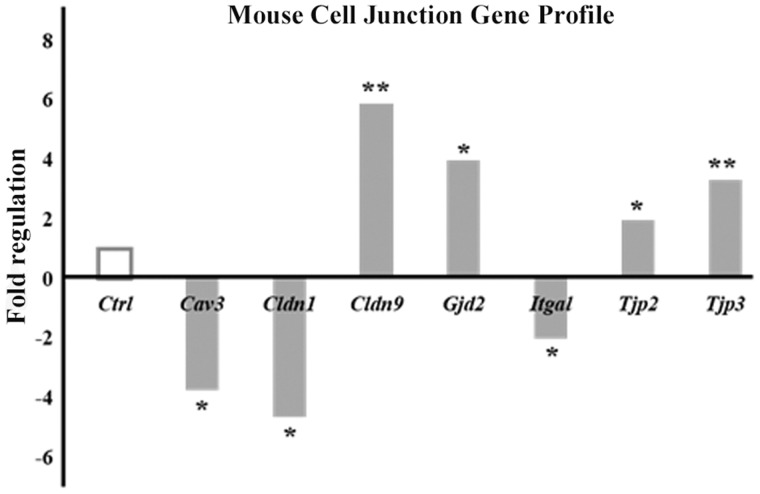
Studies to evaluate the toxicity of xenobiotics on the human gut microbiome and related health effects require a diligent selection of (1) an appropriate animal model to facilitate toxicity assessment in predicting human exposure, and (2) an appropriate non-interfering vehicle for the administration of water insoluble compounds. In biomedical studies with water insoluble xenobiotics, corn oil is one of the most commonly used nonaqueous vehicles. This study evaluated the suitability of corn oil as a vehicle in adult female Sprague Dawley rats and adult CD-1 mice; the rodent models that are often utilized in toxicological studies. We studied the host response in terms of change in the intestinal microbiome and mRNA expression of intestinal permeability and immune response-related genes when water (control) and corn oil (2 ml/kg) were administered as a vehicle through oral gavage. The results showed that the use of corn oil as a vehicle has no adverse impact in rats for either the immune response or the intestinal microbial population. On the other hand, mice treated with corn oil showed changes in bacterial community adhered to the ileum, as well as changes in the mRNA expression of intestinal permeability-related and ileal mucosa-associated immune response genes. Overall, results of this study suggest that the type of rodent species and vehicle used in toxicological risk assessments of xenobiotics studies should be taken into consideration in the experimental setup and study design.

Keywords: corn oil; immune response; intestinal permeability; microbiome; toxicology; xenobiotics.


Figures

Figure 1.
Figure 1.
Microbial enrichment and diversity in mice and rats during oil or water treatment by oral gavage. A, The bar diagram shows total operational taxonomic units (OTU) counts in rodents (n = 5 in each experimental group). B, The box diagram shows the alpha diversity index (Chao1) of each experimental group either treated with corn oil or water. The PCA plot shows greater variability in the bacterial populations of corn oil-treated mice (C) as compared with corn oil-treated rats (D).
Figure 2.
Figure 2.
Rarefaction curves from experimental groups. The rarefaction curve analysis shows the operational species abundance at different numbers of reads for individual animals. A, Top left figure shows the mice treated with corn oil. The y-axis shows the operational species richness, which falls between 300 and 625. B, Top right figure shows operational species abundance of mice treated with water, which had high operational species richness (625–875). C, The bottom left figure shows the operational species abundance in rats treated with corn oil that had high operational species richness (625–750), and D, The bottom right figure shows the operational species abundance of rats treated with water with also a high operational species richness (500–750).
Figure 3.
Figure 3.
Stacked bar diagram of relative abundance of top 5 phyla in mice and rats during water or corn oil treatment. The 100% stacked bar diagram shows the bacterial diversity between water and corn oil treatment in mice and rats. The upper panel shows the average relative abundance of five animals in each experimental group (mice treated with water or corn oil and rats treated with water or corn oil). The lower panel shows the relative abundance of top 5 phyla in each animal.
Figure 4.
Figure 4.
Heatmap of microbial genera present in each animal (mice and rats) gavaged with water or corn oil. Hclust function in R package stat was used to generate heatmap. For generating this heatmap, the OTU data were rarefied to minimum library size. Similarity analysis was conducted using Euclidean distance and Ward hierarchical clustering algorithm. Heatmap color (blue to dark red) displays the row-scaled relative abundance of each genus across all samples.
Figure 5.
Figure 5.
Plot of genera that were statistically significantly abundant among the rodents during water or corn oil treatment. Classical Univariate statistical comparisons were conducted using Mann-Whitney/Kruskal-Wallis test to compare the relative abundance of genera in each experimental group (n = 5 in each experimental group). The median, and the box delineates the upper and lower quartile. The whiskers show the maximum and minimum values. The statistical significance (p values) within the experimental groups were as follow: Anoxybacillus = .00090066; Candidatus = .0028974; Rothia = .004563; Peptoclostridium = .02; Turicibacter = .03; Streptococcus = .04; Thermoascaceae = .05; Stenotrophomonas = .06.
Figure 6.
Figure 6.
mRNA expression of genes involved in the mouse cell-cell junction pathway. Fold change in expression of genes involved in the cell junction pathway is shown as bar graph. Single (*) and double (**) stars signify the p values ≤.05 and ≤.001, respectively. Fold changes shown here are the average of gene expression for 5 mice, each gavaged with corn oil (gray bar) compared with mice gavaged with water (white bar; used as control).
Figure 7.
Figure 7.
mRNA expression of genes involved in the signaling pathways. Fold change in expression of genes involved in the immune response pathway is shown as the bar graph. Single (*) and double (**) stars signify the p values ≤.05 and ≤.001, respectively. Fold changes shown here are the average of gene expression for 5 mice, each gavaged with corn oil (gray bar) compared with the mice gavaged with water (white bar; used as control). Genes were grouped together based on their roles in different stages of immune response pathways, as (A) toll-like receptor signaling pathways, (B) nod-like receptor signaling pathways, (C) signaling pathways downstream to toll- and nod-like receptor signaling pathways, (D) apoptotic pathways, (E) genes of the inflammatory response pathway and, (F) the cytokines genes found to be significantly up/downregulated.
Figure 8.
Figure 8.
Intestinal cytokines levels upon treatment of corn oil. The bar diagram shows the observed concentration of different cytokines; * signifies p values ≤.05. Concentrations of cytokines shown here are the average of the cytokine concentrations obtained for 5 mice gavaged with water (white bar) and corn oil (gray bar), respectively. Rats did not show any significant change in the cytokine levels (data not shown).
Figure 9.
Figure 9.
Schematic diagram showing the perturbation of mRNA expression and cytokine release in mice fed with corn oil. Green arrow shows upregulation and red arrow shows downregulation of respective genes mRNA expression in the pathway.

References

    1. Ajibade A. A., Wang H. Y., Wang R. F. (2013). Cell type-specific function of TAK1 in innate immune signaling. Trends Immunol. 34, 307–316. - PubMed
    1. Akira S., Uematsu S., Takeuchi O. (2006). Pathogen recognition and innate immunity. Cell 124, 783–801. - PubMed
    1. Andersen A., Daniel L., Mølbak K., Fleischer Michaelsen L.Lauritzen, (2011). Molecular fingerprints of the human fecal microbiota from 9 to 18 months old and the effect of fish oil supplementation. J. Pediatr. Gastroenterol. Nutr. 53, 303–309. - PubMed
    1. Caesar R., Tremaroli V., Kovatcheva-Datchary P., Cani P. D., Backhed F. (2015). Crosstalk between gut microbiota and dietary lipids aggravates WAT inflammation through TLR signaling. Cell Metab. 22, 658–668. - PMC - PubMed
    1. Callahan B. J., McMurdie P. J., Rosen M. J., Han A. W., Johnson A. J., Holmes S. P. (2016). DADA2: High-resolution sample inference from Illumina amplicon data. Nat. Methods 13, 581–583. - PMC - PubMed

Publication types