. 2020 Dec 2;14(12):e0008878.
doi: 10.1371/journal.pntd.0008878. eCollection 2020 Dec.

Spatiotemporal analysis of mycolactone distribution in vivo reveals partial diffusion in the central nervous system

Affiliations

Spatiotemporal analysis of mycolactone distribution in vivo reveals partial diffusion in the central nervous system

Emma Colucci-Guyon et al. PLoS Negl Trop Dis. .

Abstract

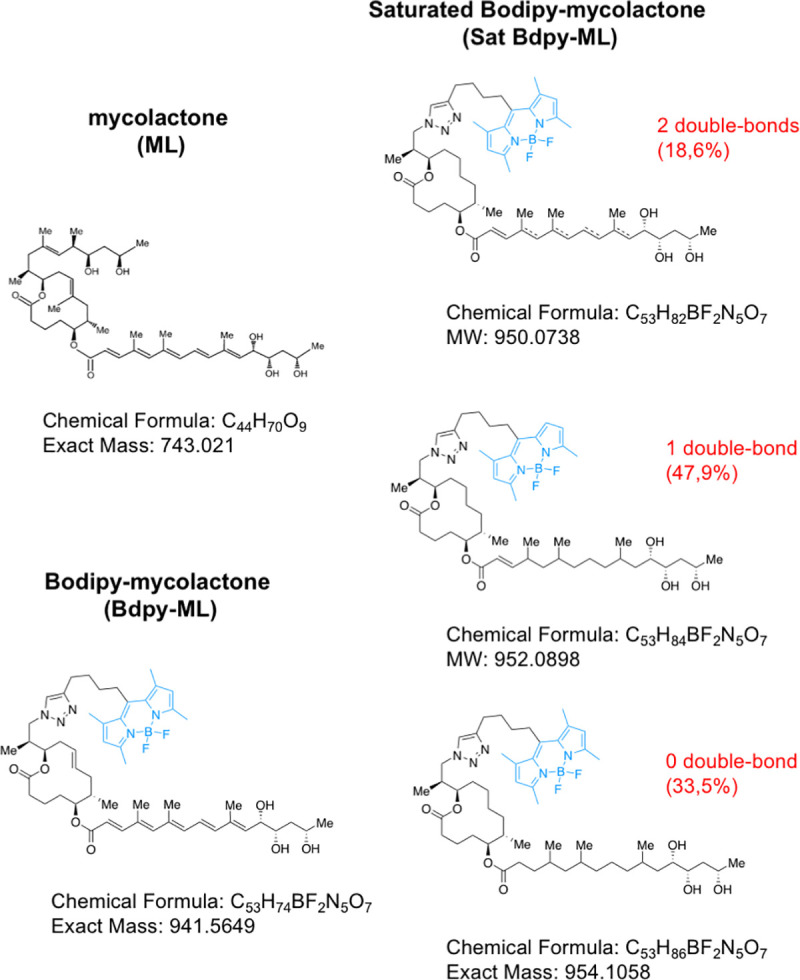
Mycobacterium ulcerans, the causative agent of Buruli ulcer (BU) disease, is unique amongst human pathogens in its capacity to produce a lipid toxin called mycolactone. While previous studies have demonstrated that bacterially-released mycolactone diffuses beyond infection foci, the spatiotemporal distribution of mycolactone remained largely unknown. Here, we used the zebrafish model to provide the first global kinetic analysis of mycolactone's diffusion in vivo, and multicellular co-culture systems to address the critical question of the toxin's access to the brain. Zebrafish larvae were injected with a fluorescent-derivative of mycolactone to visualize the in vivo diffusion of the toxin from the peripheral circulation. A rapid, body-wide distribution of mycolactone was observed, with selective accumulation in tissues near the injection site and brain, together with an important excretion through the gastro-intestinal tract. Our conclusion that mycolactone reached the central nervous system was reinforced by an in cellulo model of human blood brain barrier and a mouse model of M. ulcerans-infection. Here we show that mycolactone has a broad but heterogenous profile of distribution in vivo. Our investigations in vitro and in vivo support the view that a fraction of bacterially-produced mycolactone gains access to the central nervous system. The relative persistence of mycolactone in the bloodstream suggests that assays of circulating mycolactone are relevant for BU disease monitoring and treatment optimization.


Conflict of interest statement

The authors have declared that no competing interests exist.

Figures

Fig 1
Fig 1. Structures of natural ML and fluorescent derivatives used in this study.
Natural ML is constituted of a lactone ring on which are appended two polyketide chains. In Bdpy-ML, the shortest polyketide chain was substituted with a bodipy fluorophore. Saturation of Bdpy-ML’s resulted in Sat-Bdpy-ML, a mixture of compounds presenting two, one or no double bounds within the longest polyketide chain (dotted lines indicate the putative positions of the double bonds).
Fig 2
Fig 2. In vivo diffusion of Bdpy-ML in zebrafish larva.
(A) Brightfield lateral view of a larva at 4 dpf with main anatomical structures highlighted. GI, Gastro-intestinal. (B) lateral views of 4dpf zebrafish Kdrl:Ras mCherry larvae, 2 and 24 hours post injection (hpi) in the caudal vein with vehicle (Veh), Sat-Bdpy-ML or Bdpy-ML. Images are maximal z projections of confocal tile scan images acquired on same larvae over time; mCherry fluorescence shown in red, Bdpy in green. Arrowheads indicate the spinal canal, arrows indicate the site of intravenous injection (iv), stars show accumulation in the GI tract at 24h. Areas delimited by dotted lines in (B) are shown at higher magnification in (C, 2 hpi) and (F, 24 hpi). Scale Bar 100 μm. (C) Enlarged views (with transmitted light image overlaid on fluorescence) of (B) showing accumulation of Bdpy-ML in heart and liver 2 hpi. (D) Detail of the vasculature in the ventral region of the tail showing longitudinal section of blood vessels and colocalization of Bdpy-ML with mCherry in endothelial cells of the caudal vein 4 hpi. N: notochord, cv (dotted brackets): caudal vein, da (brackets): dorsal aorta. (E) Dorsal view of the head with sections of blood vessels showing blood circulating Bdpy-ML and diffusion into the brain with accumulation in the tectal neuropil (tn) at 24 hpi. Right panel is an enlarged view a blood vessel in longitudinal section. (F) Enlarged view of the trunk in (B) showing preferential accumulation of Bdpy-ML in muscles (m), spinal canal (arrowheads) and spinal cord (double arrow) 24 hpi. N: notochord. (A, B, C, F): lateral views, dorsal top, anterior left; (D) lateral view, dorsal top right, anterior top left; (E) dorsal view, anterior down left. Scale bars (C-E) 40 μm. All images are representative of at least 10 larvae from 3 independent experiments. Images in (C-F) correspond to one focal plane (z = 2 μm).
Fig 3
Fig 3. Quantification of Bdpy-ML diffusion in zebrafish larva.
Relative fluorescence (to total fluorescent signal) of Bdpy-ML (left) and Sat-Bdpy-ML (right) in blood vessels (BV), muscles, brain and spinal cord, 2 h (light grey) and 24 hpi (dark grey). Data are mean percentages +/- SD. Fluorescence signals were measured on >6 larvae per group with acquisitions in 2 different focal planes (z = 2 μm) for each region, using the same settings.
Fig 4
Fig 4. Intravenously-delivered ML gains access to and impact microglia behaviour.
(A) Confocal imaging of the brain region of a mfap4:mCherry-F larva (dorsal view) 24 hpi with Bdpy-ML. Macrophages in red, Bdpy-ML in green. White square indicates enlarged view in (B). tn: tectal neuropil, spv: stratum periventricular, bv: brain ventricles. Scale bar 40 μm. (B) Enlarged view of spv region showing accumulation of Bdpy-ML in microglia (arrows). Images are projections of 4 z stacks (z = 2 μm) scale bar 10 μm. (C) TUNEL labeling of the trunk and tail region of fixed larvae (anterior left, dorsal up), 24 hpi with vehicle or 0.5 ng ML. Arrowheads indicate the site of injection. Scale bar 100 μm. (D) Quantification of TUNEL+ cells in the trunk and tail region. Data are mean +/- SD per larva, 3 larvae per group. (E) TUNEL labeling of brain region (delimited by dotted line) of fixed larvae (dorsal view), 24 hpi with vehicle or 0.5 ng of ML. Images are maximum intensities projection of stacks. Scale bar 40 μm. (F) Quantification of TUNEL+ cells in the brain. Mean +/- SD per larva, > 7 larvae per group. (G) Microglia number, relative to vehicle-injected control. Data are mean percentages to ctrl +/- SD per larva, 3 independent experiments, > 7 larvae per group. (H) Images are 3D reconstructions of microglia (from live imaging) in spv region of vehicle- and ML-injected (0,5 ng) larvae. Scale bar 40 μm. Graph shows mean percentages of sphericity +/- SD of brain microglia in larvae injected with increasing doses of ML (0.25, 0.5 and 1 ng) or corresponding volume of vehicle (veh), as determined with the HK-Means plugin of Icy software. Data are from 3 independent experiments, > 7 larvae per group. Mann-Whitney *P<0.05.
Fig 5
Fig 5. ML crosses an in cellulo model of human blood brain barrier.
(A) left panel illustrates the basic structural organization of the BBB, right panel shows the in vitro transwell, non-contact BBB model used in this study. The human brain capillary endothelial hCMEC/D3 cells are seeded on the apical side of the insert and astrocytes U373 on the bottom of the baso-lateral compartment. Apical and basolateral compartment respectively mimic blood and brain compartments. (B) Permeability to LY as expressed in cm/min, after 6 to 24 h exposure to 1 μg of ML (red bars) or vehicle (DMSO, black bars). Data are means of 3 replicates +/- SD, and are representative of 3 independent experiments. Two-way Anova, no statistically significant difference between ML-treated and vehicle controls. (C) Incorporation of fluorescence across time (as detected by flow cytometry) in hCMEC/D3 (green line) and U373 cells (blue lines) following addition of 2.5 μg of Bdpy-ML on apical compartment in presence (plain line) or not (dotted line) of hCMEC. Data are mean MFI +/- SD of triplicates. (D) Production of IL-8 (expressed in percentage to control) by LPS-activated U373 cells after up to 6 hours of crossing of vehicle (Veh, black curve) and ML (red curves) on filter without hCMEC/D3 (dotted line) or with hCMEC/D3 (plain line). Data are mean percentages of 2 independent experiments in triplicates.
Fig 6
Fig 6. ML is detected in the brain of M. ulcerans infected mice.
(A) UHPLC elution profiles obtained after elution of spleen (left panels) or brain (right panels) lipid extracts from non-infected (Control) or M. ulcerans-infected mice. Lipid extracts have been prepared from pools of 6 organs. For each UHPLC profile are shown the total ion current (top) and ML’s ion extract [M+Na]+ = 765.4913 (bottom). (B) MS/MS ML’s spectrum showing parental (PI) and fragmentation ions (stars) for pure (top) or ML identified in brain’s lipid extract of M. ulcerans infected mice.

Similar articles

Cited by

References

    1. Isaac C, Mauborgne A, Grimaldi A, Ade K, Pohl M, Limatola C, et al. Mycolactone displays anti-inflammatory effects on the nervous system. PLoS Negl Trop Dis 2017;11:e0006058 10.1371/journal.pntd.0006058 - DOI - PMC - PubMed
    1. George KM, Chatterjee D, Gunawardana G, Welty D, Hayman J, Lee R, et al. Mycolactone: a polyketide toxin from Mycobacterium ulcerans required for virulence. Science 1999;283:854–7. 10.1126/science.283.5403.854 - DOI - PubMed
    1. Guenin-Macé L, Ruf M-T, Pluschke G, Demangel C. Mycolactone: More than Just a Cytotoxin In: Pluschke G, Röltgen K, editors. Buruli Ulcer: Mycobacterium Ulcerans Disease, Cham: Springer International Publishing; 2019, p. 117–34. 10.1007/978-3-030-11114-4_7 - DOI
    1. Chany A-C, Tresse C, Casarotto V, Blanchard N. History, biology and chemistry of Mycobacterium ulcerans infections (Buruli ulcer disease). Nat Prod Rep 2013;30:1527–67. 10.1039/c3np70068b - DOI - PubMed
    1. Demangel C, Stinear TP, Cole ST. Buruli ulcer: reductive evolution enhances pathogenicity of Mycobacterium ulcerans. Nat Rev Microbiol 2009;7:50–60. 10.1038/nrmicro2077 - DOI - PubMed

Publication types

LinkOut - more resources