

CoMA - an intuitive and user-friendly pipeline for amplicon-sequencing data analysis
- PMID: 33264369
- PMCID: PMC7710066
- DOI: 10.1371/journal.pone.0243241
CoMA - an intuitive and user-friendly pipeline for amplicon-sequencing data analysis
Abstract
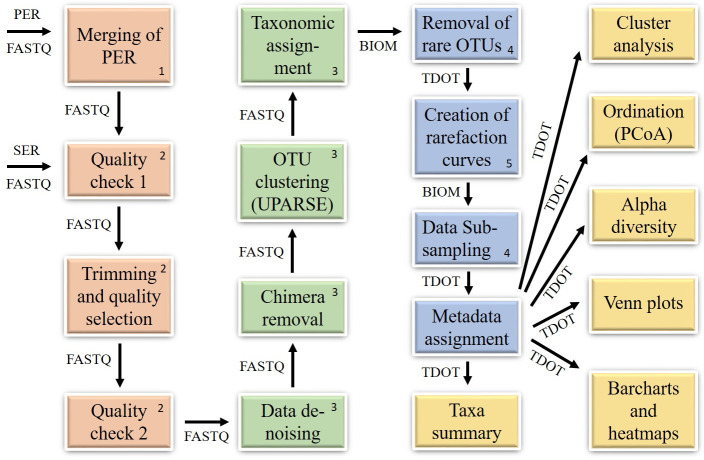
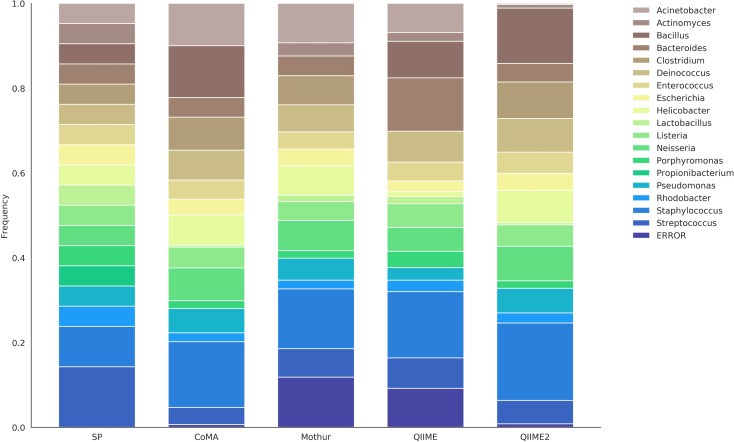
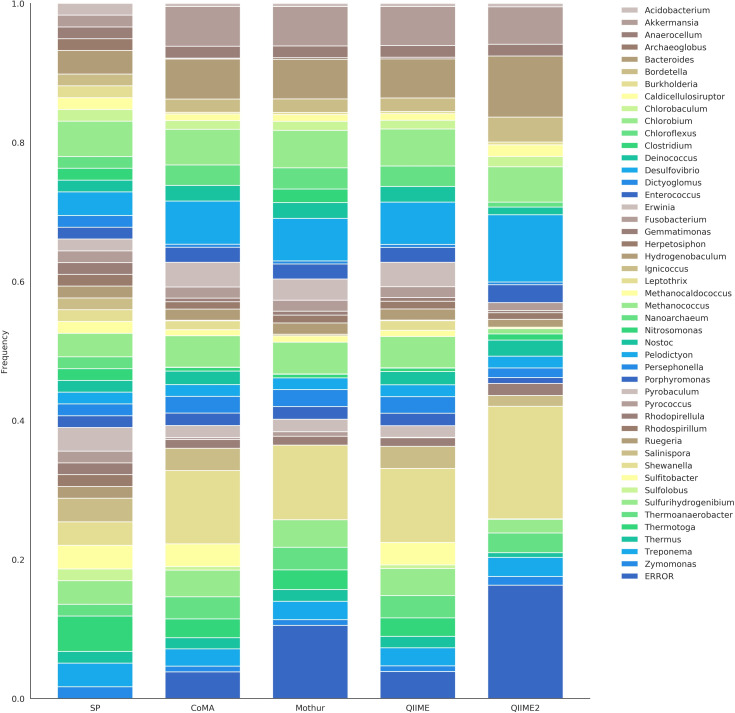
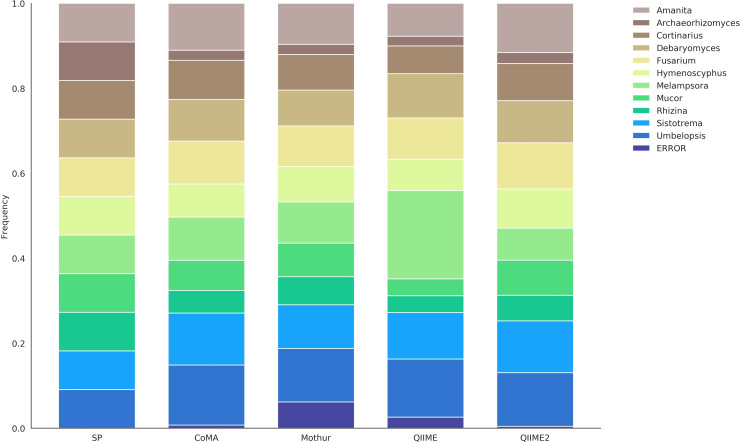
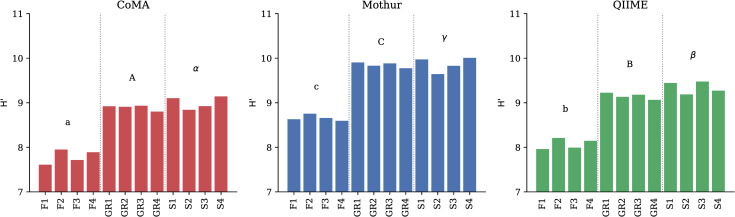
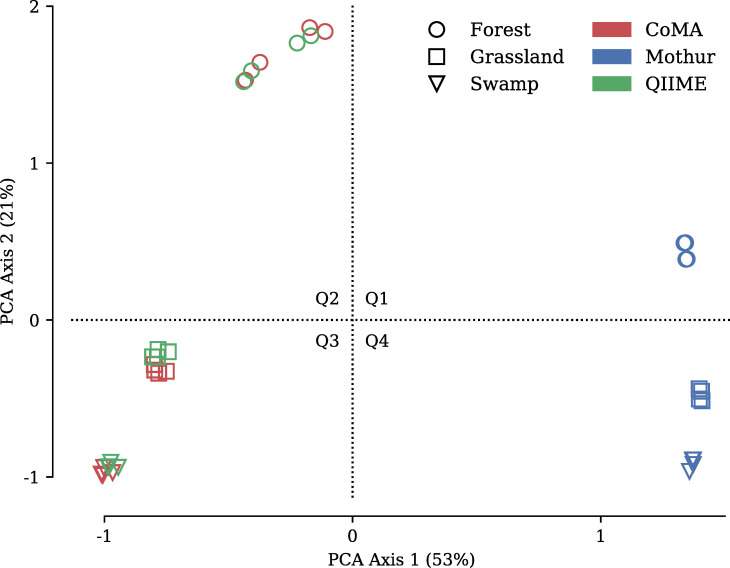
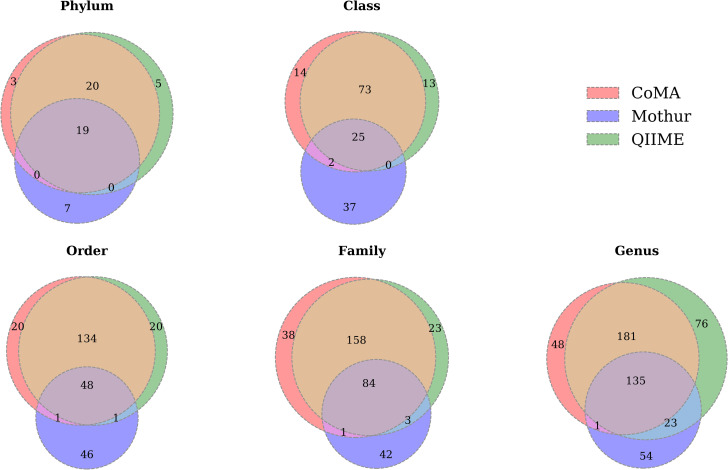
In recent years, there has been a veritable boost in next-generation sequencing (NGS) of gene amplicons in biological and medical studies. Huge amounts of data are produced and need to be analyzed adequately. Various online and offline analysis tools are available; however, most of them require extensive expertise in computer science or bioinformatics, and often a Linux-based operating system. Here, we introduce "CoMA-Comparative Microbiome Analysis" as a free and intuitive analysis pipeline for amplicon-sequencing data, compatible with any common operating system. Moreover, the tool offers various useful services including data pre-processing, quality checking, clustering to operational taxonomic units (OTUs), taxonomic assignment, data post-processing, data visualization, and statistical appraisal. The workflow results in highly esthetic and publication-ready graphics, as well as output files in standardized formats (e.g. tab-delimited OTU-table, BIOM, NEWICK tree) that can be used for more sophisticated analyses. The CoMA output was validated by a benchmark test, using three mock communities with different sample characteristics (primer set, amplicon length, diversity). The performance was compared with that of Mothur, QIIME and QIIME2-DADA2, popular packages for NGS data analysis. Furthermore, the functionality of CoMA is demonstrated on a practical example, investigating microbial communities from three different soils (grassland, forest, swamp). All tools performed well in the benchmark test and were able to reveal the majority of all genera in the mock communities. Also for the soil samples, the results of CoMA were congruent to those of the other pipelines, in particular when looking at the key microbial players.
Conflict of interest statement
The authors have declared that no competing interests exist.
Figures
References
-
- Cole EJ, Zandvakili OR, Blanchard J, Xing B, Hashemi M, Etemadi F. Investigating responses of soil bacterial community composition to hardwood biochar amendment using high-throughput PCR sequencing. Appl. Soil Ecol. 2019; 136: 80–85. 10.1016/j.apsoil.2018.12.010 - DOI
-
- Zamyadi A, Romanis C, Mills T, Neilan B, Choo F, Coral LA, et al. Diagnosing water treatment critical control points for cyanobacterial removal: Exploring benefits of combined microscopy, next-generation sequencing, and cell integrity methods. Water Res. 2019; 152: 96–105. 10.1016/j.watres.2019.01.002 - DOI - PubMed
-
- Jung SW, Kim HJ, Park JS, Lee T-K, Shin K, Jeong S-Y, et al. Planktonic bivalve larvae identification and quantification in Gomso Bay, South Korea, using next-generation sequencing analysis and microscopic observations. Aquaculture. 2018; 490: 297–302. 10.1016/j.aquaculture.2018.02.053 - DOI
-
- Parlapani F, Michailidou S, Anagnostopoulos D, Sakellariou A, Pasentsis K, Psomopoulos F, et al. Microbial spoilage investigation of thawed common cuttlefish (Sepia officinalis) stored at 2° C using next generation sequencing and volatilome analysis. Food Microbiol. 2018; 76: 518–525. 10.1016/j.fm.2018.08.004 - DOI - PubMed
Publication types
MeSH terms
Substances
Grants and funding
LinkOut - more resources
Full Text Sources
