. 2021 Jan 8;49(D1):D1496-D1501.
doi: 10.1093/nar/gkaa1107.

A new decade and new data at SoyBase, the USDA-ARS soybean genetics and genomics database

Affiliations

A new decade and new data at SoyBase, the USDA-ARS soybean genetics and genomics database

Anne V Brown et al. Nucleic Acids Res. .

Abstract

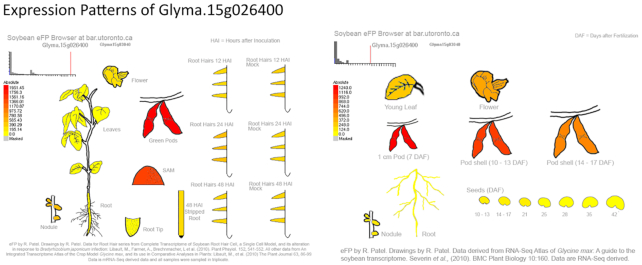
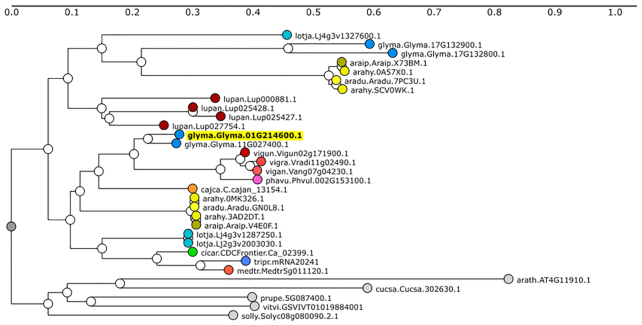
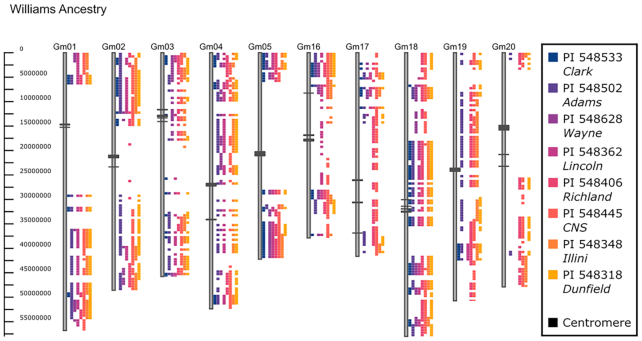
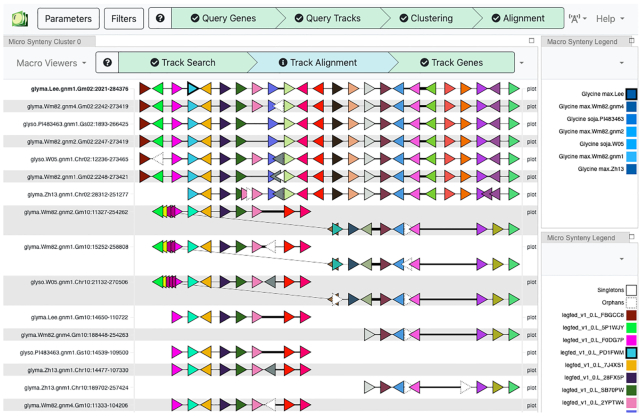
SoyBase, a USDA genetic and genomics database, holds professionally curated soybean genetic and genomic data, which is integrated and made accessible to researchers and breeders. The site holds several reference genome assemblies, as well as genetic maps, thousands of mapped traits, expression and epigenetic data, pedigree information, and extensive variant and genotyping data sets. SoyBase displays include genetic, genomic, and epigenetic maps of the soybean genome. Gene expression data is presented in the genome viewer as heat maps and pictorial and tabular displays in gene report pages. Millions of sequence variants have been added, representing variations across various collections of cultivars. This variant data is explorable using new interactive tools to visualize the distribution of those variants across the genome, between selected accessions. SoyBase holds several reference-quality soybean genome assemblies, accessible via various query tools and browsers, including a new visualization system for exploring the soybean pan-genome. SoyBase also serves as a nexus of announcements pertinent to the greater soybean research community. The database also includes a soybean-specific anatomic and biochemical trait ontology. The database can be accessed at https://soybase.org.


Figures

Figure 1.
Figure 1.
eFP Graphic of Gene Expression. Gene expression of soybean gene models is graphically depicted using the eFP software at the University of Toronto. Currently, two Gene Atlas experiments are used to allow the user to visualize the general expression level of the selected gene across the sampled tissues. This is particularly useful in candidate gene identification surveys. This example displays the expression of Glyma.15G026400.
Figure 2.
Figure 2.
Ortholog Identification. Ortholog information is available through a collaboration with the Legume Information System and the PhyloTree Tool. This display is useful to allow users to leverage information for orthologs to other legume species. Nodes on the tree indicate the species and gene name within that species (species.gene). Outgroup species are represented as gray circles. In this example Glyma.01G214600 was the starting gene. aradu = Arachis duranensis; arahy = Arachis hypogaea; araip = Arachis ipaensis; cajca = Cajanus cajan; cicar = Cicer arietinum; glyma = Glycine max; lotja = Lotus japonicus; lupan = Lupinus angustifolius; medtr = Medicago truncatula; phavu = Phaseolus vulgaris; tripr = Trifolium praetense; vigan = Vigna angularis; vigra = Vigna radiata; vigun = Vigna unguiculata. Outgroups (one arbitrary sequence selected per species): arath = Arabidopsis thaliana; cucsa = Cucumis sativus; prupe = Prunus persica; solly = Solanum lycopersicum; vitvi = Vitis vinifera.
Figure 3.
Figure 3.
Williams ancestry using GCViT. Soybean accession Williams is used as a reference and compared to lines in its direct pedigree. Differences between WIlliams and its ancestors are displayed using the Haplotype view with a threshold of 5. A subset of the chromosomes are shown (Gm01-05, Gm16-20). From left to right Williams ancestors, indicated as PI name/Common name, are PI 548533/Clark, PI 548502/Adams, PI 548628/Wayne, PI 548362/Lincoln, PI 548406/Richland, PI 548445/CNS, PI 548348/Illini and PI 548318/Dunfield. Centromeric regions are indicated as black boxes on the chromosomes.
Figure 4.
Figure 4.
Genome Context Viewer (GCV). View of gene-based synteny for seven soybean assemblies: Lee, Wm82 (v1, v2 & v4), Zhonghuang 13 and G. soja W05 and PI 483463. Each horizontal line is a region from one assembly. Colored triangles represent genes (with orientation), with colors determined by distinct gene families; thus, adjacent red triangles represent tandemly duplicated genes. Thicker line segments indicate greater genomic distance. The top seven rows are from chromosome 2, and the bottom seven rows are from the homoeologous region on chromosome 10. Inversions (diagonal lines) are evident in three assemblies on chromosome 10. Macro-synteny (chromosome-scale) views are also available.

References

    1. Schmutz J., Cannon S.B., Schlueter J., Ma J., Mitros T., Nelson W., Hyten D.L., Song Q., Thelen J.J., Cheng J. et al.. Genome sequence of the palaeopolyploid soybean. Nature. 2010; 463:178–183. - PubMed
    1. Donlin M.J. Using the Generic Genome Browser (GBrowse). Curr. Protocols in Bioinformatics. 2009; 28:9.9.1–9.9.25. - PubMed
    1. Generic Model Organism Database (GMOD.org) 2020; http://gmod.org.
    1. Valliyodan B., Cannon S.B., Bayer P.E., Shu S., Brown A.V., Ren L., Jenkins J., Chung C.Y.L., Chan T.F., Daum C.G. et al.. Construction and comparison of three reference-quality genome assemblies for soybean. Plant J. 2019; 100:1066–1082. - PubMed
    1. Shen Y., Liu J., Geng H., Zhang J., Liu Y., Zhang H., Xing S., Du J., Ma S., Tian Z.. De novo assembly of a Chinese soybean genome. Sci. China Life Sci. 2018; 61:871–884. - PubMed

Publication types

MeSH terms