. 2021 Jan 8;49(D1):D1197-D1206.
doi: 10.1093/nar/gkaa1063.

HERB: a high-throughput experiment- and reference-guided database of traditional Chinese medicine

Affiliations

HERB: a high-throughput experiment- and reference-guided database of traditional Chinese medicine

ShuangSang Fang et al. Nucleic Acids Res. .

Abstract

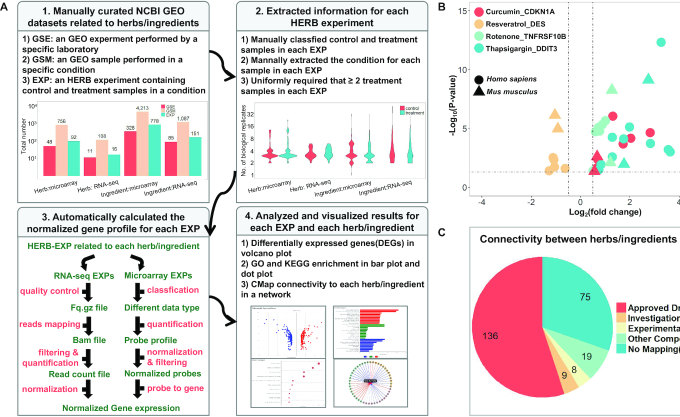
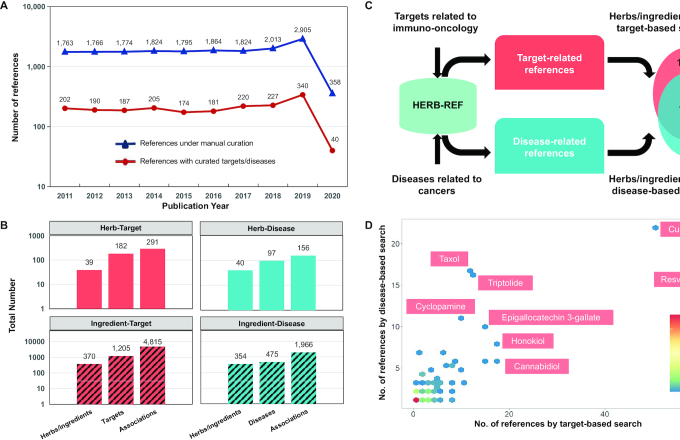
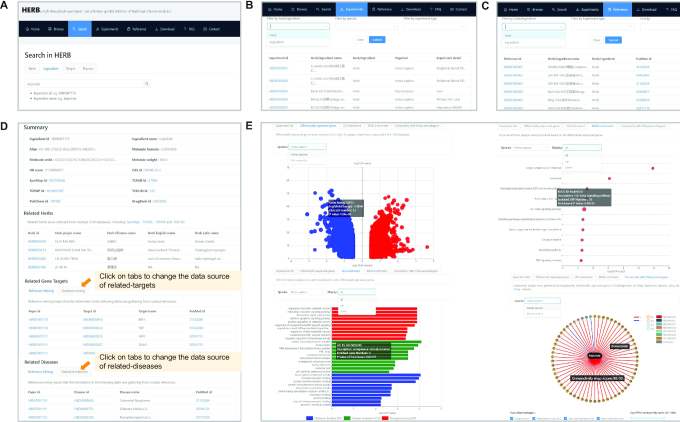
Pharmacotranscriptomics has become a powerful approach for evaluating the therapeutic efficacy of drugs and discovering new drug targets. Recently, studies of traditional Chinese medicine (TCM) have increasingly turned to high-throughput transcriptomic screens for molecular effects of herbs/ingredients. And numerous studies have examined gene targets for herbs/ingredients, and link herbs/ingredients to various modern diseases. However, there is currently no systematic database organizing these data for TCM. Therefore, we built HERB, a high-throughput experiment- and reference-guided database of TCM, with its Chinese name as BenCaoZuJian. We re-analyzed 6164 gene expression profiles from 1037 high-throughput experiments evaluating TCM herbs/ingredients, and generated connections between TCM herbs/ingredients and 2837 modern drugs by mapping the comprehensive pharmacotranscriptomics dataset in HERB to CMap, the largest such dataset for modern drugs. Moreover, we manually curated 1241 gene targets and 494 modern diseases for 473 herbs/ingredients from 1966 references published recently, and cross-referenced this novel information to databases containing such data for drugs. Together with database mining and statistical inference, we linked 12 933 targets and 28 212 diseases to 7263 herbs and 49 258 ingredients and provided six pairwise relationships among them in HERB. In summary, HERB will intensively support the modernization of TCM and guide rational modern drug discovery efforts. And it is accessible through http://herb.ac.cn/.


Figures

Figure 1.
Figure 1.
Construction and characterization of HERB-EXP. (A) A schematic diagram of the data processing framework in HERB-EXP in four consecutive steps: 1. download data from GEO experiments (GSE) and samples (GSM), extract HERB experiments (EXP) for each herb/ingredient, and show the number of GSE/GSM/EXPs for each data type in bar plots. 2. For each EXP, illustrate the number of biological replicates for control and treatment samples in violin plots. 3. Automatically analyze RNA-seq and microarray data according to different pipelines for each EXP first, and then merge results from multiple EXPs together for each herb/ingredient. 4. Visualize the results of differential expression analysis, GO and KEGG enrichment, or CMap connectivity for each EXP, and then for each herb/ingredient, in volcano plot, bar plot, dot plot or network respectively. (B) The differential expression of four known targets (CDKN1A, DES, TNFRSF10B and DDIT3) for four TCM ingredients (curcumin, resveratrol, rotenone, and thapsigargin) in multiple EXPs related to these ingredients are shown in volcano plots. The X-axis shows the expression change compared to control samples and the Y-axis shows statistical significance. The four colors correspond to four target-ingredient pairs, and the two shapes indicate the species information for each EXP (mouse/human). (C) Classification of all herbs/ingredients with HERB-EXP data, according to their mapped compounds in CMap.
Figure 2.
Figure 2.
Overview of HERB-REF. (A) Statistics on the number of herb/ingredient-related references published in each year. The blue line represents the total references from manual curation, and the red line represents the references with curated targets/diseases. (B) The number of curated herbs/ingredients, targets/diseases, and their associations from HERB-REF are shown in bar plots, with the four facets showing four types of associations: herb-target, herb-disease, ingredient–target, and ingredient–disease. (C) HERB-REF datasets were used to search and rank promising herbs or ingredients for cancer-related diseases that could be connected to immuno-oncology related targets. The number of herbs/ingredients obtained by target-based search and/or disease-based search was shown in a Venn plot. (D) The selected herbs/ingredients that were supported by both target-based and disease-based search were illustrated in a dot plot, with the X- and Y-axis showing the number of references from each search, respectively. The density of dots representing the number of dots at the same point are represented in color scales.
Figure 3.
Figure 3.
An illustration of an HERB search. (A) The search page of HERB shows the main 4 components of HERB, including herbs, ingredients, targets, and diseases. (B) The experiment page of HERB shows all high-throughput data related to herbs/ingredients and analyzed by HERB. (C) The reference page of HERB shows all published references with curated targets/diseases information for herbs/ingredients. (D) The details page for an example ingredient, triptolide. The summary panel comes first, and shows relevant descriptive information for this ingredient. The following panels show the herbs, gene targets, and diseases related to this ingredient, respectively. Users can click on the tabs in each panel to navigate information from different data sources. (E) The subsequent detailed page for triptolide. Four figures were used to visualize the high-throughput data related to triptolide. For example, the DEGs are shown in a volcano plot (upper-left). The enriched GO terms and KEGG pathways are shown in bar plot and dot plot (lower-left and upper-right). The connectivity between triptolide and its related compounds in CMap are shown in a network. Note that all figures are implemented in an interactive way where users can see the details of each dot/bar/node/edge upon mousing over them.

References

    1. Duran-Frigola M., Pauls E., Guitart-Pla O., Bertoni M., Alcalde V., Amat D., Juan-Blanco T., Aloy P.. Extending the small-molecule similarity principle to all levels of biology with the Chemical Checker. Nat. Biotechnol. 2020; 38:1087–1096. - PMC - PubMed
    1. Kwon O.S., Kim W., Cha H.J., Lee H.. In silico drug repositioning: from large-scale transcriptome data to therapeutics. Arch. Pharm. Res. 2019; 42:879–889. - PubMed
    1. Subramanian A., Narayan R., Corsello S.M., Peck D.D., Natoli T.E., Lu X., Gould J., Davis J.F., Tubelli A.A., Asiedu J.K. et al. .. A Next Generation Connectivity Map: L1000 platform and the first 1,000,000 profiles. Cell. 2017; 171:1437–1452. - PMC - PubMed
    1. Clough E., Barrett T.. The gene expression omnibus database. Methods Mol. Biol. 2016; 1418:93–110. - PMC - PubMed
    1. Musa A., Ghoraie L.S., Zhang S.D., Glazko G., Yli-Harja O., Dehmer M., Haibe-Kains B., Emmert-Streib F.. A review of connectivity map and computational approaches in pharmacogenomics. Brief. Bioinform. 2018; 19:506–523. - PMC - PubMed

Publication types