. 2020 Dec 16;48(22):12751-12777.
doi: 10.1093/nar/gkaa1124.

Developmental differences in genome replication program and origin activation

Affiliations

Developmental differences in genome replication program and origin activation

Cathia Rausch et al. Nucleic Acids Res. .

Abstract

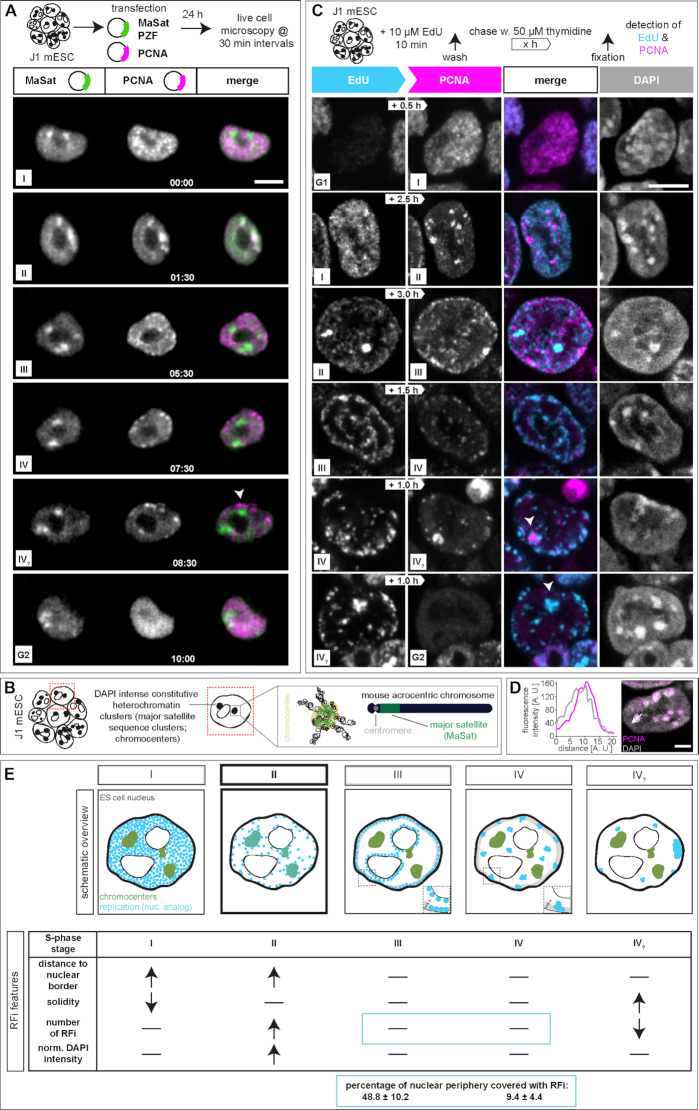
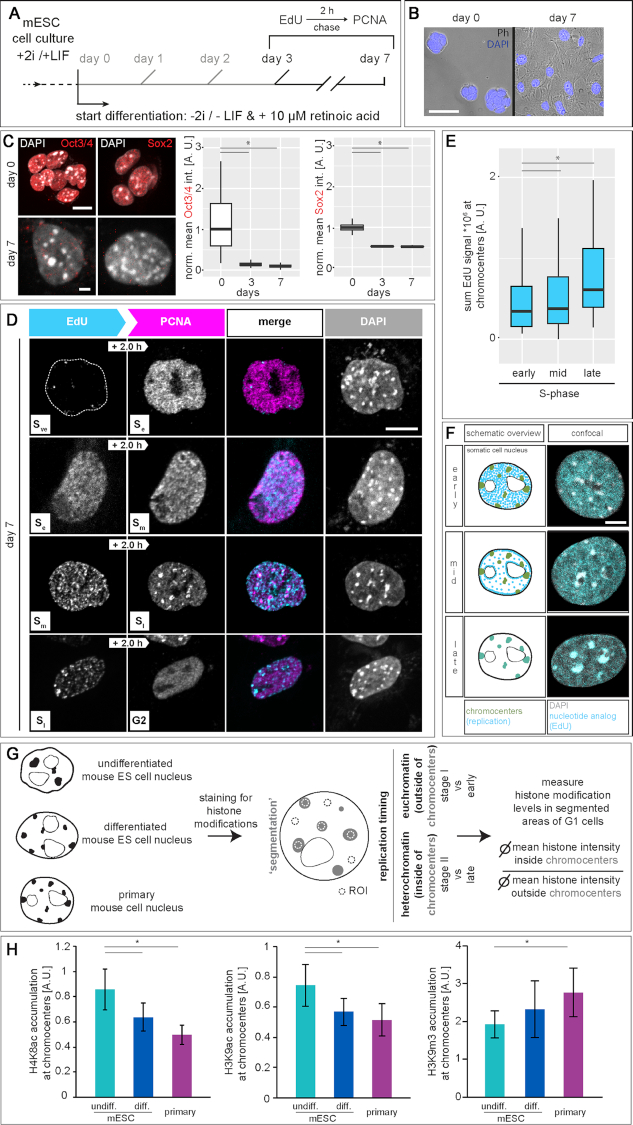
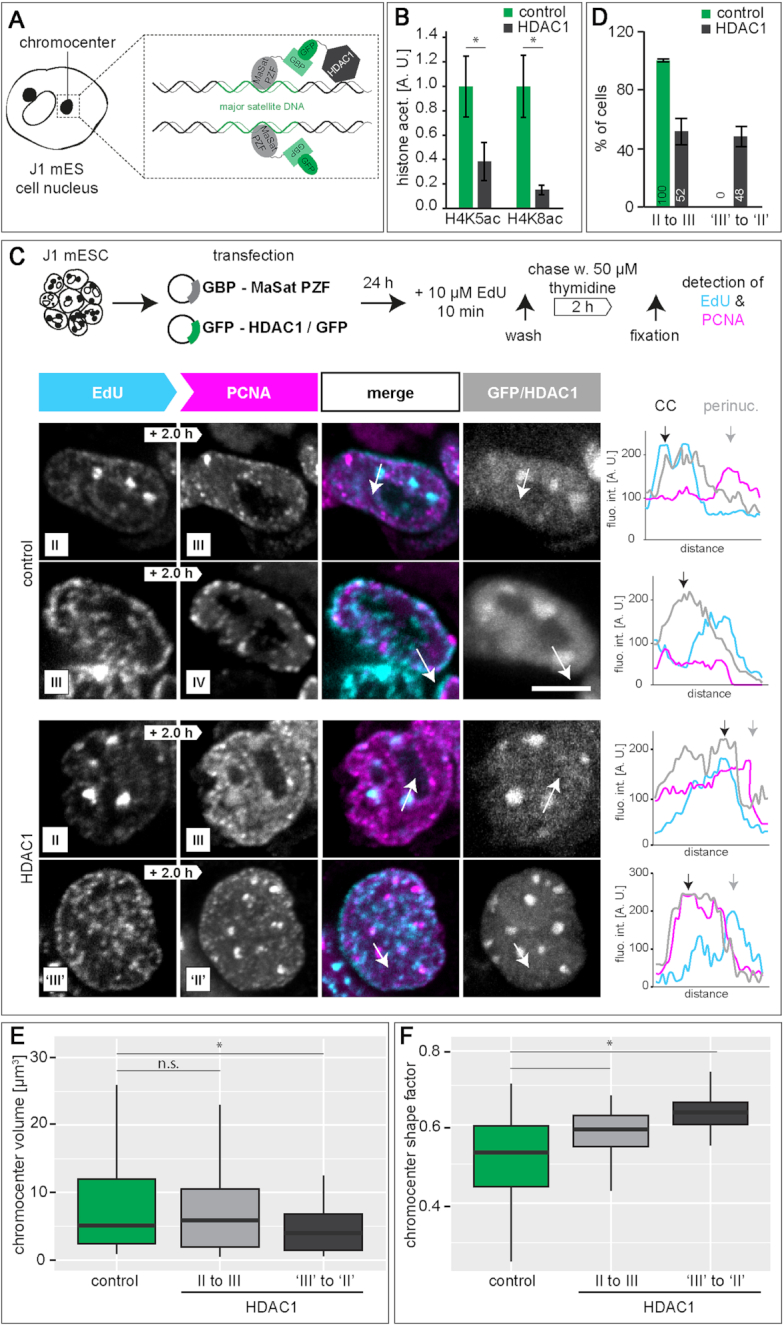
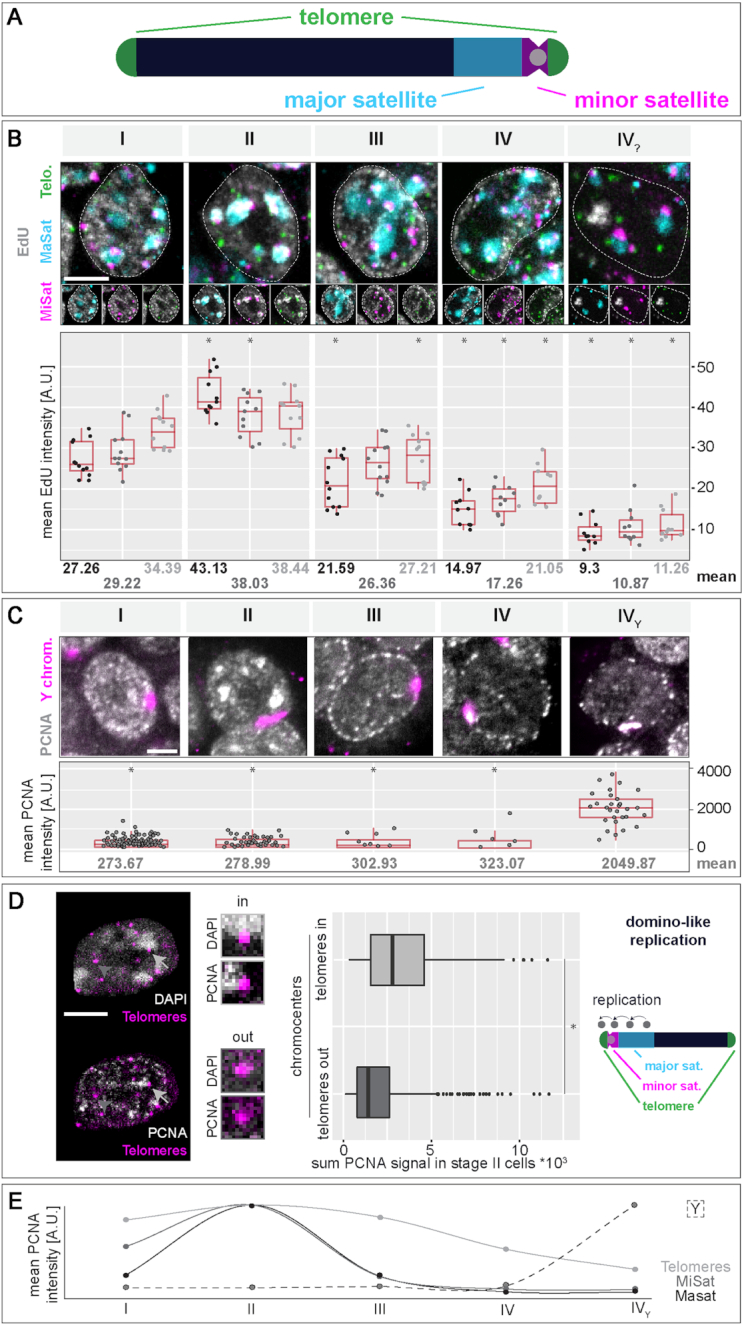
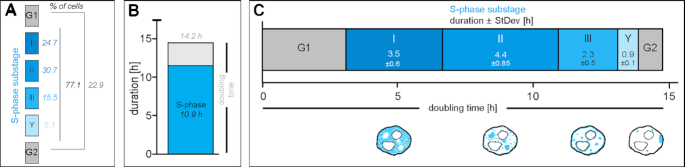
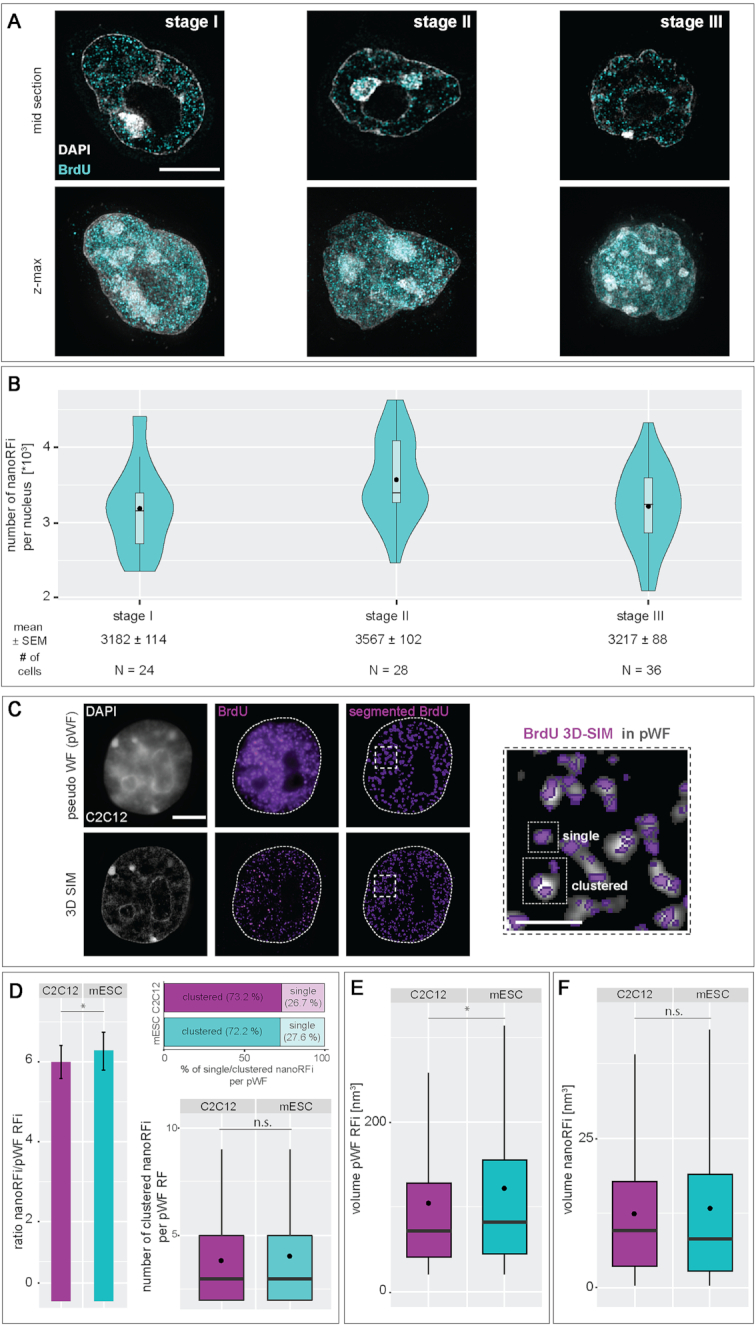
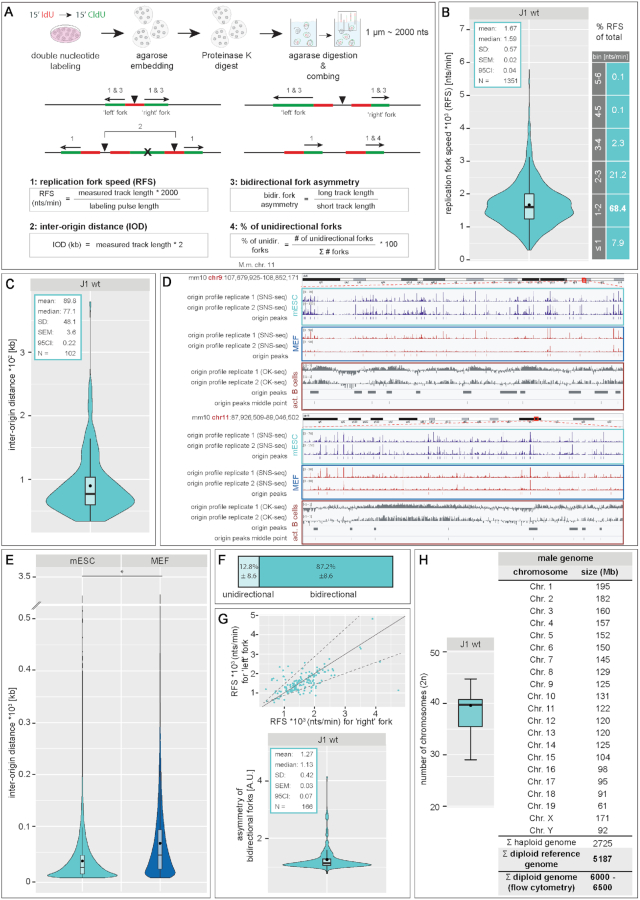
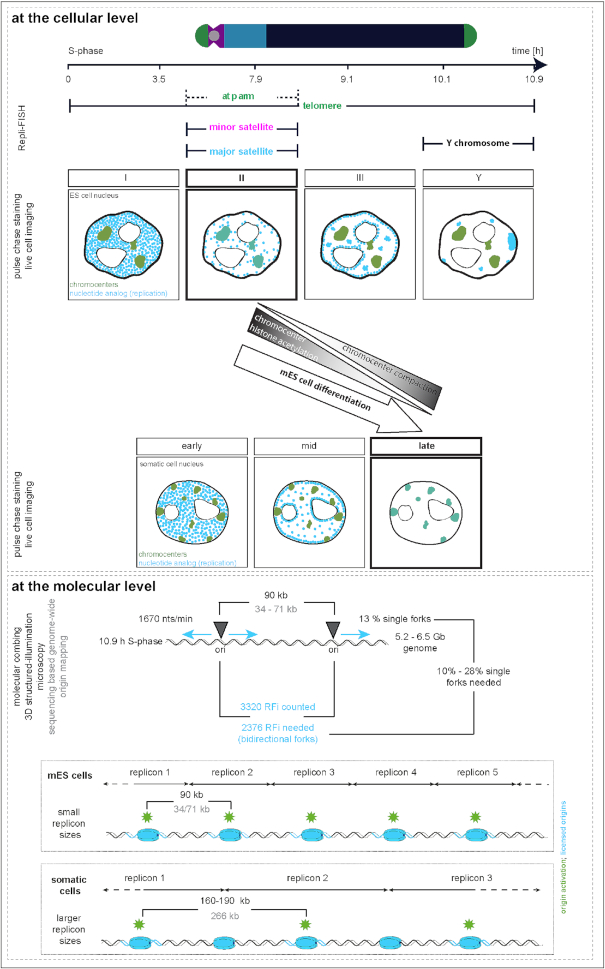
To ensure error-free duplication of all (epi)genetic information once per cell cycle, DNA replication follows a cell type and developmental stage specific spatio-temporal program. Here, we analyze the spatio-temporal DNA replication progression in (un)differentiated mouse embryonic stem (mES) cells. Whereas telomeres replicate throughout S-phase, we observe mid S-phase replication of (peri)centromeric heterochromatin in mES cells, which switches to late S-phase replication upon differentiation. This replication timing reversal correlates with and depends on an increase in condensation and a decrease in acetylation of chromatin. We further find synchronous duplication of the Y chromosome, marking the end of S-phase, irrespectively of the pluripotency state. Using a combination of single-molecule and super-resolution microscopy, we measure molecular properties of the mES cell replicon, the number of replication foci active in parallel and their spatial clustering. We conclude that each replication nanofocus in mES cells corresponds to an individual replicon, with up to one quarter representing unidirectional forks. Furthermore, with molecular combing and genome-wide origin mapping analyses, we find that mES cells activate twice as many origins spaced at half the distance than somatic cells. Altogether, our results highlight fundamental developmental differences on progression of genome replication and origin activation in pluripotent cells.


Figures

Figure 1.
Figure 1.
DNA replication dynamics in mouse embryonic stem cells. (A) Experimental setup of a live cell experiment to determine the in vivo spatio-temporal progression of DNA replication in J1 mES cells. Cells were transfected with plasmids encoding mRFP-PCNA (magenta) and GFP-tagged polydactyl zinc finger protein (PZF) specifically binding to major satellite repeats (MaSat-GFP, green) fusion constructs to mark ongoing DNA replication and pericentromeric heterochromatin (chromocenters), respectively. Imaging was performed for 24 h with 30 min intervals. Representative spinning disk confocal images show the cell cycle progression of a representative mES cell and S-phase was further subdivided into five main replication patterns (I–IV?). The arrowhead in the IV? stage marks a prominent accumulation of replication signals observed at the end of S-phase. (B) Schematic representation of acrocentric mouse chromosome clustering in mES cell nuclei. At the chromosomal level, constitutive heterochromatin major satellite repeats (green) flank the centromere (grey) and in interphase nuclei, pericentromeric DNA from different chromosomes clusters to chromocenters. (C) Experimental setup of a pulse-chase experiment to determine the spatio-temporal progression of DNA replication in mouse J1 ES cells. Asynchronously growing mES cell cultures were pulse labeled with the nucleotide analog EdU, followed by various thymidine chase periods (white arrows) and fixation. EdU, i.e. nascent DNA during the first pulse labeling (cyan), and endogenous PCNA, i.e. ongoing replication at the time point of fixation (magenta), were (immuno)fluorescently detected and allowed the identification and the temporal order classification of five main replication patterns in mouse J1 ES cells. Representative spinning disk confocal images of G1 to S-phase, S-phase substage transitions (I–IV?) and S-phase to G2 progression are shown. The arrowheads in the IV? stage mark a prominent accumulation of replication signals observed at the end of S-phase. (D) Line profile analysis of PCNA fluorescence intensities within one chromocenter in a stage II cell. (E) Schematic summary of the five replication patterns observed in mES cells. Replication signals are shown in cyan, pericentromeric heterochromatin in green and replicating chromocenters (stage II) are marked in dark cyan. Table summarizing the significant RFi features of the five S-phase substages. Grey areas in stage III and IV S-phase schematic cells represent the nuclear periphery segmented to determine the percentage of the latter covered with RFi. The width of this area (*) corresponds to the diameter of stage III peripheral RFi (0.44 ± 0.13 μm). All experiments were done in at least three independent biological replicates. Detailed statistics are summarized in Supplementary Tables S7 and S11. Scale bars = 5 μm. Dotted lines represent cell contours.
Figure 2.
Figure 2.
DNA replication dynamics in differentiated mouse embryonic stem cells. (A) Experimental setup of pulse-chase experiments in differentiated mouse J1 ES cells. Naïve pluripotent mES cells were cultured in 2i (two inhibitors (PD032591 and CHIR99021)) and LIF (leukemia inhibitory factor) containing medium. On day 0 of the differentiation, cells were seeded in 2i and LIF deficient medium containing retinoic acid. Cells were pulse labeled with EdU, chased with thymidine for 2 h and fixed at day 0 and from day 3 to day 7 of the differentiation. (B) Overlay of phase contrast (Ph) and DAPI channels, showing changes in cellular morphology during mES cell differentiation. (C) Immunofluorescent detection of the pluripotency markers Oct3/4 and Sox2 in (un)differentiated mES cells. Representative spinning disk confocal images of in situ stainings were imaged and the mean value of the fluorescence signal was plotted as a ratio to the undifferentiated (day 0) cells. (D) Representative spinning disk confocal images of pulse chased mES cells revealed replication timing switch to late replicating chromocenters at day 7 of differentiation. Very early (Sve) to early S-phase (Se), early to mid (Sm), mid to late (Sl) and late S-phase to G2 transitions are shown. (E) To analyze the replication timing switch of chromocenters in differentiated mES cells, the sum value of EdU fluorescence signal within chromocenters (masked according to DAPI channel) were measured in spinning disk confocal images of cells (from D) within early, mid and late S-phase for the EdU pulse. An increase in signal overlap of chromocenters and replication signal is observed during late S-phase in differentiated mES cells. (F) Schematic summary and corresponding confocal images of the three main replication patterns observed in differentiated mES cells. Replication signals are shown in cyan, pericentromeric heterochromatin in green (scheme) and replicating chromocenters (late) are marked in dark cyan. (G–H) Experimental setup for the analysis of histone modification accumulation at pericentromeric heterochromatin. (Un)differentiated mES cells and primary mouse ear fibroblasts were pulsed with EdU to identify S-phase cells and histone modifications were immunofluorescently detected. Regions of interest (ROI) were manually drawn in G1 phase cells and histone modification levels were measured. Shown are the accumulations of H4K8ac, H3K9ac and H3K9m3 at chromocenters (ratio of mean histone modification values at chromocenters and mean histone modification values in the nucleoplasm ± StDev). Scale bars = 5 μm. *P < 0.05. All experiments were done in at least two independent biological replicates. All boxes and whiskers represent 25–75 percentiles and 1.5 times the IQD (inter-quartile distance), respectively and the center line depicts the median (Supplementary Figure S7). Detailed statistics are summarized in Supplementary Table S8. Dotted lines represent cell contours.
Figure 3.
Figure 3.
HDAC1 deacetylase targeting to chromocenters in mouse embryonic stem cells. (A) Schematic representation of the targeting strategy to recruit HDAC1 to chromocenters. In a targeted state, the fusion protein composed of the major satellite binding MaSat PZF (MaSat) and GFP binding protein (GBP) recruits the GFP-HDAC1 fusion protein to chromocenters via binding of the GBP to GFP. In the control experiments, only GFP was recruited to chromocenters. (B) Histone acetylation (H4K5ac and H4K8ac) levels in (HDAC1) targeted and GFP control cells (mean ± StDev). (C) 24 h after double transfection of J1 mES cells, cells were pulse chased as described in Figure 1. Representative spinning disk confocal images from GFP control cells showing S-phase substage transitions from stage II to III and from stage III to IV and from HDAC1 targeted cells showing transitions form stage II to III and from stage ‘III’ to ‘II’. Line profiles represent fluorescence intensities along the arrow marked in the images. CC = chromocenter, perinuc. = perinucle(ol)ar. (D) Percentages of cells representing stage II to III and stage ‘III’ to ‘II’ transitions in control and targeted cells (mean ± StDev). (E-F) Chromocenter volume (E) and chromocenter shape factor (F) in control cells and cells showing stage II to III and stage ‘III’ to ‘II’ transitions in HDAC1 targeted cells. *P < 0.05 and n.s. = non-significant. Detailed statistics are summarized in Supplementary Table S8. Scale bar = 5 μm.
Figure 4.
Figure 4.
Replication timing of (sub)-chromosomal structures in mouse embryonic stem cells. (A) Schematic representation of a mouse acrocentric chromosome. Centromeric satellite regions (MiSat) and flanking pericentromeric DNA (MaSat) are depicted in magenta and cyan, respectively and telomeres are shown in green. (B) Tandem repeat elements were co-visualized with EdU (labeling of nascent DNA, grey) in mES cell interphase nuclei by triple FISH hybridization. Cells were classified into S-phase stages I to IV? according to their EdU pattern, mean EdU intensities within the marked elements were measured as described in Supplementary Figure S3 and plotted. Mean values are indicated below each plot. (C) Analysis of Y chromosome FISH in combination with PCNA staining was performed as in (B). (D) Analysis of telomere replication timing in J1 mES cells co-stained for PCNA and telomeres. Chromocenters of S-phase stage II cells were segmented according to the DAPI staining, and sum values of PCNA fluorescent intensity were measured within segmented telomeres located in close proximity to chromocenters (light grey arrows, ‘telomeres in chromocenters’) and within telomeres located on the long arm of the chromosome (not in proximity of chromocenters, dark grey arrow heads, ‘telomeres out of chromocenters’). Replication of chromocenter near telomeres within S-phase stage II hints towards a domino-like replication model with a sequential order of replication of adjacent chromosomal regions (MaSat/MiSat to telomeres on the short chromosome arm). (E) Summary of the replication timing of tandem repeat elements and the Y chromosome in mES cells. (Peri)centromeric DNA regions (MaSat and MiSat) are mainly replicated within the first half of S-phase (stage II), telomeres are replicated throughout S-phase and the Y chromosome marks the end of S-phase (stage Y). Dotted lines represent cell contours. Boxplots are as in Figure 2 and Supplementary Figure S7. Scale bar = 5 μm. Detailed statistics are summarized in Supplementary Table S10. *P < 0.05 (calculated among each elements against the respective stage I value (B) or against stage Y in C).
Figure 5.
Figure 5.
Cell cycle characteristics of mouse embryonic stem cells. (A) The cell cycle distribution within an asynchronous mES cell population was analyzed by labeling the cells with EdU and counting the number of S-phase cells (EdU positive). Around 77% of the cells are in S-phase and additionally, the percentage of cells within S-phase substages (I–Y) is detailed. (B) Growth curve analysis over 5 days revealed a population doubling time of around 14 h for mouse J1 ES cells. Together with the percentage of replicating cells from (A), an approximate S-phase duration for mES cells of about 10.9 h was calculated. (C) From the fraction of cells within every S-phase substage (I–Y, A) and the total S-phase duration (B), approximate durations of the individual substages were calculated (mean ± StDev). All experiments were done in at least three independent biological replicates. Detailed statistics are summarized in Supplementary Table S11.
Figure 6.
Figure 6.
3D quantification and analysis of replication foci throughout S-phase in mouse embryonic stem cells. (A) Mid sections and maximum intensity z-projections (z-max) of 3D structured illumination microscopy (3D-SIM) images of mouse ES cells representative of the first three S-phase patterns (I–III) are shown. (B) Numbers (mean ± SEM) of nano replication foci (nanoRFi) quantified as described in Supplementary Figure S4 are plotted separately for each of the three S-phase patterns. N indicates the number of cells analyzed. (C) At lower optical resolution, replication signals appear as larger foci (pseudo wide-field (pWF) foci). These can be resolved to a number of smaller foci when imaged by super-resolution microscopy. Shown are representative pWF (upper row) and the respective 3D SIM images (lower row) of the cell nucleus of a mouse myoblast, the unsegmented (middle column) and segmented (right column) BrdU replication signals. The pWF replication foci were segmented as described in Supplementary Figure S5 and used to demarcate a distinct volume of DNA in which the number of nano replication foci (nanoRFi) was quantified (magnified inset). nanoRFi are considered as ‘clustered’ if one pWF focus contains more than one nanoRFi. (D) Results of cluster analysis of nanoRFi within the distinct volume of a pWF replication focus are shown. RFi ratios from super-resolution versus pseudo-widefield microscopy (barplot ± Stdev) and analysis of the number of clustered nanoRFi in individually segmented pWF foci (boxplot) in early S-phase mouse ES and myoblast (C2C12) cells are shown. Percentages of single and clustered nanoRFi are depicted. (E-F) Volumes of the segmented pWF (E) and 3D-SIM (F) nano replication foci (nanoRFi) are shown. Detailed statistics are summarized in Supplementary Table S12. Boxplots are as in Figure 2. * P < 0.05 and n.s. = non-significant. Black dots within violin/box plots represent mean values. Scale bar = 5 and 2.5 μm for main graphs and magnified regions, respectively. Brightness and contrast of 3D-SIM images were adjusted for every image depicted. Dotted lines represent cell contours.
Figure 7.
Figure 7.
DNA replication fiber and genome size analysis in mouse embryonic stem cells. (A) Schematic outline of the experimental setup for DNA fiber analysis. mES cells were sequentially labeled with IdU and CldU for 15 min, harvested and embedded in agarose. After a proteinase K digestion step, agarose was digested and high molecular weight naked DNA was stretched on silanized glass coverslips. Nucleotide analogs and single stranded DNA (ssDNA) were immunofluorescently detected. (B–E) The length of fluorescent tracks of the second pulse (CldU) were measured (1 μm ∼ 2000 nucleotides, Supplementary Figure S6) and the mean replication fork speed (RFS, (B)), inter-origin distance (IOD, (C)), percentage of unidirectional forks (F) and asymmetry of bidirectional forks (G) were calculated as indicated in (A). Additionally, the percentages of forks within a given range of RFS are indicated in (B). For comparison of the RFS of the ‘left’ and ‘right’ fork of a bidirectional fork, RFS values were plotted in a scatterplot. The solid grey line represents the linear relation x = y and dotted lines represent thresholds allowing for a 35% (± StDev calculated for the asymmetry factor) difference between lengths of the two forks. (D) Visual representation of origin mapping in two arbitrarily selected regions (mouse (Mus musculus, mm10) chromosomes 9 and 11). SNS-seq origin profiles and identified origins in mES and MEF cells are shown. OK-seq origin profiles in activated (act.) B cells, called peaks along with the middle point of each peak are represented. Replication profile scale is indicated in the upper left corner. The comparison between identified and clustered origin peaks is shown in Supplementary Figure S20. (E) IOD distributions based on the genome-wide origin maps in mES cells and mouse embryonic fibroblast (MEF) are shown (SNS-seq). The sequencing datasets used for the analysis include two independent replicates of origin mapping for each condition. (H) Ploidy of J1 mES cells was determined via karyotype analysis of metaphase spreads. For genome size calculation, the sizes of individual mouse chromosomes (19 autosomes + X and Y chromosomes) were retrieved from the Genome Reference Consortium database. Additionally, genome sizes measured by flow cytometry are indicated. Boxplots/violinplots are as in Figure 2 and Supplementary Figure S7. Statistical details are depicted in the plots or summarized in Supplementary Table S13. All experiments were done in at least two independent biological replicates. Black dots within box/violin plots represent mean values. * P < 0.05. Scale bar = 5 μm.
Figure 8.
Figure 8.
Graphical summary of the cellular and molecular DNA replication characteristics in mouse embryonic stem cells. At the cellular level, DNA replication is visible as distinct replication foci with a dynamic spatio-temporal organization. In mES cells, three different replication patterns are observed during the ∼11 h of S-phase (time progression arrow not scaled). (Sub)chromosomal elements were found to replicate at specific time points during genome duplication. While telomeres located at the long arm of the chromosome replicate throughout S-phase, the ones capping the q arms show significant increase in replication during S-phase stage II. In contrast to somatic mouse cells, (peri)centromeric DNA (marked in green) replicates during mid S-phase (stage II). The Y chromosome is replicated synchronously at the end of S-phase (stage Y) in pluripotent as well as in differentiated cells. Replication timing of pericentromeric DNA switches from early/mid to late S-phase upon mES cell differentiation, which correlates with chromocenter compaction and decreased histone acetylation. At the molecular level, mES cell replicons are characterized by short inter-origin distances of about 90 kb. Replication forks progress at 1.7 nucleotides per minute to replicate the 5.2 Gb mouse genome in about 11 h. Replication is initiated from around 3320 replication foci (RFi), although theoretically ∼2380 bidirectional mES cells are sufficient for genome duplication within the timeframe of S-phase. Hence, from the 3320 sites observed, 28% correspond to single forks and the remaining to bidirectional forks. This is within the range of (13%) single forks observed in DNA fiber analysis. A characteristic arising from the molecular parameters of DNA replication in mouse pluripotent cells are smaller replicon sizes in mES cells relative to somatic cells. Along a given segment of chromosomal DNA carrying multiple licensed origins of replication, mES cells initiate DNA replication from double the number of origins compared to somatic cells. This results in more but smaller replicons and concomitantly smaller inter-origin distances (∼90 kb in mES cell and 160–190 kb in mouse/human somatic cells).

Similar articles

Cited by

References

    1. Dimitrova D.S., Gilbert D.M.. The spatial position and replication timing of chromosomal domains are both established in early G1 phase. Mol. Cell. 1999; 4:983–993. - PubMed
    1. Hyrien O., Marheineke K., Goldar A.. Paradoxes of eukaryotic DNA replication: MCM proteins and the random completion problem. BioEssays. 2003; 25:116–125. - PubMed
    1. Fragkos M., Ganier O., Coulombe P., Mechali M.. DNA replication origin activation in space and time. Nat. Rev. Mol. Cell Biol. 2015; 16:360–374. - PubMed
    1. Parker M.W., Botchan M.R., Berger J.M.. Mechanisms and regulation of DNA replication initiation in eukaryotes. Crit. Rev. Biochem. Mol. Biol. 2017; 52:107–144. - PMC - PubMed
    1. Chagin V.O., Stear J.H., Cardoso M.C.. Organization of DNA replication. Cold Spring Harb. Perspect. Biol. 2010; 2:a000737. - PMC - PubMed

Publication types

Substances