

Adjustment of the PIF7-HFR1 transcriptional module activity controls plant shade adaptation
- PMID: 33264441
- PMCID: PMC7780144
- DOI: 10.15252/embj.2019104273
Adjustment of the PIF7-HFR1 transcriptional module activity controls plant shade adaptation
Abstract
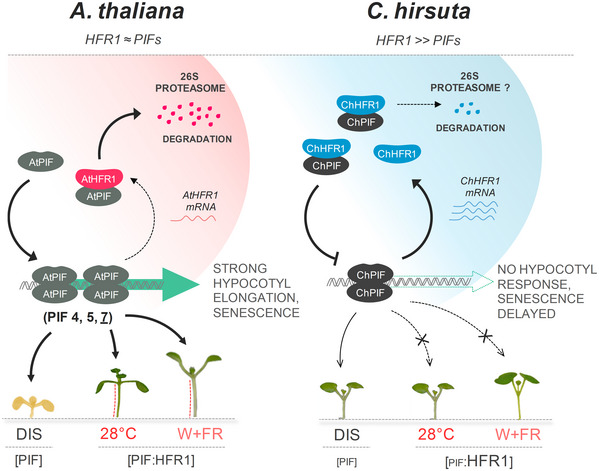
Shade caused by the proximity of neighboring vegetation triggers a set of acclimation responses to either avoid or tolerate shade. Comparative analyses between the shade-avoider Arabidopsis thaliana and the shade-tolerant Cardamine hirsuta revealed a role for the atypical basic-helix-loop-helix LONG HYPOCOTYL IN FR 1 (HFR1) in maintaining the shade tolerance in C. hirsuta, inhibiting hypocotyl elongation in shade and constraining expression profile of shade-induced genes. We showed that C. hirsuta HFR1 protein is more stable than its A. thaliana counterpart, likely due to its lower binding affinity to CONSTITUTIVE PHOTOMORPHOGENIC 1 (COP1), contributing to enhance its biological activity. The enhanced HFR1 total activity is accompanied by an attenuated PHYTOCHROME INTERACTING FACTOR (PIF) activity in C. hirsuta. As a result, the PIF-HFR1 module is differently balanced, causing a reduced PIF activity and attenuating other PIF-mediated responses such as warm temperature-induced hypocotyl elongation (thermomorphogenesis) and dark-induced senescence. By this mechanism and that of the already-known of phytochrome A photoreceptor, plants might ensure to properly adapt and thrive in habitats with disparate light amounts.
Keywords: Cardamine hirsuta; HFR1; PIFs; shade avoidance; shade tolerance.
© 2020 The Authors.
Conflict of interest statement
The authors declare that they have no conflict of interest.
Figures
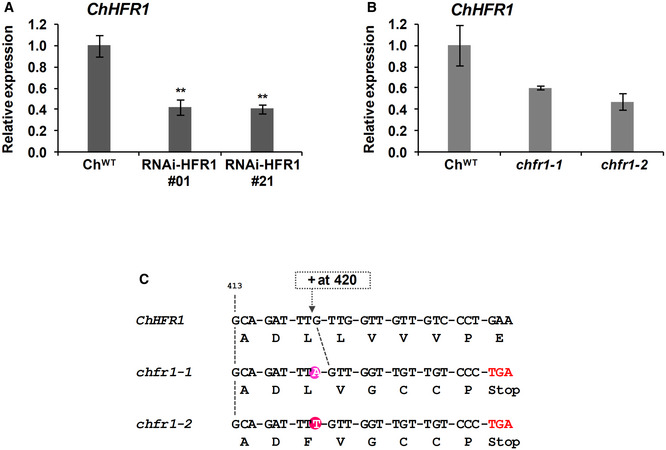
- A, B
Relative expression levels of ChHFR1 gene, normalized to EF1α in ChWT, (A) two RNAi‐HFR1 lines (#01 and #21) and (B) the two chfr1 mutants of C. hirsuta. Seedlings were grown for 7 days in W. Expression values are the mean ± SE of three independent biological replicates relative to ChWT. Asterisks mark significant differences (Student t‐test: **P‐value < 0.01) relative to ChWT.
- C
The two identified chfr1‐1 and chfr1‐2 mutants have one nucleotide insertion at position 420 of the ChHFR1 ORF, which leads to a frame shift and a premature stop codon.
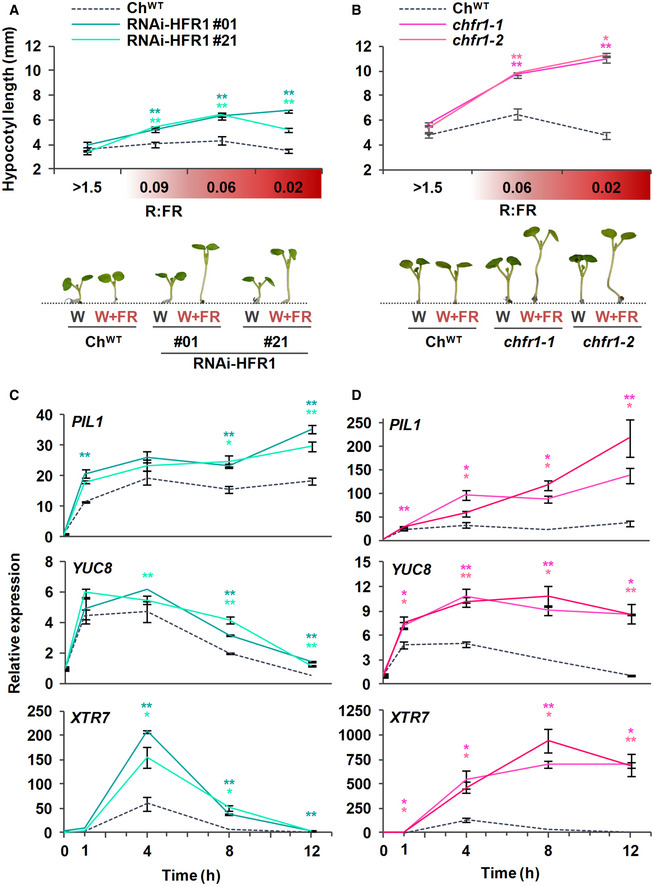
- A, B
Hypocotyl length of ChWT, (A) RNAi‐ChHFR1 transgenic, and (B) chfr1 mutant seedlings grown under different R:FR. Seedlings were grown for 7 days in continuous W (R:FR > 1.5) or for 3 days in W then transferred to W supplemented with increasing amounts of FR (W + FR) for 4 more days, producing various R:FR. Aspect of representative 7‐day‐old ChWT, RNAi‐HFR1 and chfr1‐1 seedlings grown in W or W + FR (R:FR, 0.02), as indicated, is shown in lower panel.
- C, D
Effect of W + FR exposure on the expression of PIL1, YUC8, and XTR7 genes in seedlings of ChWT, (C) RNAi‐HFR1, and (D) chfr1 mutant lines. Expression was analyzed in 7‐day‐old W‐grown seedlings transferred to W + FR (R:FR, 0.02) for 0, 1, 4, 8, and 12 h. Transcript abundance is normalized to EF1α levels.
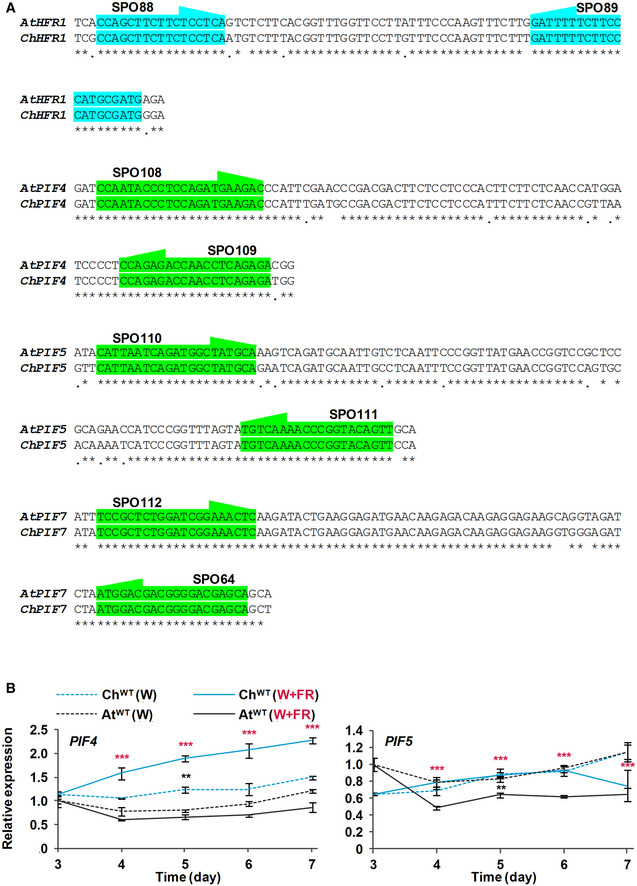
Location of shared primers and amplicons used for comparison of expression levels by RT‐qPCR between species.
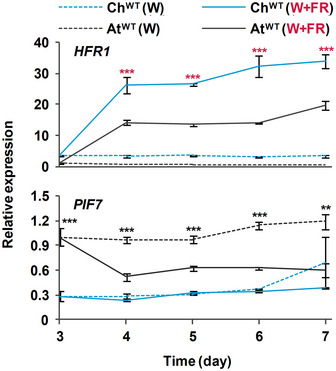
Transcript abundance of PIF4 and PIF5, normalized to YLS8, SPC25, and EF1α in ChWT and AtWT grown as in Fig 2. Expression values are the means ± SE of three independent biological replicates relative to the data of AtWT grown in continuous W at day 3. Asterisks mark significant differences (2‐way ANOVA: **P‐value < 0.01, ***P‐value < 0.001) between ChWT and AtWT when grown under W (black asterisks) or W + FR (red asterisks).
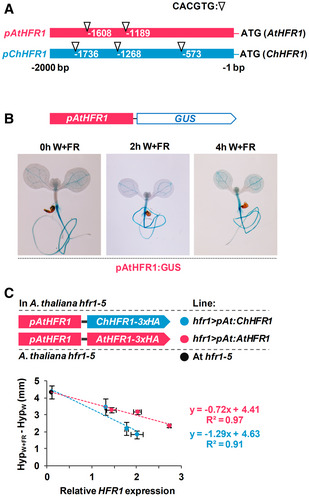
Cartoon of HFR1 promoters from A. thaliana (pAtHFR1) and C. hirsuta (pChHFR1). These promoters cover 2,000 bp from the beginning of the translation start of the two HFR1 genes. The positions of G‐boxes (CACGTG) are indicated with arrows.
GUS staining of representative A. thaliana seedlings expressing GUS under the pAtHFR1 (line #03). Seven‐day‐old W‐grown seedlings were treated with W + FR for the indicated amount of time.
Correlation between HypW+FR‐HypW (means ± SE of at least four biological replicates, data shown in Fig 3C) and relative levels of ChHFR1 or AtHFR1 expression (means ± SE of three biological replicates, data shown in Fig 3B). The estimated regression equations and the R 2 values are shown for each plot.
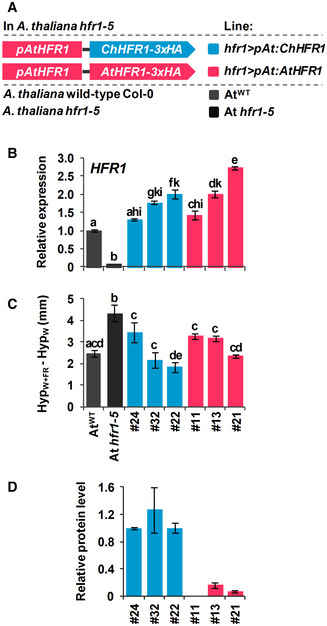
Cartoon of constructs containing ChHFR1 or AtHFR1 under the HFR1 promoter of Arabidopsis thaliana (pAtHFR1) used to complement hfr1‐5 mutant of A. thaliana (At hfr1‐5).
Relative expression of HFR1 in seedlings of AtWT, At hfr1‐5, hfr1>pAt:ChHFR1 (in blue), and hfr1>pAt:AtHFR1 (in red) lines grown under W + FR (R:FR, 0.02). Expression values are the means ± SE of three independent biological replicates relative to the data of 7 days old AtWT. Transcript abundance is normalized to UBQ10 levels.
Elongation response of seedlings of the indicated lines grown for 7 days in continuous W or 2 days in W then transferred for 5 days to W + FR (R:FR, 0.02). The mean hypocotyl length in W (HypW) and W + FR (HypW+FR) of at least four biological replicates was used to calculate HypW+FR‐HypW. Error bars represent SE.
Relative HFR1 protein levels in seedlings of the indicated lines, normalized to actin protein levels, are the means ± SE of three independent biological replicates relative to hfr1>pAt:ChHFR1 line #22 that is taken as 1. Seedlings were grown for 7 days in continuous W (~ 20 µmol/m2·s1) after which they were incubated for 3 h in high W (~ 100 µmol/m2·s1) and transferred to W + FR (R:FR, 0.06) for 3 h.
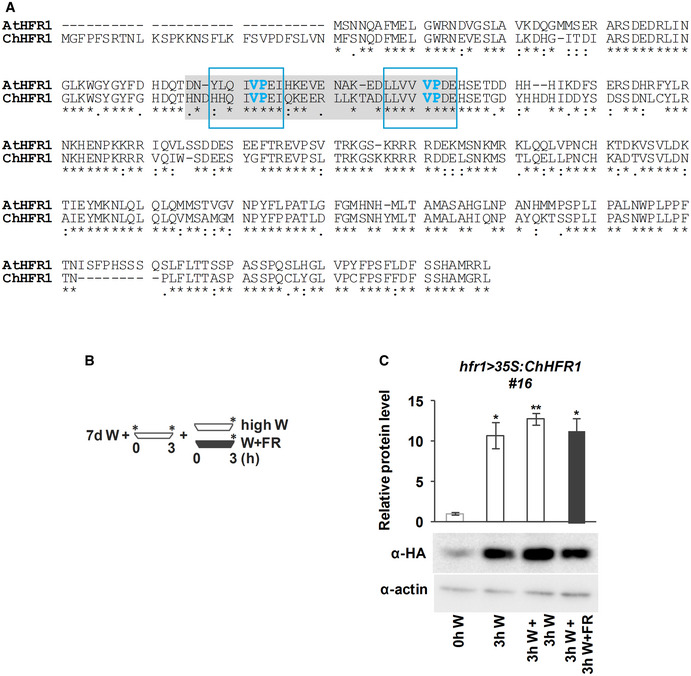
Alignment of AtHFR1 and ChHFR1 protein sequences. Putative COP1 interacting motifs, defined in AtHFR1, are highlighted with a light gray box. VP motifs are highlighted with blue letters. Amino acid sequences inside the blue line rectangles correspond to the synthetic AtHFR1, ChHFR1, and At/ChHFR1 VP peptides used in the microscale thermophoresis assays (Appendix Table S3).
Cartoon representing the light treatments given to seedlings to estimate relative HFR1‐3xHA levels. Seedlings grown for 7 days in low W (~ 20 µmol/m2·s1, R:FR ≈ 6.4) were first moved to high W (~ 100 µmol/m2·s1, R:FR ≈ 3.9) for 3 h and then either transferred to high W (control) or high W + FR (R:FR ≈ 0.06) for 3 h. Seedling samples were collected at the time points indicated with asterisks.
Relative HFR1‐3xHA protein levels of hfr1>35S:ChHFR1 seedlings (line #16) grown as indicated in B, with a representative immunoblot in a lower panel. Relative protein levels are the mean ± SE of three independent biological replicates relative to the data point of 0 h in high W (0 h W). Asterisks mark significant differences in protein levels (Student t‐test: **P‐value < 0.01; *P‐value < 0.05) relative to the 0 h W value.
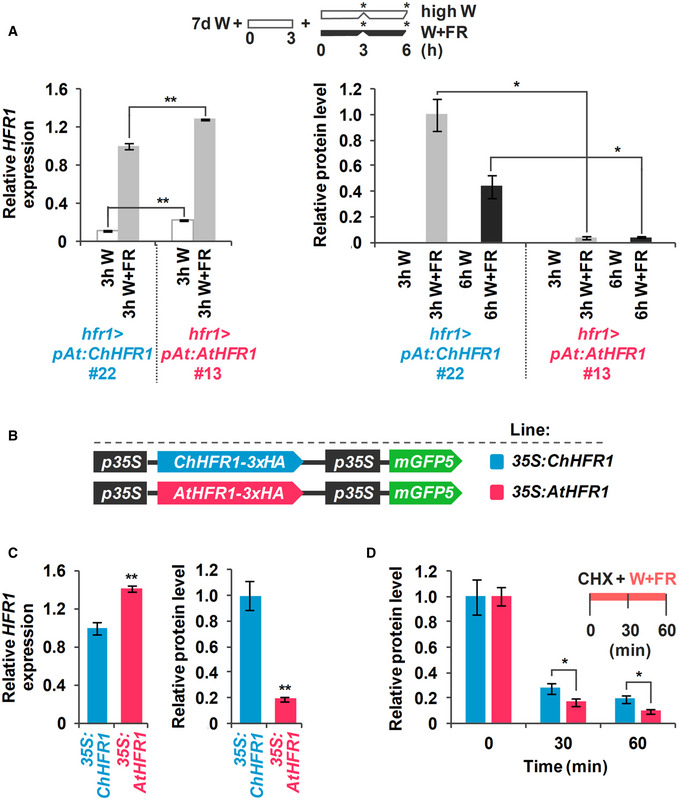
Expression of HFR1 and protein levels of HFR1‐3xHA in seedlings of hfr1>pAt:ChHFR1 (line #22) and hfr1>pAt:AtHFR1 (line #13). Seedlings were grown for 7 days in continuous W (~ 20 µmol/m2·s1) after which they were incubated for 3 h in high W (~ 100 µmol/m2·s1) and then either kept at high W or transferred to W + FR (R:FR, 0.06) for 3 or 6 h, as indicated in the cartoon at the top. Relative HFR1 transcript levels, normalized to UBQ10, are the means ± SE of three independent biological replicates relative to hfr1>pAt:ChHFR1 #22 grown for 3 h under W + FR. Relative protein levels, normalized to actin, are the means ± SE of three independent biological replicates relative to hfr1>pAt:ChHFR1 #22. Samples were collected at data points marked in the cartoon with asterisks.
Cartoon of constructs containing ChHFR1 or AtHFR1 under the 35S promoter used for transient expression of transgenes in N. benthamiana leaves.
Relative HFR1 transcript levels transiently expressed in tobacco leaves, normalized to the GFP, are the means ± SE of three independent biological replicates (left). Relative HFR1 protein levels, normalized to the GFP levels, are the means ± SE of four independent biological replicates (right). In (A) and (C), asterisks mark significant differences (Student's t‐test: *P‐value < 0.05, **P‐value < 0.01) between the indicated pairs.
Degradation of ChHFR1 (35S:ChHFR1) and AtHFR1 (35S:AtHFR1) in tobacco leaf disks treated with cycloheximide (CHX, 100 µM) for the indicated times. Tobacco plants were kept under high W (~ 200 µmol/m2·s1) for 3 days after agroinfiltration and then leaf circles were treated with W + FR (R:FR, 0.2) and CHX. Relative HFR1 protein levels (ChHFR1, blue bars; AtHFR1, red bars), normalized to the GFP levels, are the means ± SE of four biological replicates relative to data point 0, taken as 1 for each line. Asterisks mark significant differences (2‐way ANOVA: *P‐value < 0.05) between ChHFR1 and AtHFR1 at the same time point.
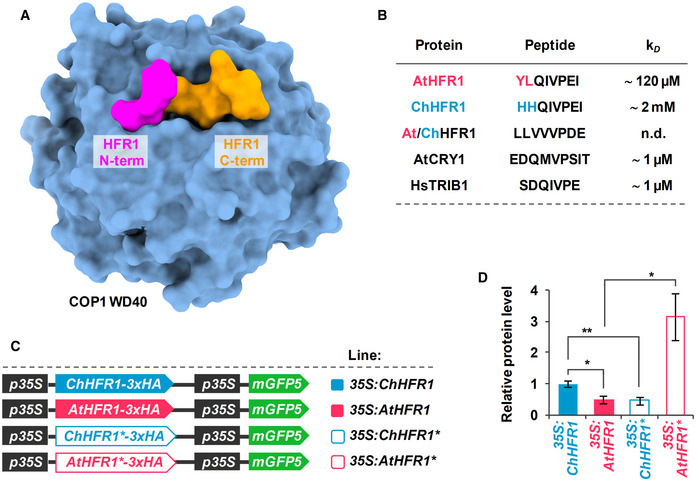
Overview of the COP1 WD40‐AtHFR1 complex (PDB ID 6QTV). The COP1 WD40 domain and the AtHFR1 VP peptide are shown in surface representation and colored in blue and orange, respectively. The N‐terminus of HFR1 VP peptide, the amino acid of which differs between AtHFR1 and ChHFR1, is highlighted in magenta.
Table summaries of the microscale thermophoresis binding assay (see Fig EV5). The sequence of the respective synthetic peptides is indicated.
Cartoon of constructs containing ChHFR1, AtHFR1, ChHFR1* and AtHFR1* derivatives under the 35S promoter used for transient expression of transgenes in N. benthamiana leaves.
Relative HFR1 protein levels, normalized to the GFP levels, are the means ± SE of four independent biological replicates. Asterisks mark significant differences (Student t‐test: *P‐value < 0.05, **P‐value < 0.01) between the indicated pairs.
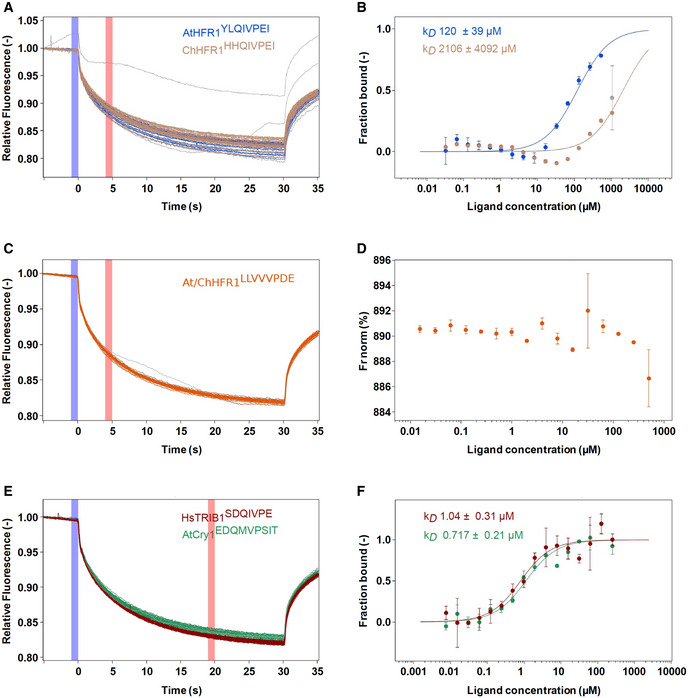
- A–F
Raw MST traces and analysis of AtCOP1 WD40 with different peptides in triplicates (duplicates for At/ChHFR1 VP). The concentration of AtCOP1 WD40 is fixed at 0.15 μM mixed with 16 serially diluted peptide concentrations at 1:1 ratio. Panels A, C, and E show the normalized MST traces. The blue box area illustrates the fluorescence before activation of the infrared (IR) laser and red box area illustrates average fluorescence after activation of the IR laser. Average values ± SD (error bars) were subsequently used for fluorescence normalization. kD fit displaying fraction bound as a function of ligand concentration is shown in adjacent right panels B, D, and F. (A) Raw MST traces for AtHFR1 (in blue) and ChHFR1 (in light‐brown) VP peptides. Individual concentrations that showed slight aggregation or precipitation are shown in gray and were excluded from the kD fit calculation. (B) Fitted data over a concentration range from 0.032 to 500 μM for AtHFR1 VP (blue dots) and 0.032 to 1,000 μM for ChHFR1 VP (light‐brown dots) were used to derive the corresponding dissociation constant kD. (C) Raw MST traces for At/ChHFR1 VP peptide (in orange). One concentration that showed slight precipitation or aggregation is shown in gray. A concentration range of 0.0154 to 506 μM was used for the At/ChHFR1 VP. (D) No kD was determined, as no binding between COP1 WD40 and the At/ChHFR1 VP peptide (orange dots) was detected. (E) A concentration range from 0.0076 to 250 μM for HsTRIB1 (in red) and AtCRY1 (in green) peptides was used. Raw MST traces show no aggregation or precipitation effects during this binding. One AtCRY1 VP outlier is shown in gray. (F) The kD for HsTRIB1 (brown dots) and AtCRY1 (green dots) VP peptides was calculated using the normalized traces.
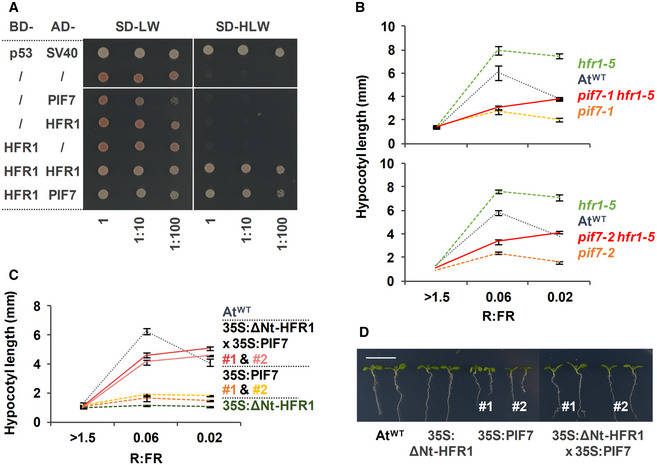
- A
Y2H growth assay showing the interaction between AtHFR1 and AtPIF7. The BD‐ and the AD‐derivative constructs used in the assay are shown on the left side of the panel. SD‐LW or SD‐HLW refer to the selective medium (plated as drops in dilutions of 1, 1:10, and 1:100) indicative of transformed cells or interaction between the hybrid proteins, respectively. Truncated forms of murine p53 (BD‐fused) and SV40 large T‐antigen (AD‐fused), known to interact, were used as a positive control. Empty vectors (/) were used as negative controls.
- B, C
Hypocotyl length of seedlings of AtWT, (B) pif7‐1, hfr1‐5, pif7‐1 hfr1‐5 (top graph), pif7‐2, hfr1‐5, and pif7‐2 hfr1‐5 (bottom graph) mutants, and (C) transgenic 35S:GFP‐ΔNt‐HFR1 (35S:ΔNt‐HFR1), two lines of 35S:PIF7‐CFP (35S:PIF7 #1 and #2), and 35S:GFP‐ΔNt‐HFR1 35S:PIF7‐CFP double transgenic (35S:ΔNt‐HFR1 × 35S:PIF7 #1 and #2) seedlings grown under different R:FR. Seedlings were grown in W (R:FR > 1.5) for 7 days or for 2 days in W and then transferred to two W + FR treatments (R:FR 0.06 or 0.02) for 5 additional days. Values of hypocotyl length are the means ± SE of three independent biological replicates (at least 10 seedlings per replica).
- D
Aspect of representative 7‐day‐old W‐grown seedlings shown in C. Scale bar is 1 cm.
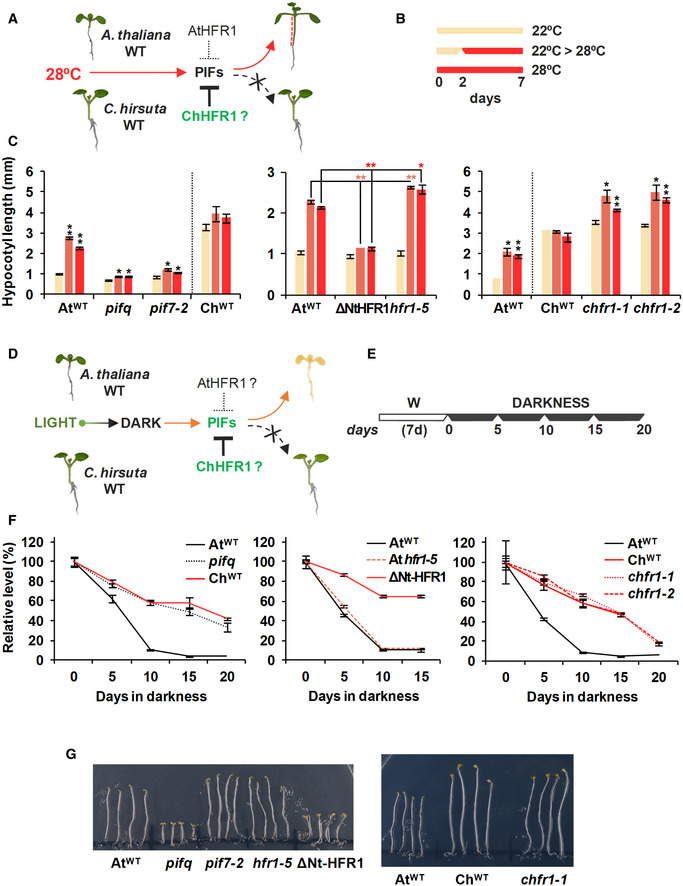
In AtWT, PIFs promote hypocotyl elongation as a response to warm temperature (28ºC). High ChHFR1 activity is expected to inhibit this response by repressing PIFs more effectively in ChWT and attenuate hypocotyl elongation at 28°C.
Seedlings were grown for 7 days in W at either 22°C, 2 days at 22°C then transferred to 28°C for additional 5 days (22°C > 28°C) or for 7 days at 28°C, as represented in the panel.
Hypocotyl length of seedlings of (left) AtWT, pifq, pif7‐2, ChWT, (middle) 35S:GFP‐ΔNt‐HFR1 (ΔNtHFR1), hfr1‐5 and (right) chfr1‐1 and chfr1‐2 lines grown at warm temperatures. Hypocotyl lengths are the means ± SE of three biological replicates. Asterisks mark significant differences (Student's t‐test: *P‐value < 0.05, **P‐value < 0.01) relative to the same genotype grown at 22°C (left and right graphs, black asterisks), and between the indicated pairs (middle graph, red asterisks).
In AtWT, PIF‐mediated DIS involves a reduction of chlorophyll levels. HFR1 activity might inhibit DIS through repression of PIFs. If PIF activity is attenuated in ChWT, DIS would be delayed in this species compared to AtWT.
Seedlings were grown for 7 days in W and then transferred to total darkness for several days to induce senescence, as illustrated at the right panel.
Relative chlorophylls levels of (left) AtWT, pifq, ChWT, (middle) ΔNtHFR1, hfr1‐5 and (right) chfr1‐1, and chfr1‐2 lines after DIS was promoted for the indicated time. For each genotype, values are relative to pigment levels at time 0 (7 days in W). Data are the means ± SE of four independent biological replicates.
Aspect of 4‐day‐old dark‐grown seedlings of AtWT, pifq, pif7‐2, hfr1‐5 and ΔNt‐HFR1 (left panel), and AtWT, ChWT, and chfr1‐1 (right panel).
References
-
- Ballare CL, Pierik R (2017) The shade‐avoidance syndrome: multiple signals and ecological consequences. Plant Cell Environ 40: 2530–2543 - PubMed
-
- Casal JJ (2013) Photoreceptor signaling networks in plant responses to shade. Annu Rev Plant Biol 64: 403–427 - PubMed
-
- Casal JJ, Candia AN, Sellaro R (2014) Light perception and signalling by phytochrome A. J Exp Bot 65: 2835–2845 - PubMed
-
- Cifuentes‐Esquivel N, Bou‐Torrent J, Galstyan A, Gallemi M, Sessa G, Salla Martret M, Roig‐Villanova I, Ruberti I, Martinez‐Garcia JF (2013) The bHLH proteins BEE and BIM positively modulate the shade avoidance syndrome in Arabidopsis seedlings. Plant J 75: 989–1002 - PubMed
Publication types
MeSH terms
Substances
Grants and funding
- Max Planck Society
- Generalitat de Catalunya (Government of Catalonia)
- BIO2017-85316-R/Ministerio de Economía, Industria y Competitividad, Gobierno de España (MINECO)
- CERCA Programme
- BB/H006974/1/BB_/Biotechnology and Biological Sciences Research Council/United Kingdom
- ANR-10-LABX-0040-SPS/Laboratoire Systèmes et Ingénierie de Paris-Saclay (Labex LaSIPS)
- Xarba
- Chinese Government Scholarship
- 2017-SGR1211/Government of Catalonia | Agència de Gestió d'Ajuts Universitaris i de Recerca (AGAUR)
- Howard Hughes Medical Institute (HHMI)
- European Commission (EC)
- SEV-2015-0533/Centro de Excelencia Severo Ochoa 2016-2019
LinkOut - more resources
Full Text Sources
Other Literature Sources
Research Materials
