. 2020 Dec 1;32(6):1063-1075.e7.
doi: 10.1016/j.cmet.2020.11.007.

SCENITH: A Flow Cytometry-Based Method to Functionally Profile Energy Metabolism with Single-Cell Resolution

Affiliations

SCENITH: A Flow Cytometry-Based Method to Functionally Profile Energy Metabolism with Single-Cell Resolution

Rafael J Argüello et al. Cell Metab. .

Abstract

Energetic metabolism reprogramming is critical for cancer and immune responses. Current methods to functionally profile the global metabolic capacities and dependencies of cells are performed in bulk. We designed a simple method for complex metabolic profiling called SCENITH, for single-cell energetic metabolism by profiling translation inhibition. SCENITH allows for the study of metabolic responses in multiple cell types in parallel by flow cytometry. SCENITH is designed to perform metabolic studies ex vivo, particularly for rare cells in whole blood samples, avoiding metabolic biases introduced by culture media. We analyzed myeloid cells in solid tumors from patients and identified variable metabolic profiles, in ways that are not linked to their lineage or their activation phenotype. SCENITH's ability to reveal global metabolic functions and determine complex and linked immune-phenotypes in rare cell subpopulations will contribute to the information needed for evaluating therapeutic responses or patient stratification.

Keywords: cell culture media and metabolism; functional assay metabolism single cells; metabolic function by flow cytometry; metabolic gene signatures; metabolic profiling of blood samples; metabolism analysis in samples from patients; protein synthesis and metabolism; translation and metabolism; tumor immunometabolism.


Conflict of interest statement

Declaration of Interests The authors declare no competing interests. There are restrictions to the commercial use of SCENITH due to a pending patent application (PCT/EP2020/060486).

Figures

Figure 1.
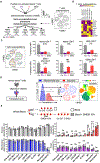
Figure 1.. SCENITH design based on dynamic changes in protein synthesis levels upon blockade of different metabolic pathways.
(A) Blocking ATP production and kinetics of ATP and Translation levels. (B) Visualization of protein synthesis after puro incorporation and staining with a new monoclonal anti-puro (clone R4743L-E8). Histogram PS level by flow cytometry in MEFs after blocking both mitochondrial respiration and glucose oxidation for different amounts of time. (C, D and E) Measurement in MEFs upon blocking ATP synthesis versus time of ATP levels (C), PS by flow cytometry (D) and correlation of both (E). Dot represents the means and bar the standard deviation (R=0.985, P<0.0001, N=3). (F) Schematic representation of a sample that contains three cell types with different metabolism profiles (Aerobic glycolysis, Glycolysis/OXPHOS, FAO and AAO/OXPHOS). Treating the mix of cells with specific drugs (DG or O) will affect each cell subset in a different way. (G) Examples of metabolic monitoring using SCENITH. The glucose dependence and FAO and AAO capacity; and the mitochondrial dependency and glycolytic capacity can be calculated from the MFI of puro in the different treatments following the formulas (see materials and methods). (H) Description of SCENITH procedure. Extract the sample, divide it and treat each with the inhibitors (e.g. DG, O, DG+O, H) and puro. After staining and flow cytometry, the profile of response of the different cells subsets is analyzed. The profile reveals the metabolic capacities and dependencies of the cells (i.e. high glucose dependence “pop 1” and high glycolytic capacity profile “pop 2”).
Figure 2.
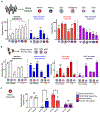
Figure 2.. Parallel Seahorse and SCENITH metabolic analysis of resting and activated T cells.
(A) Scheme of the experiment for analysis of resting and activated T cells. (B and C) Metabolic profile of T cells from three healthy donors (P1, P2, P3) analyzed with Seahorse (B) and SCENITH (C). ECAR and translation levels of non-activated and activated T cells (P1) and glycolytic capacity from both method is shown (*P<0.05; **P<0.01, ***P<0.001, N=3 each in triplicates). (D) Correlation between the changes in glycolytic capacity of steady state and activated T cells from three donors measured by Seahorse and SCENITH (Pearson r=0,92; R2=0,85; P<0.01, N=3). (E) Basal Oxygen Consumption Rate (OCR) in non-activated (non-Act) and activated T cells. Each bar represents the mean of P1, P2, and P3 (in triplicates). (F) Basal translation levels (anti-Puro gMFI) in non-activated (non-Act) and activated T cells (aCD3/CD28). Bars represent the mean of P1, P2, and P3. (G) SCENITH metabolic profile of whole blood directly treated with inhibitors with or without pre-incubation (1:4 V/V) in DMEM 10% FCS during 3hs. Data represents pooled whole blood from three mice (in duplicates) from three independent experiments. Two-way ANOVA, multiple comparisons.
Figure 3.
Figure 3.. Metabolism profile of resting human blood T cells by SCENITH identifies different metabolic profile of human T cells subsets.
(A) SCENITH analysis pipeline of T cells purified from human blood (95% pure). Dimensionality reduction (t-SNE) based on phenotypic markers is performed to the concatenated treated cells (Co, DG, O, and DGO). (B) Heatmap showing the level of expression of each marker (gMFI) in each cluster/subset from the t-SNE after dimensionality reduction. (C) Metabolic profile of the T cells subsets identified (Naïve CD4 and CD8 T cells in green, memory CD4 and HDE CD8 T cells in orange, EEM CD8 T cells in red and NK cells in blue) after SCENITH analysis. Representative translation level (anti-Puro gMFI) (P1) is shown (N=3). Black line represents background level obtained after DG+O treatment. (D) Two distinct metabolic profiles in human blood T cells after O treatment (left panel) revealing glycolytic and mitochondrial dependent T cells subsets. Histogram show the level of translation in all T cells (light grey line) upon mitochondrial inhibition, indicating the presence of “glycolytic” cells subsets (in red) and “mitochondrial dependent” cells (in blue). Gating them into the t-SNE plot (right panel) to identify the phenotype of “glycolytic” and “mitochondrial dependent” cells (blue). The marker of antigen experience CD45RA, lost in cells that have been previously exposed to TCR stimulations correlates with the metabolic profile. (E) Metabolic changes induced by short-term incubation of blood with cell culture media. Metabolic parameters of cell types when blood is pre-incubated with DMEM 10% FCS (0, or 3hs) or directly incubated with the inhibitors (i.e. Co, DG, O, DGO or Harringtonine) and puro. Data from pooled whole blood from three mice (in duplicates) from three independent experiments is shown (N=3). Statistical significance between both conditions T-test (** p<0.005).
Figure 4.
Figure 4.. Metabolic profile of human blood DCs and monocytes, and mouse bone marrow derived DCs using SCENITH.
(A) Metabolic profile of human blood monocytes and DC subsets obtained by SCENITH. (N=5 independent healthy donors). Statistical significance two-way ANOVA comparing all columns was performed (* p<0.05; ** p<0.005; ****p<0.0001). The pDC, the Mono2 or Mono1, showed statistically significant differences against DC1 or DC5. (B) Metabolic profile of mouse bone marrow derived DCs (FLT3L-DC) obtained by SCENITH (N=3) in non-treated vs LPS treated cells two-way ANOVA * p<0.05; ** p<0.005; ****p<0.0001. (C) Metabolic profile of blood monocytes from human (N=4) or mouse (N=9, 3 mice pooled, in duplicates, three independent experiments). Statistical significance between human and mouse monocytes by T-test (* p<0.05).
Figure 5.
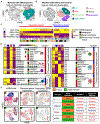
Figure 5.. Paralleled SCENITH and scRNAseq in human tumor and juxta-tumoral samples identifies conserved metabolic profiles.
(A and B) Myeloid subsets observed in the human meningioma tumor sample (A) and Renal carcinoma (B). Myeloid cells gated on CD45+/CD3CD20CD19CD56/Live-dead/singlets. Number in the t-SNE represents the percentage of the population. (C) Heatmap of the metabolic profile (columns) of each myeloid cell subset from each type of tissue (rows). Unsupervised hierarchal clustering of subsets by metabolic profile identifies respiratory (blue bar) and glycolytic (red bar) clusters. (D) Reordering of the rows by cell type based on (B) to identify changes in metabolism profile in the same cell subset in the blood, the tumors and juxta-tumoral tissue. (E) Clusters of myeloid cells identified in the renal carcinoma and juxta-tumoral tissue by scRNAseq (left panel). Expression of glycolytic and respiratory gene signatures in all cells extracted from the tumor. Summary of the results obtained by SCENITH and scRNAseq in tumor and juxta-tumoral myeloid cells. Populations named with numbers in the t-SNE and described in table.

References

    1. Ahl PJ, Hopkins RA, Xiang WW, Au B, Kaliaperumal N, Fairhurst A-M, and Connolly JE, (2020a). A novel strategy for single-cell metabolic analysis highlights dynamic changes in immune subpopulations. BioRxiv 2020.01.21.914663. - PMC - PubMed
    1. Ahl PJ, Hopkins RA, Xiang WW, Au B, Kaliaperumal N, Fairhurst AM, and Connolly JE, (2020b). Met-Flow, a strategy for single-cell metabolic analysis highlights dynamic changes in immune subpopulations. Commun. Biol 3, 1–15. - PMC - PubMed
    1. Amiel E, Everts B, Freitas TC, King IL, Curtis JD, Pearce EL, and Pearce EJ, (2012). Inhibition of Mechanistic Target of Rapamycin Promotes Dendritic Cell Activation and Enhances Therapeutic Autologous Vaccination in Mice. J. Immunol 189, 2151–2158. - PMC - PubMed
    1. Andrews TM, and Tata JR, (1971). Protein synthesis by membrane-bound and free ribosomes of secretory and non-secretory tissues. Biochem. J 121. - PMC - PubMed
    1. Antonia SJ, Villegas A, Daniel D, Vicente D, Murakami S, Hui R, Kurata T, Chiappori A, Lee KH, De Wit M, et al. (2018). Overall survival with durvalumab after chemoradiotherapy in stage III NSCLC. N. Engl. J. Med 379, 2342–2350. - PubMed

Publication types