. 2020 Dec 1;32(6):967-980.e5.
doi: 10.1016/j.cmet.2020.10.025.

Succinyl-CoA Ligase Deficiency in Pro-inflammatory and Tissue-Invasive T Cells

Affiliations

Succinyl-CoA Ligase Deficiency in Pro-inflammatory and Tissue-Invasive T Cells

Bowen Wu et al. Cell Metab. .

Abstract

Autoimmune T cells in rheumatoid arthritis (RA) have a defect in mitochondrial oxygen consumption and ATP production. Here, we identified suppression of the GDP-forming β subunit of succinate-CoA ligase (SUCLG2) as an underlying abnormality. SUCLG2-deficient T cells reverted the tricarboxylic acid (TCA) cycle from the oxidative to the reductive direction, accumulated α-ketoglutarate, citrate, and acetyl-CoA (AcCoA), and differentiated into pro-inflammatory effector cells. In AcCoAhi RA T cells, tubulin acetylation stabilized the microtubule cytoskeleton and positioned mitochondria in a perinuclear location, resulting in cellular polarization, uropod formation, T cell migration, and tissue invasion. In the tissue, SUCLG2-deficient T cells functioned as cytokine-producing effector cells and were hyperinflammatory, a defect correctable by replenishing the enzyme. Preventing T cell tubulin acetylation by tubulin acetyltransferase knockdown was sufficient to inhibit synovitis. These data link mitochondrial failure and AcCoA oversupply to autoimmune tissue inflammation.

Keywords: T cell; acetyl-CoA; acetylation; alph-ketoglutarate; autoimmunity; citrate; microtubule; mitochondria; tissue invasion; uropod.


Conflict of interest statement

Declaration of Interests The authors have declared that no conflict of interest exists.

Figures
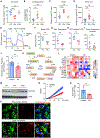
Figure 1.
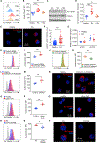
Figure 1.. Repression of the Mitochondrial Enzyme Succinate-CoA Ligase (SUCLG2) in RA T Cells
CD4+CD45RA+ T cells from patients with rheumatoid arthritis (RA), patients with psoriatic arthritis (PsA), and age-matched healthy individuals were stimulated for 72 h. (A–D) Intracellular concentrations of the mitochondrial metabolites succinate, α-KG, citrate, and acetyl-CoA. (E–I) Mitochondrial oxygen consumption rates (OCR) measured by Seahorse Analyzer. (E) Summary OCR traces from healthy (n = 6, blue) and RA T cells (n = 6, red). (F–I) Baseline respiration (F), maximal respiration (G), ATP-coupled respiration (H), and spare respiratory capacity (I) were calculated. (J) Mitochondrial membrane potential measured by flow cytometry for MitoTracker Red. MFIs from six controls and six RA patients. (K) Scheme illustrating enzymes and metabolic intermediates in the TCA cycle. (L) Transcripts of 13 TCA cycle enzymes quantified by RT-PCR. Heatmap presentation from seven healthy-RA pairs. p values and significance levels adjusted for multiple comparisons. (M) Immunoblot analysis of Succinate-CoA Ligase GDP-Forming Beta Subunit (SUCLG2) in T cells from three RA patients, three PsA patients, and three healthy controls. (N and O) Succinyl-CoA synthetase activity in healthy and RA T cells. Real-time OD values indicating the catalytic reaction (N). Calculated SCS activity of six healthy and six RA T cell samples (O). (P) Double immunofluorescence staining for CD3 and SUCLG2 in tissue sections from rheumatoid synovitis (top) and giant cell arteritis (bottom). Scale bar; 20 μm. Data are mean ± SEM. One-way ANOVA and post-ANOVA pairwise two-group comparisons conducted with Tukey’s method (A–D). Unpaired Mann-Whitney-Wilcoxon rank test (F–J, L, O). *p < 0.05, **p < 0.01, ***p < 0.001.
Figure 2.
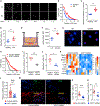
Figure 2.. Succinate-CoA Ligase (SUCLG2) Regulates Mitochondrial Activity and the Intracellular Acetyl-CoA Pool
CD4+CD45RA+ T cells from healthy individuals and RA patients were stimulated for 48 h. SUCLG2 was knocked down in healthy T cells by siRNA transfection or overexpressed in RA T cells by plasmid transfection. Cells were examined 48 h later. (A–C) Oxygen consumption rates (OCR) measured by Seahorse analyzer. (A) OCR traces after transfection of control siRNA or SUCLG2 siRNA (n = 5). (B and C) Baseline and maximal respiration were calculated. (D and E) Intracellular succinate and AcCoA concentrations in healthy T cells after SUCLG2 knockdown (n = 4). (F–H) SUCLG2 was overexpressed in RA CD4 T cells, and mitochondrial oxygen consumption rates (OCR) were measured by Seahorse analyzer. (F) Summary OCR curves from four experiments. (G and H) Baseline and maximal respiration were calculated. (I and J) Intracellular succinate and AcCoA concentrations after SUCLG2 overexpression in RA CD4 T cells (n = 4). Data are mean ± SEM. Paired t test. *p < 0.05, **p < 0.01, ***p < 0.001.
Figure 3.
Figure 3.. The Mitochondrial Enzyme SUCLG2 Is Tissue Protective
NSG mice were engrafted with human synovial tissue and immune-reconstituted with RA PBMCs. Prior to the adoptive transfer into the NSG mice, CD4 T cells were FACS-sorted and transfected with a control or SUCLG2 overexpression plasmid. (A) Experimental scheme. Human synovium-NSG mice were divided into three groups: no PBMC injection (n = 6), RA PBMCs (CD4 T cells transfected with control plasmid) injection (n = 8), RA PBMCs (CD4 T cells transfected with SUCLG2 plasmid) injection (n = 8). (B) H&E staining of synovial tissue sections. (C) Immunofluorescence co-staining for IFN-γ and CD3 in synovial explants. Representative images; scale bar, 10 μm. (D) Enumeration of tissue-residing IFN-γ+ CD3+ T cells in each synovial explant. Average IFN-γ+ CD3+ T cell numbers calculated from 3 HPF. (E) TRB, TBET, and RORG transcripts in tissue extracts measured by RT-PCR. (F) Gene expression profiling (RT-PCR) of key inflammatory markers. Data are mean ± SEM. Unpaired Mann-Whitney-Wilcoxon rank test. *p < 0.05, **p < 0.01, ***p < 0.001.
Figure 4.
Figure 4.. Tubulin Is Hyperacetylated in RA T Cells
CD4+CD45RA+ T cells from patients and controls were stimulated for 72 h as in Figure 1. (A and B) Cytofluorometric analysis of tubulin acetylation. (A) Representative histograms. (B) MFIs from eight RA patients, five PsA patients, and nine controls. (C and D) Immunoblot analysis of tubulin acetylation in six RA patients, six PsA patients, and six controls. (C) Representative blot data. (D) Quantification of blot intensity. (E) Confocal imaging of acetylated tubulin. Representative images. Scale bars, 10 μm. (F) Fluorescence intensity quantification from 50 cells in 5 control and 5 RA samples. (G) ATAT1 and HDAC6 transcripts in five control-RA pairs measured by RT-PCR. (H and I) Flow cytometry of acetylated tubulin in healthy CD4 T cells transfected with control siRNA or SUCLG2 siRNA. (H) Representative histogram. (I) MFIs from five healthy samples. (J and K) Tubulin acetylation in RA CD4 T cells after SUCLG2 overexpression. Representative histograms and MFIs from four RA samples. (L and M) Tubulin acetylation in healthy CD4 T cells treated with Antimycin A/Rotenone (5 nM). Representative histograms and MFIs from five samples. (N) Representative confocal microscopy image of Ac-tubulin. Scale bars, 10 μm. (O–Q) Cytofluorometry and confocal microscopy of Ac-tubulin in CD4 T cells treated with lipoic acid (500 μM). (O and P) Representative histograms and MFIs from four samples. (Q) Representative confocal image showing Ac-tubulin. Scale bars, 10 μm. (R–T) Tubulin acetylation in RA T cells treated with the mitochondrial citrate transport protein (CTP) inhibitor CNASB (250 μM). (R and S) Representative histograms and MFIs from four RA samples. (T) Representative confocal picture Ac-tubulin in CNASB-treated RA T cells. Scale bars, 10 μm. Data are mean ± SEM. One-way ANOVA and post-ANOVA pairwise two-group comparisons conducted with Tukey’s method (B, D). Unpaired Mann-Whitney-Wilcoxon rank test (F, G). Paired t test (I, K, M, P, S). *p < 0.05, **p < 0.01, ***p < 0.001.
Figure 5.
Figure 5.. Tubulin Hyperacetylation Promotes T Cell Mobility
CD4+CD45RA+ T cells from patients and controls were stimulated for 72 h. (A–C) CD4 T cell invasiveness in 3D collagen matrices, measured by confocal microscopy for DAPI-stained nuclei. (n = 6 HC-RA pairs). (A) Representative confocal images at the indicated depths after 48 h. Cells are marked by circles. (B) DAPI indices (signal at defined depth/surface signal). (C) Maximum invasion distances of healthy and RA T cells. (D) Migration of activated CD4 T cells in transwells without chemokines for 24 h (n = 6 HC-RA pairs). (E–G) T cells from the upper and lower chambers stained for Ac-tubulin. (E) Schematic diagram. (F) MFI of Ac-tubulin measured by flow cytometry (n = 4 up-down pairs). (G) Representative confocal images of T cells from the upper and lower chambers stained for Ac-tubulin. (H and I) CD4 T cell invasiveness in 3D collagen matrices after ATAT1 knockdown in RA T cells (n = 4). (H) DAPI indices (signal at defined depth/surface signal). (I) Maximum invasion distances. (J) Percentage of migrated T cells in transwell assays after ATAT1 knockdown in RA T cells (n = 5). (K–O) NSG mice engrafted with human synovial tissue were reconstituted with RA PBMCs that had been transfected with control or ATAT1 siRNA. Immunohistochemical staining and tissue transcriptome analysis was performed in explanted synovial grafts. Eight tissues in each group. (K) Gene expression profiling of key inflammatory markers. (L) TRB mRNA measured by RT-PCR. (M) Co-immunofluorescence staining for IFN-γ and CD3 in synovial explants. Representative images, scale bar; 10 μm. (N) Frequencies of tissue-residing CD3+IFN-γ+ T cells. (O) Percentage of tissue CD3+ T cells that form clusters. All data are mean ± SEM. Unpaired Mann-Whitney-Wilcoxon rank test (C, D, K–O). Paired t test (F, I, J). *p < 0.05, **p < 0.01, ***p < 0.001.
Figure 6.
Figure 6.. Tubulin Hyperacetylation Promotes T Cell Uropod Formation
CD4+CD45RA+ T cells from patients and controls were stimulated for 72 h and seeded on collagen-coated surfaces (A–D) or on endothelial cell (EC) monolayers (E–H). (A and B) Co-immunofluorescence staining for the Golgi marker GM-130 (green), Ac-tubulin (red), and nuclei (DAPI). (A) Representative micrographs. (B) Quantification of the Golgi-to-nucleus distance. 50 cells from 5 healthy samples and 5 RA samples were analyzed. (C and D) RA CD4 T cells were transfected with CONTROL or ATAT1 siRNA and stained for GM-130 (green). Nuclei marked with DAPI. (C) Representative micrographs. (D) Quantification of the Golgi-to-nucleus distance in spreading RA CD4 T cells after ATAT1 knockdown (n = 5). (E and F) Quantification of T cell circularity in control and RA T cells. Representative images and analysis of ten cells from each sample in five healthy-RA pairs. (G and H) Representative micrographs and quantification of cell circularity in spreading T cells after ATAT1 knockdown (n = 5, 10 cells from each sample). All data are mean ± SEM. Unpaired Mann-Whitney-Wilcoxon rank test (B, F, H). **p < 0.01, ***p < 0.001.
Figure 7.
Figure 7.. Tubulin Hyperacetylation Leads to Mitochondrial Clustering in RA CD4 T Cells
CD4+CD45RA+ T cells from RA patients and controls were activated for 72 h and stained for the mitochondrial marker HSP60. Nuclei were marked with DAPI. (A) Representative confocal images (3D Maximum mode) of ac-tubulin and HSP60 staining. (B) Confocal microscopy of individual cells stained for HSP60. Fluorescence was quantified in each of eight parts. (C) Mitochondria polarization index of healthy and RA T cells. 40 cells from 4 healthy samples and 40 cells from 4 RA samples were analyzed. (D and E) Representative microscopy images of HSP60 staining (D) and mitochondria polarization indices (E) in healthy T cells treated with the mitochondrial inhibitor Antimycin A/Rotenone (5 nM). 60 cells from 3 samples were evaluated. (F and G) Representative images of HSP60 staining (F) and mitochondria polarization indices (G) in RA T cells transfected with control or ATAT1 siRNA. 60 cells from 3 RA samples. (H and I) Representative microscopy images of HSP60 staining (H) and mitochondria polarization indices (I) after ATAT1 overexpression in healthy T cells. 60 cells from 3 samples. (J and K) Representative microscopy images of HSP60 staining (J) and mitochondria polarization indices (K) in healthy T cells treated with lipoic acid (500 μM). 60 cells from 3 samples. All data are mean ± SEM. Unpaired Mann-Whitney-Wilcoxon rank test. ***p < 0.001.

Comment in

References

    1. Al-Mehdi AB, Pastukh VM, Swiger BM, Reed DJ, Patel MR, Bardwell GC, Pastukh VV, Alexeyev MF, and Gillespie MN (2012). Perinuclear mitochondrial clustering creates an oxidant-rich nuclear domain required for hypoxia-induced transcription. Sci. Signal 5, ra47. - PMC - PubMed
    1. Balmer ML, Ma EH, Bantug GR, Grählert J, Pfister S, Glatter T, Jauch A, Dimeloe S, Slack E, Dehio P, et al. (2016). Memory CD8(+) T Cells Require Increased Concentrations of Acetate Induced by Stress for Optimal Function. Immunity 44, 1312–1324. - PubMed
    1. Bavister BD (2006). The mitochondrial contribution to stem cell biology. Reprod. Fertil. Dev 18, 829–838. - PubMed
    1. Choudhary C, Weinert BT, Nishida Y, Verdin E, and Mann M (2014). The growing landscape of lysine acetylation links metabolism and cell signalling. Nat. Rev. Mol. Cell Biol 15, 536–550. - PubMed
    1. Deane KD, Norris JM, and Holers VM (2010). Preclinical rheumatoid arthritis: identification, evaluation, and future directions for investigation. Rheum. Dis. Clin. North Am 36, 213–241. - PMC - PubMed

Publication types

LinkOut - more resources