. 2020 Dec 1;33(9):108444.
doi: 10.1016/j.celrep.2020.108444.

Concurrent Mutations in STK11 and KEAP1 Promote Ferroptosis Protection and SCD1 Dependence in Lung Cancer

Affiliations

Concurrent Mutations in STK11 and KEAP1 Promote Ferroptosis Protection and SCD1 Dependence in Lung Cancer

Corrin A Wohlhieter et al. Cell Rep. .

Abstract

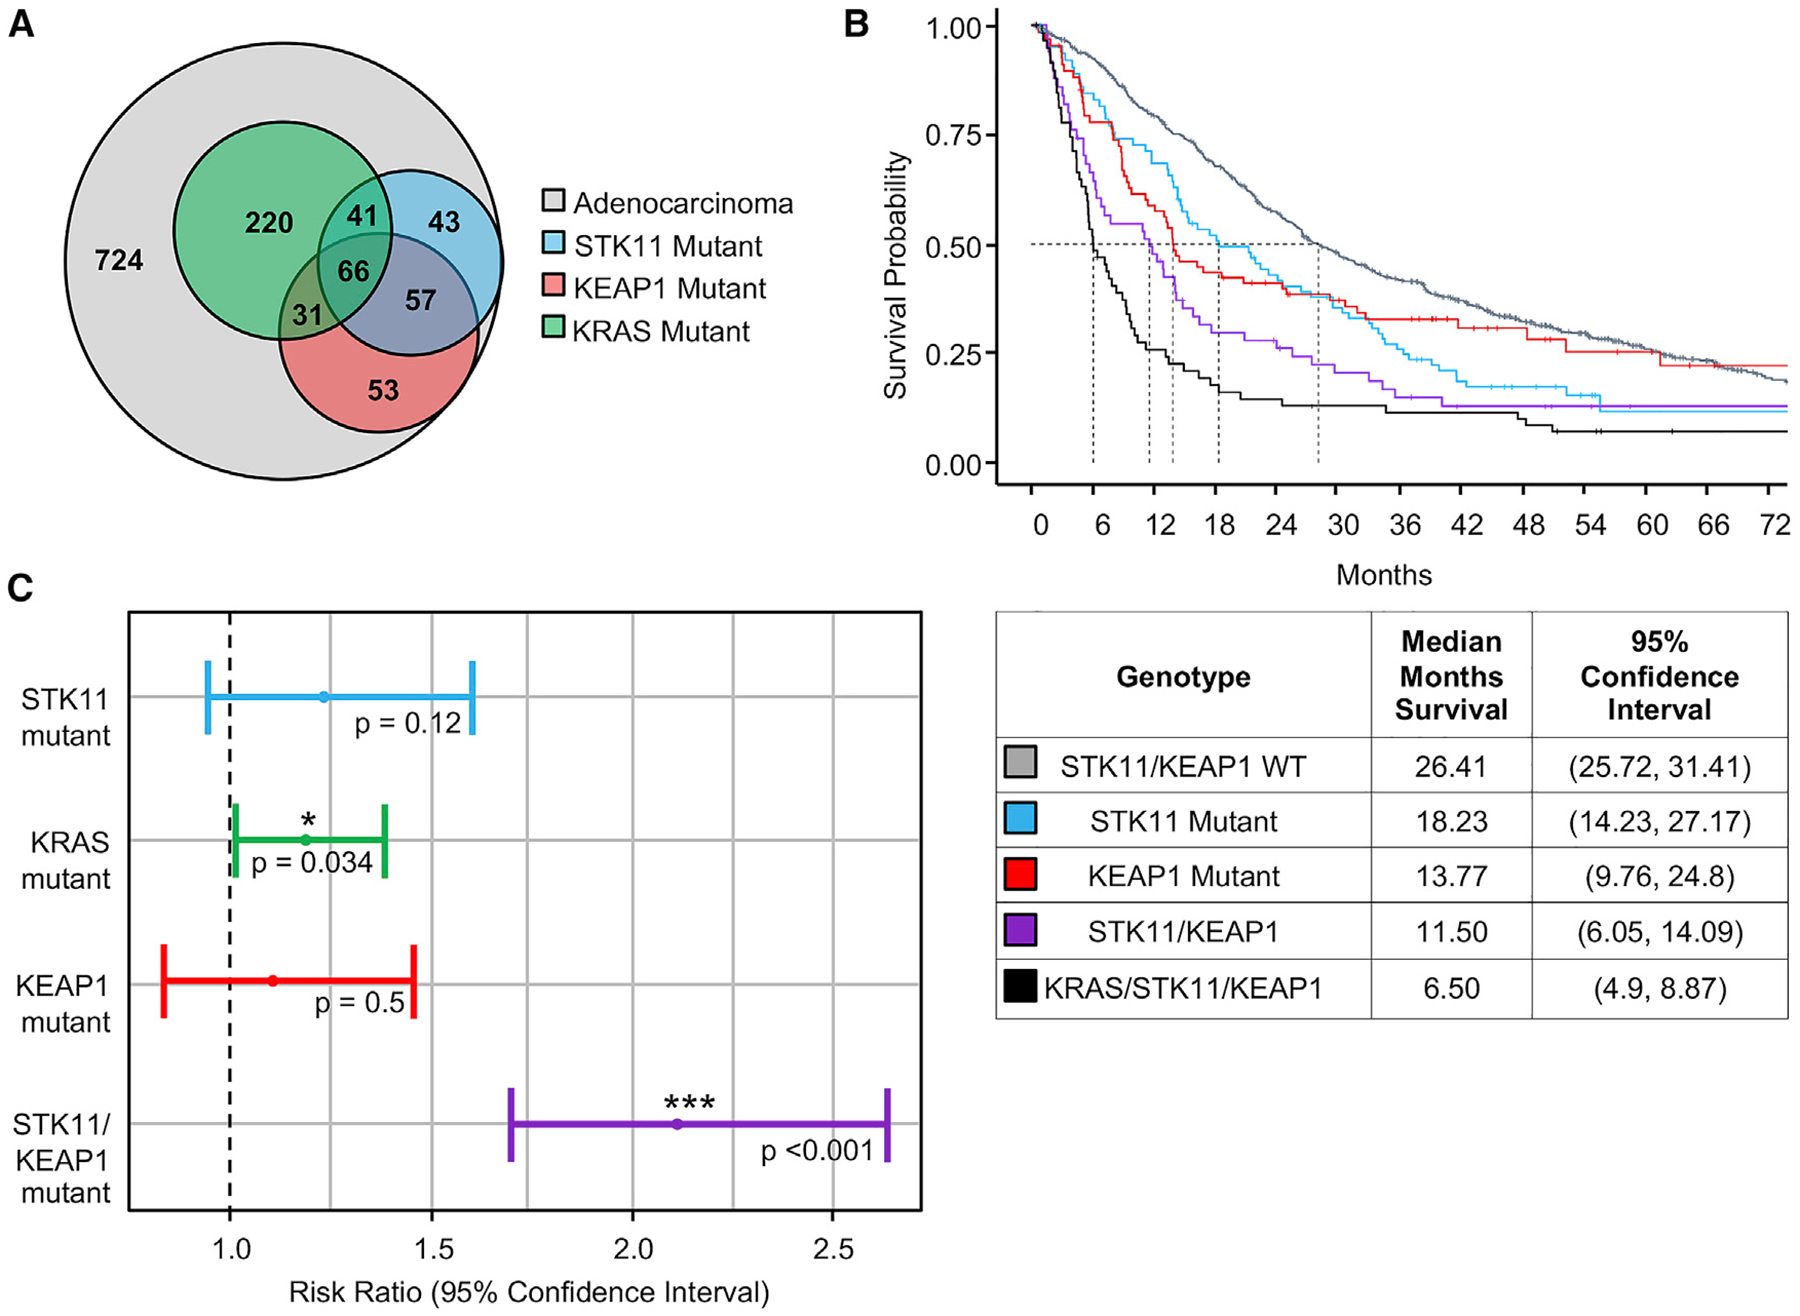
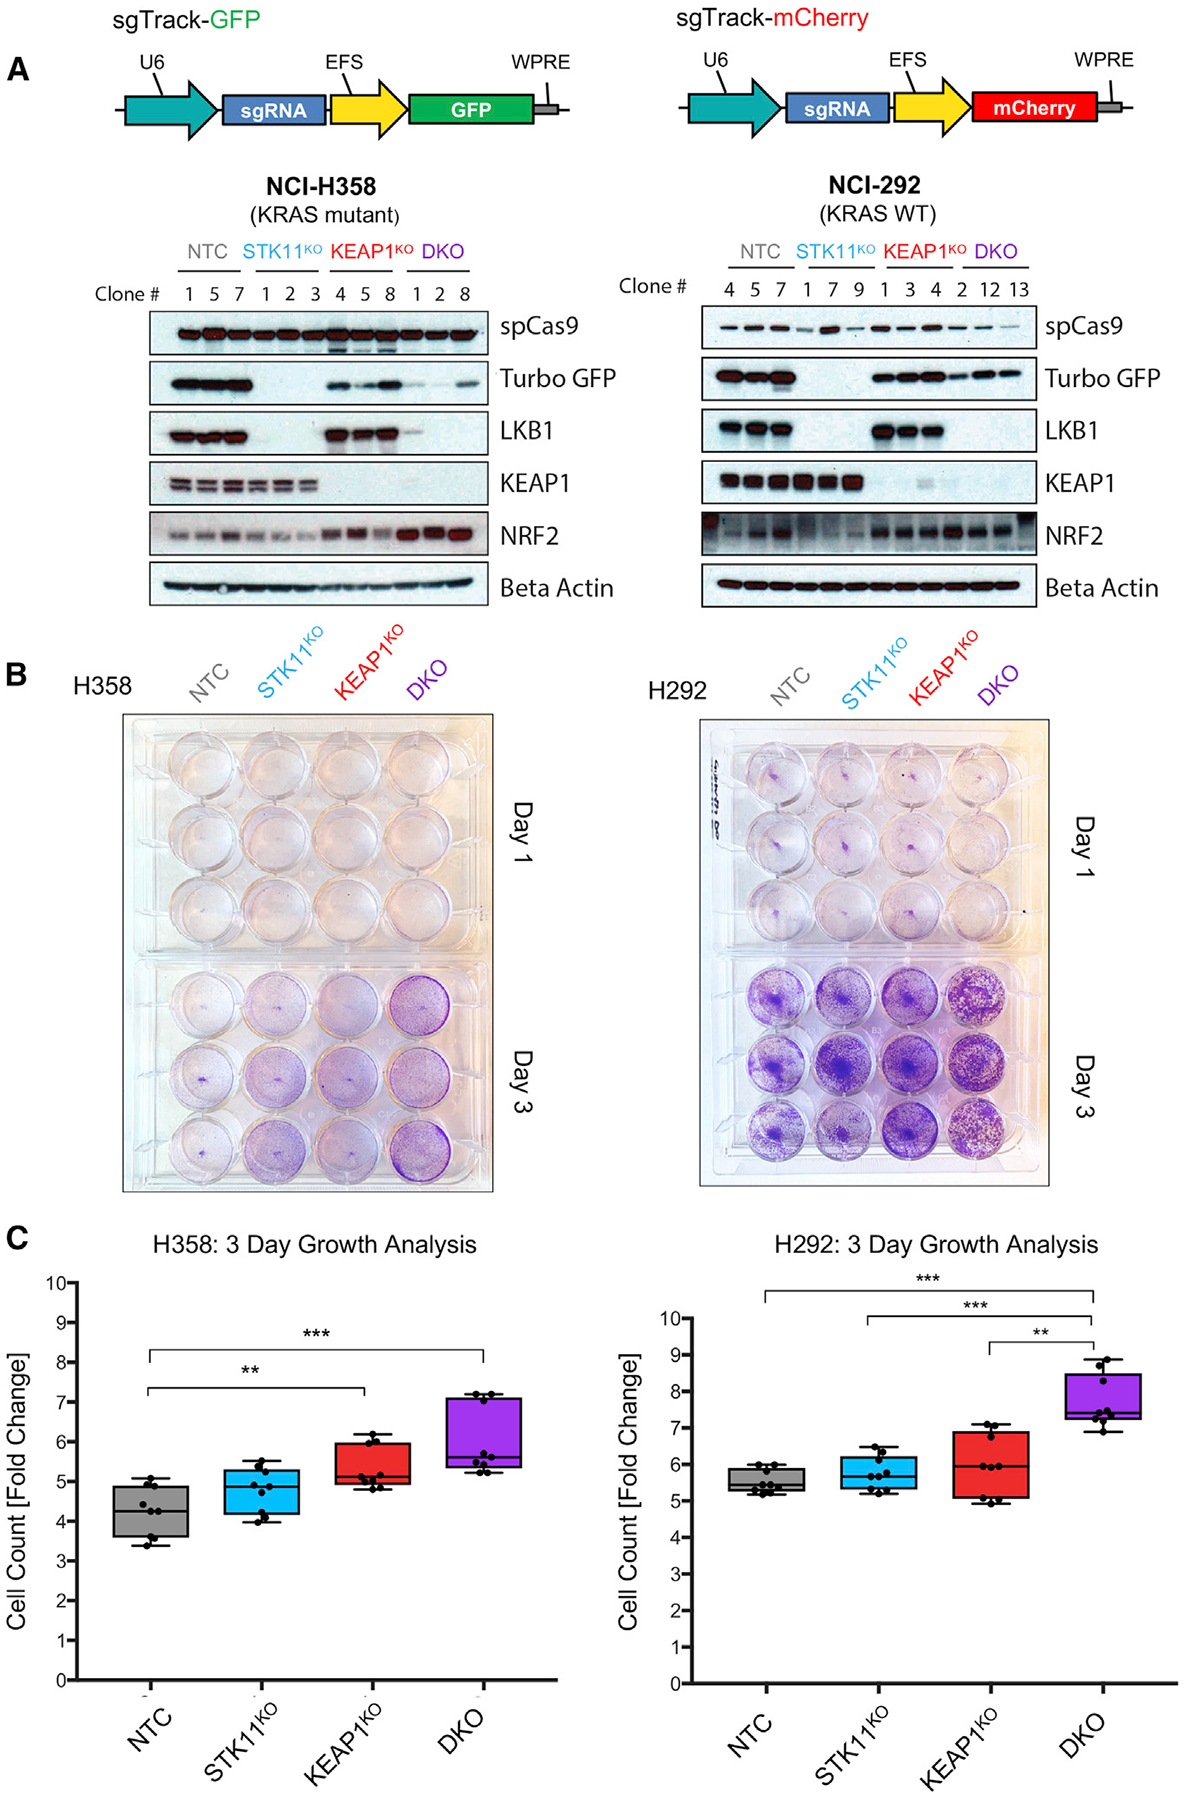
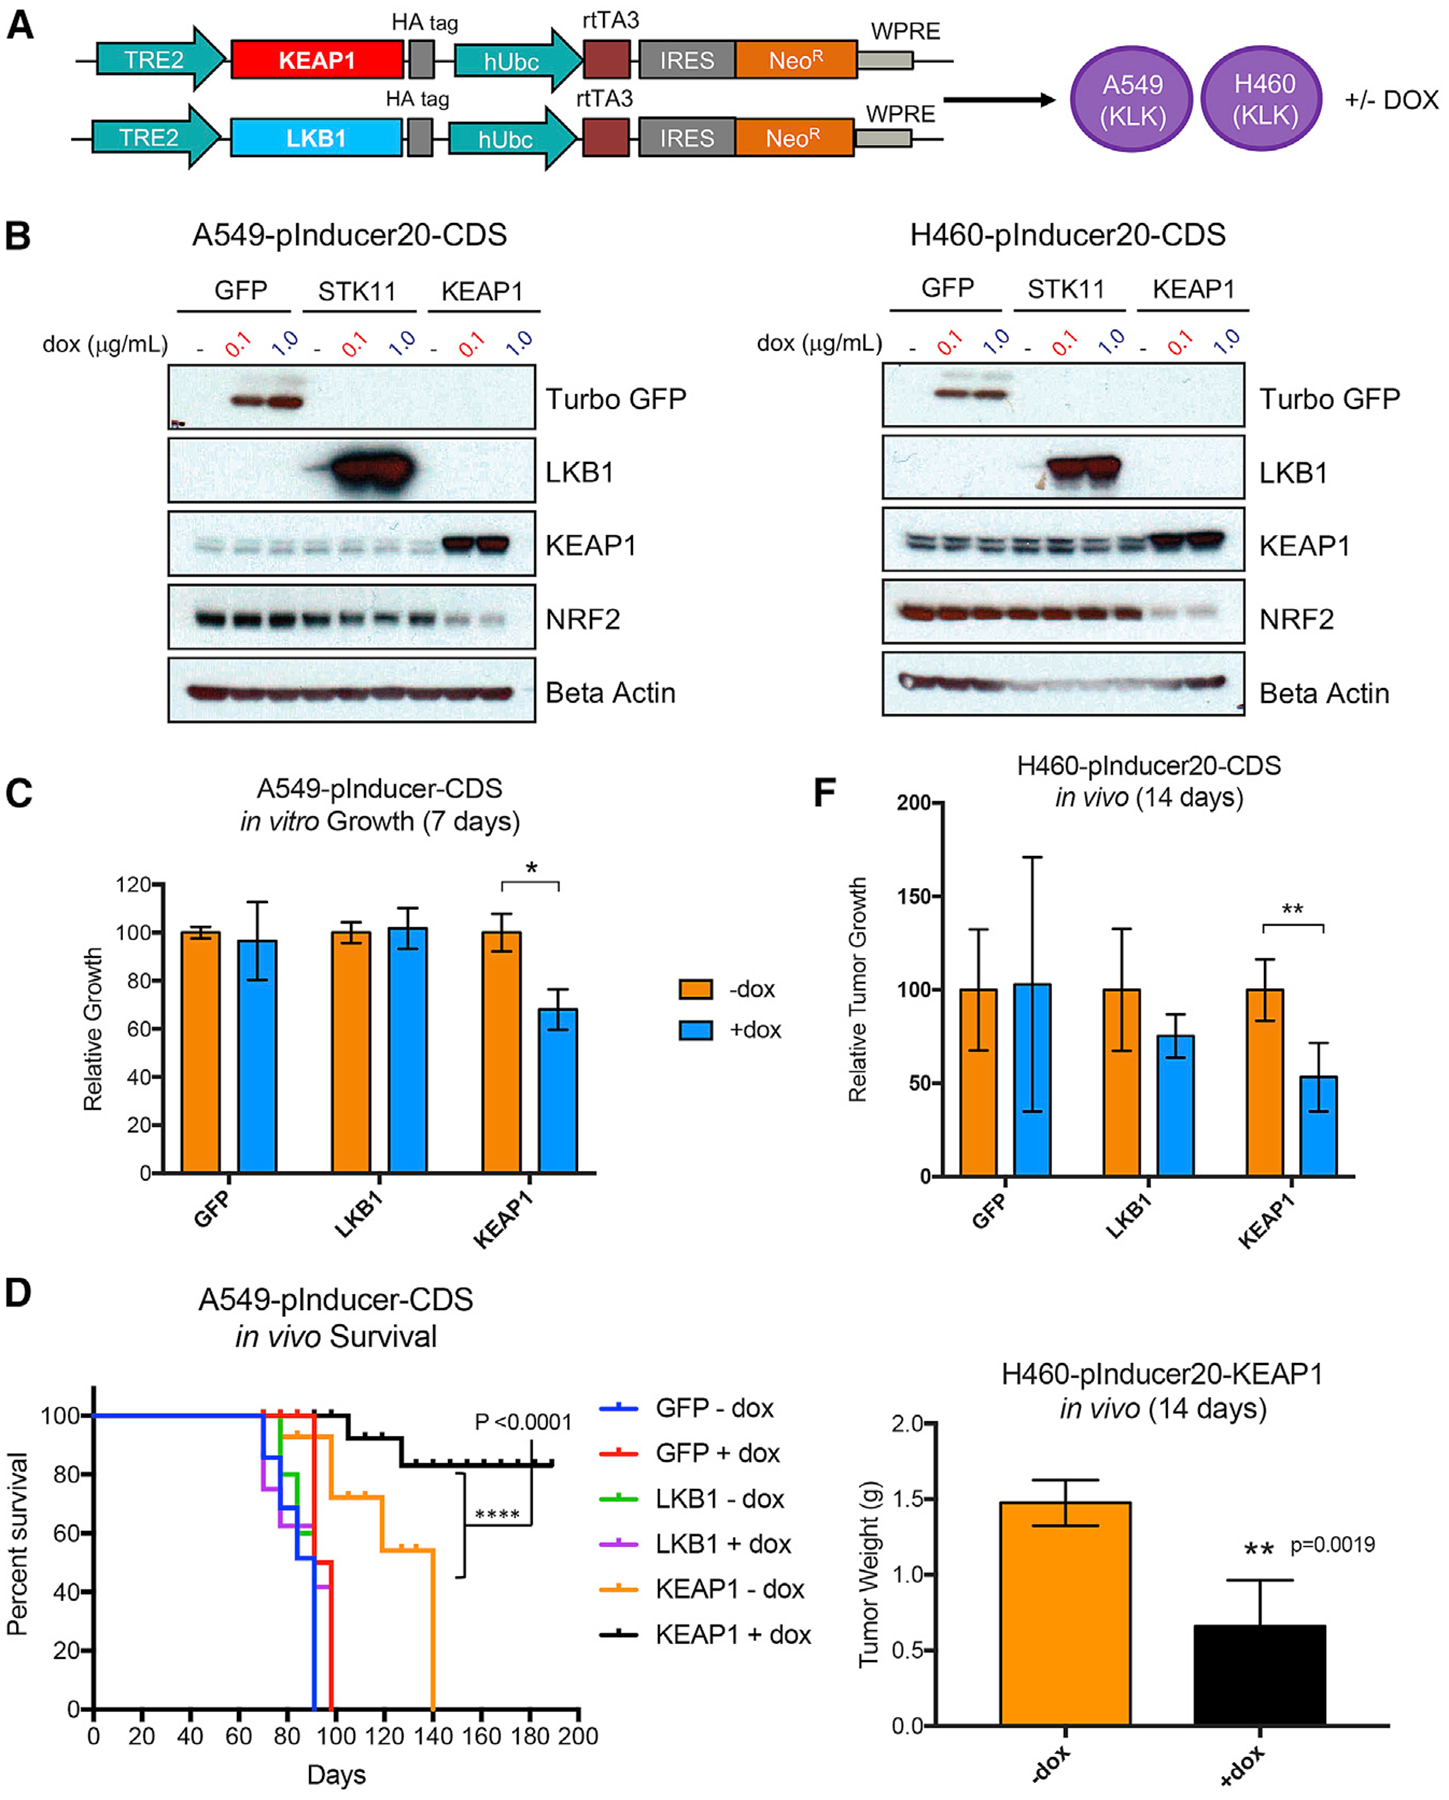
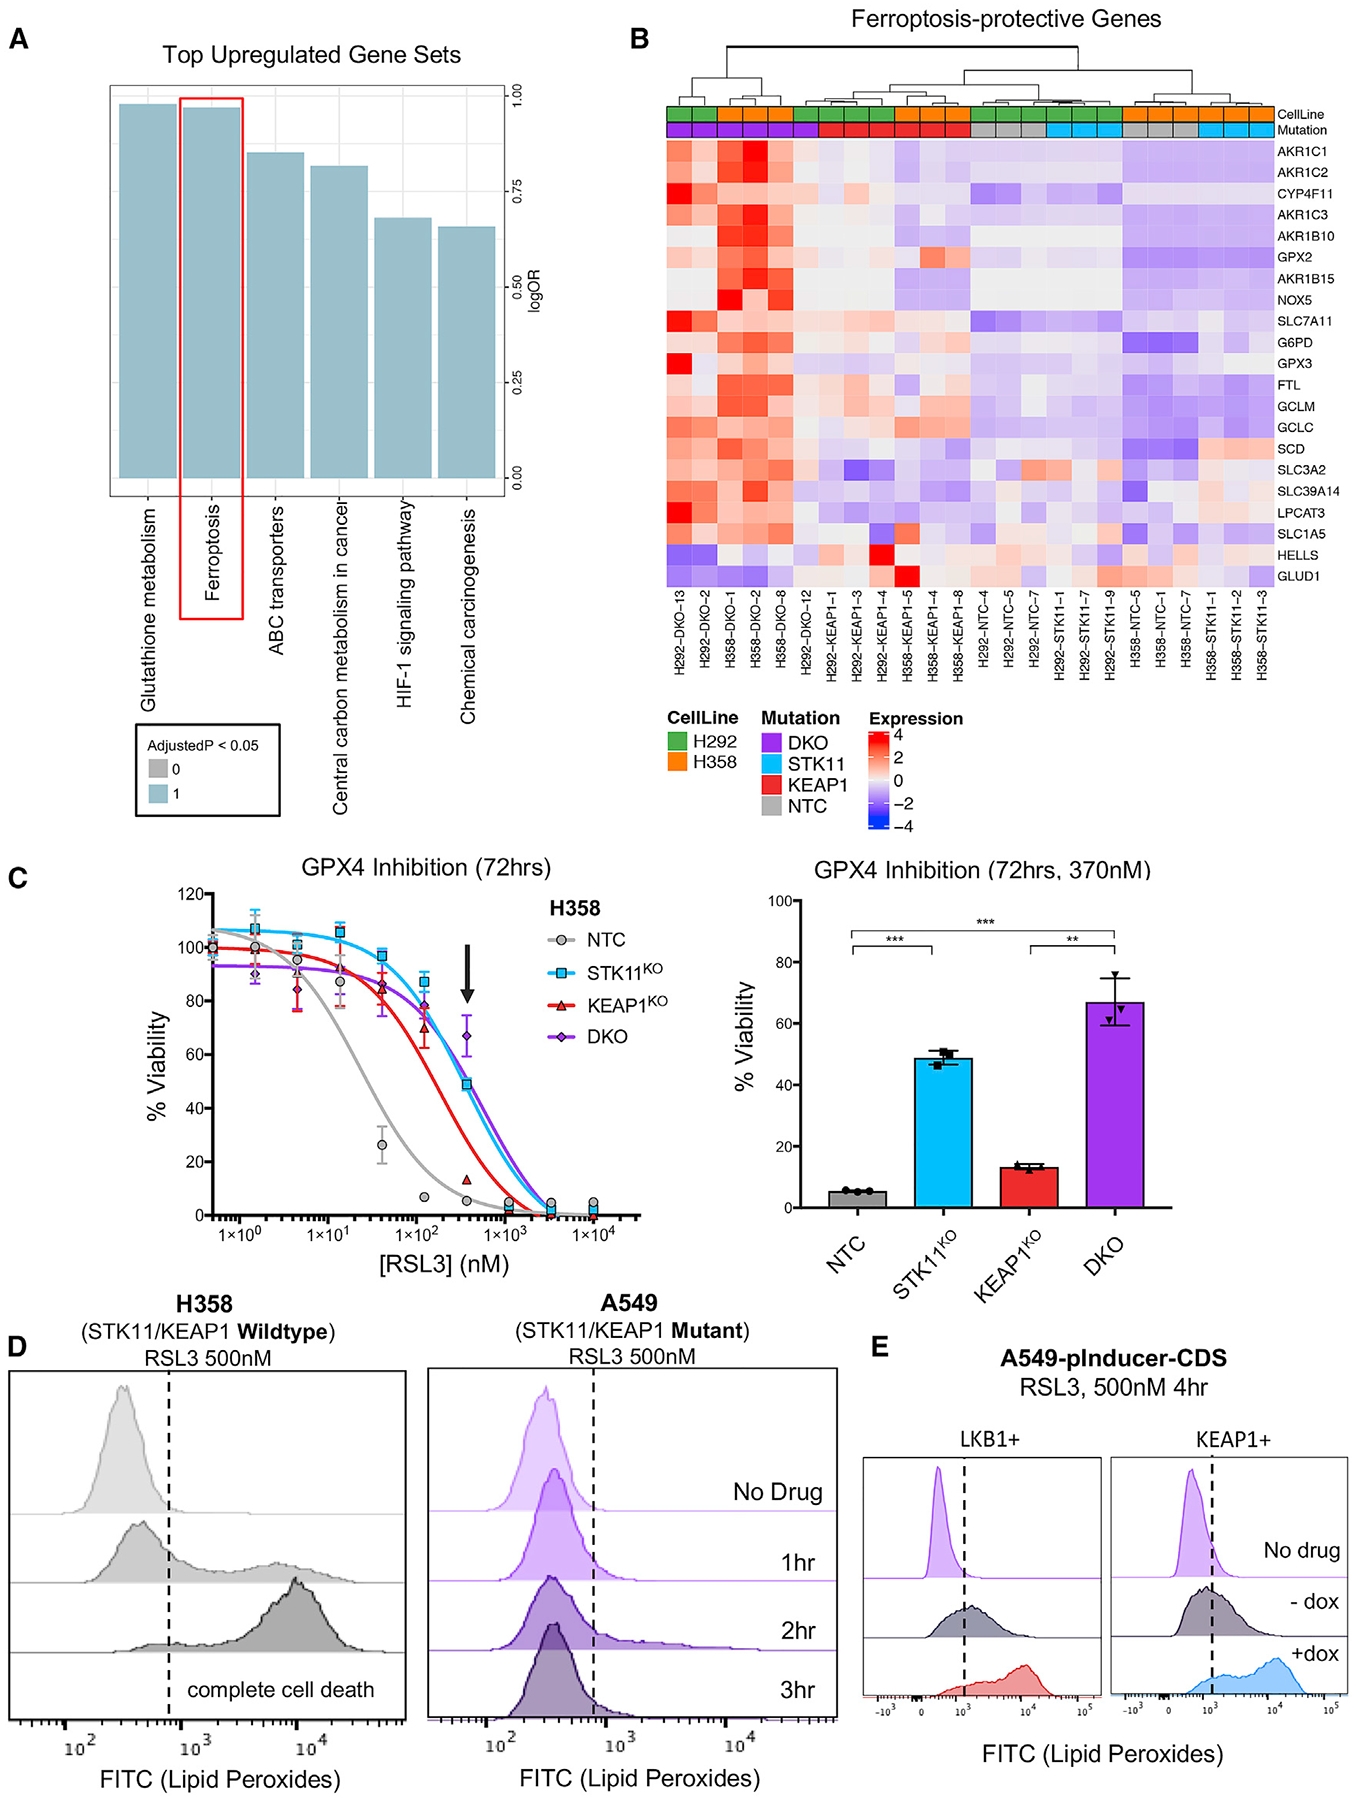
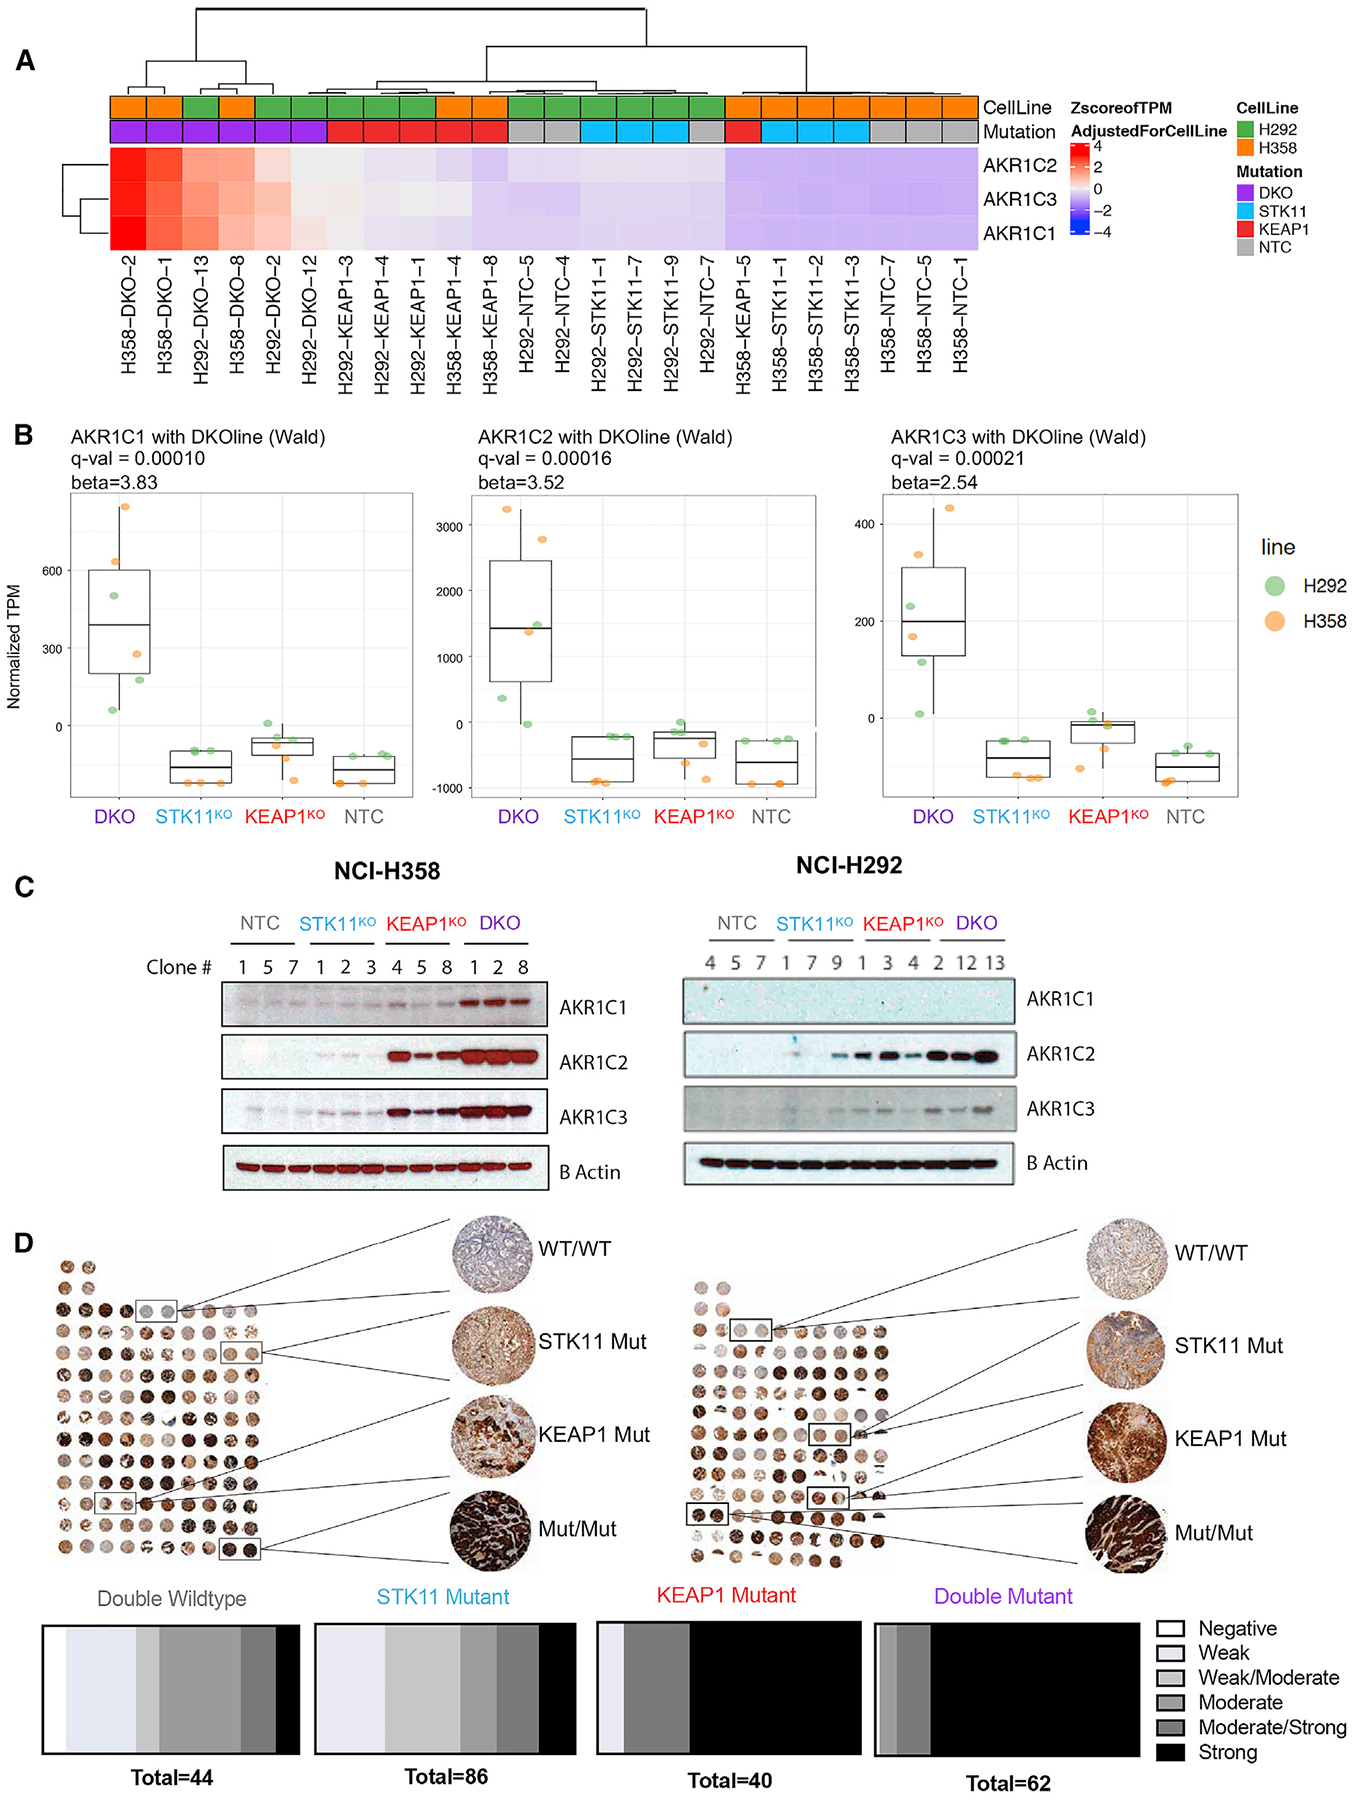
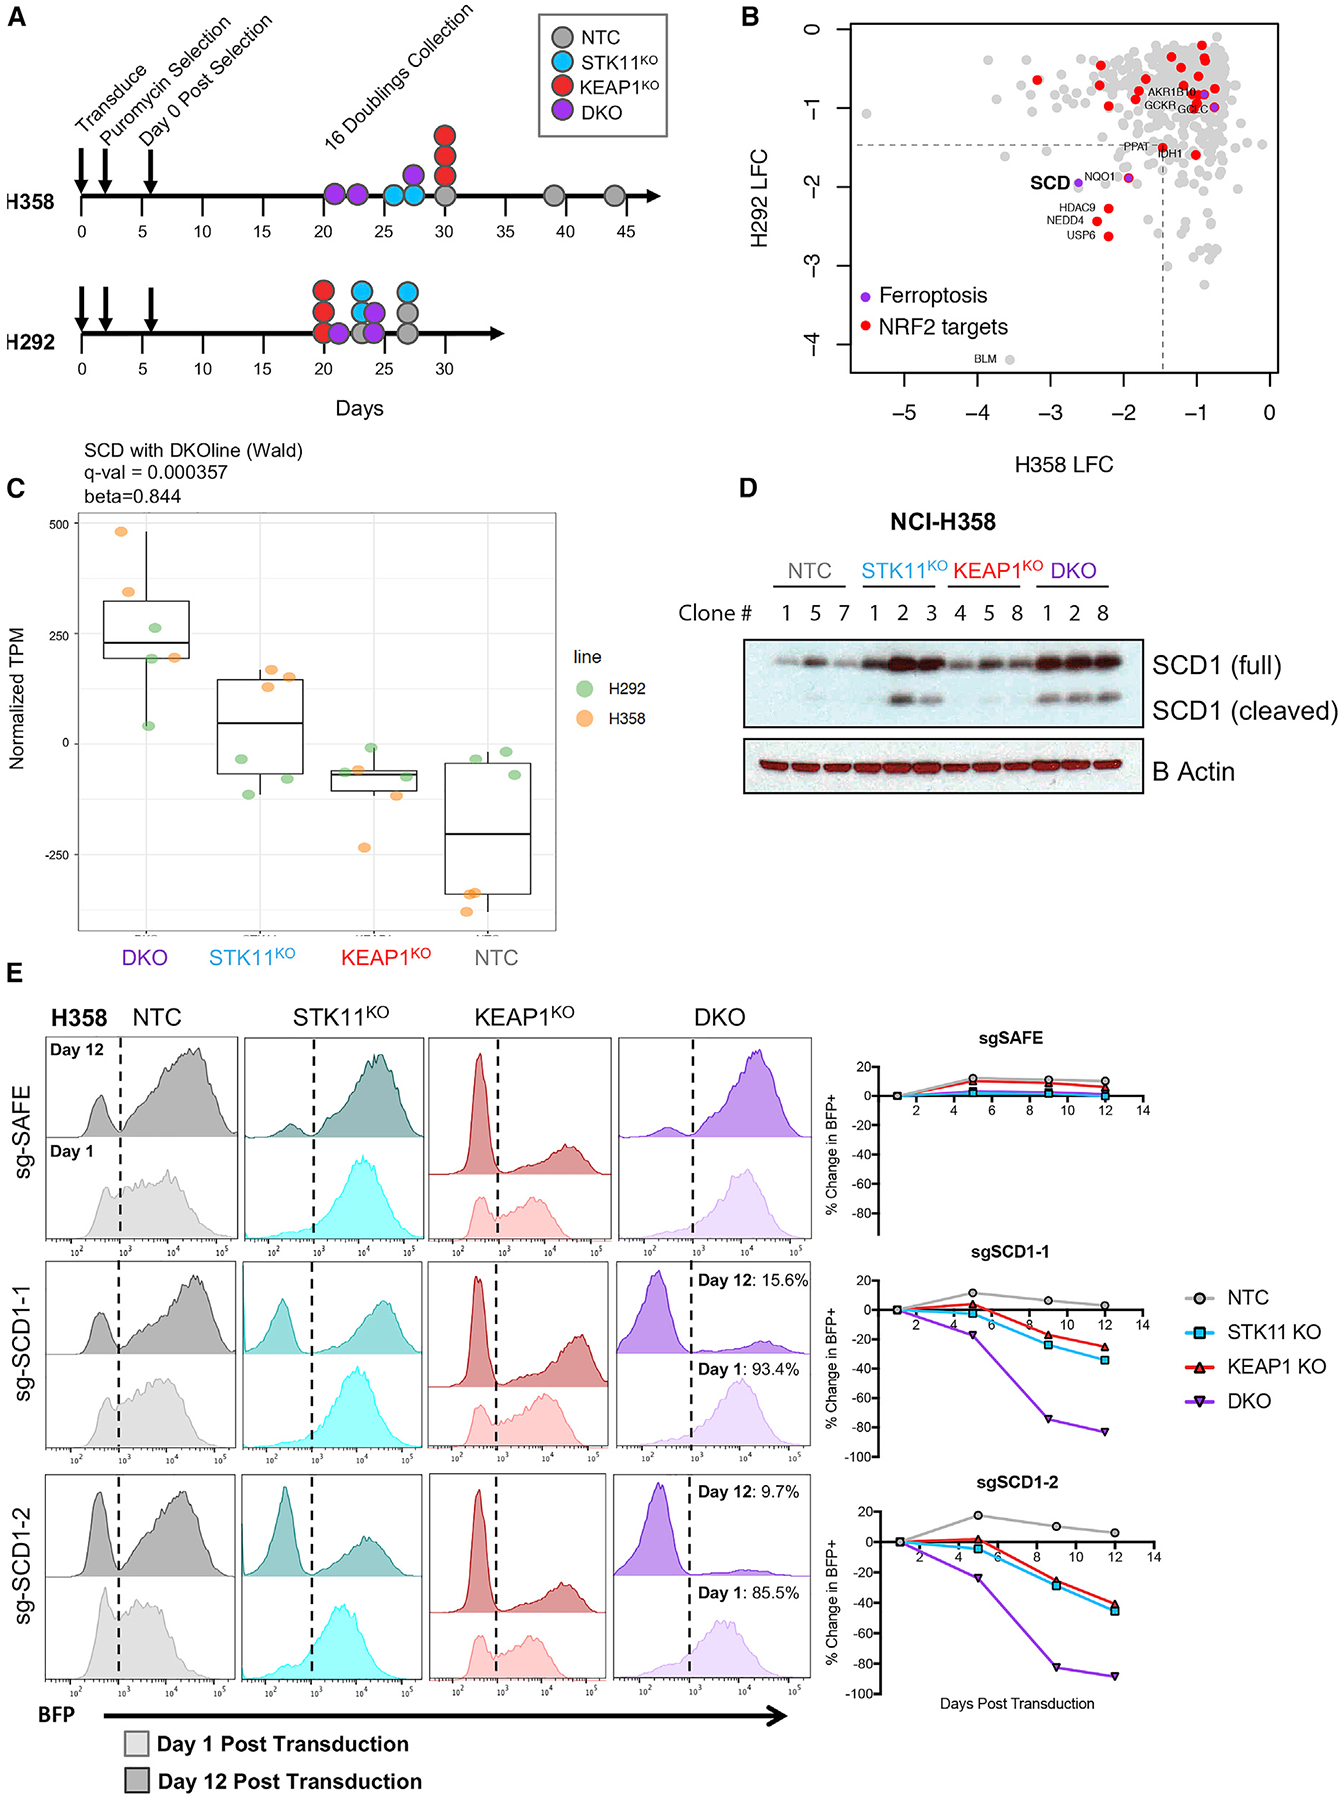
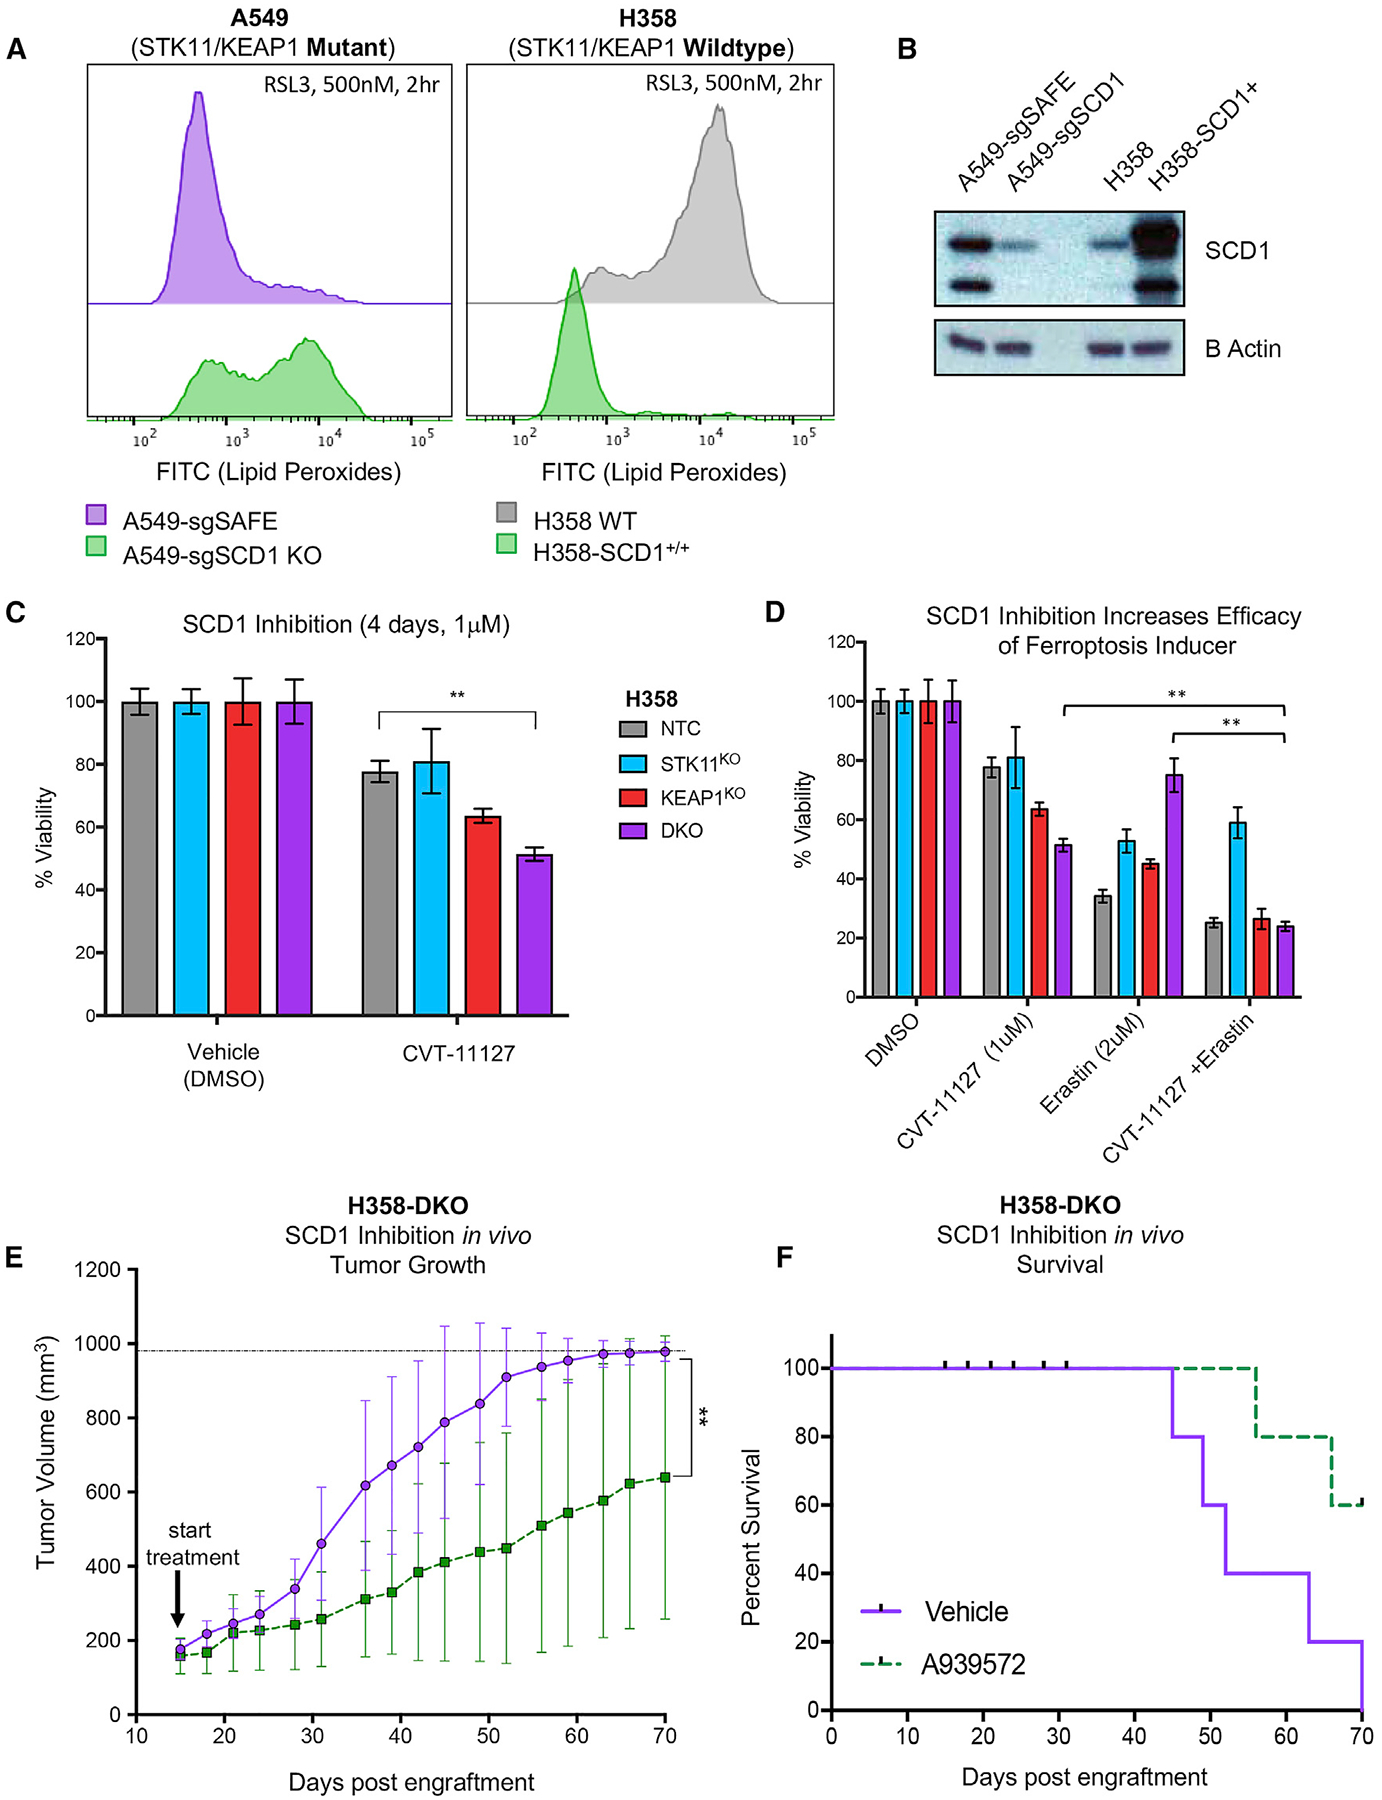
Concurrent loss-of-function mutations in STK11 and KEAP1 in lung adenocarcinoma (LUAD) are associated with aggressive tumor growth, resistance to available therapies, and early death. We investigated the effects of coordinate STK11 and KEAP1 loss by comparing co-mutant with single mutant and wild-type isogenic counterparts in multiple LUAD models. STK11/KEAP1 co-mutation results in significantly elevated expression of ferroptosis-protective genes, including SCD and AKR1C1/2/3, and resistance to pharmacologically induced ferroptosis. CRISPR screening further nominates SCD (SCD1) as selectively essential in STK11/KEAP1 co-mutant LUAD. Genetic and pharmacological inhibition of SCD1 confirms the essentiality of this gene and augments the effects of ferroptosis induction by erastin and RSL3. Together these data identify SCD1 as a selective vulnerability and a promising candidate for targeted drug development in STK11/KEAP1 co-mutant LUAD.

Keywords: AKR1C1; CRISPR; KEAP1; LKB1; NSCLC; SCD1; STK11; ferroptosis.


Conflict of interest statement

Declaration of Interests C.M.R. serves on the Scientific Advisory Boards of Bridge Medicines and Harpoon Therapeutics.

Figures

Figure 1.
Figure 1.. Patients with Lung Adenocarcinoma and STK11 and KEAP1 Co-mutation Have Lower Overall Survival, Independent of KRAS Status
(A) Venn diagram indicates number of patients with late-stage, metastatic lung adenocarcinoma in the MSK IMPACT database that are wild-type for STK11 and KEAP1 (light gray), mutant for STK11 (blue), mutant for KEAP1 (red), and mutant for KRAS (green). (B) Kaplan-Meyer curve shows overall survival of patients with the indicated tumor genotype. Groups are mutually exclusive, where each patient falls into a single category with no overlap. The table indicates average overall survival across each group and 95% confidence interval. (C) Multivariate Cox regression analysis for each indicated variable was performed. The risk ratio is the ratio of overall survival corresponding to each indicated variable. KRAS and STK11/KEAP1 co-mutant are independently identified as significant covariates for overall survival (p < 0.05).
Figure 2.
Figure 2.. STK11 and KEAP1 Co-mutation Promotes Cell Growth, Independent of KRAS Mutation Status
(A) Vector maps of the lentiviral vectors used to create single-cell isogenic clones expressing either GFP or mCherry as a marker of sgRNA expression. Immunoblots of protein expression in H358 and H292 cell lines transduced with Cas9 and one or more of the following guide RNA vectors: sgTrack-GFP-NTC (non-targeting control), sgTrack-mCherry-sgSTK11, and sgTrack-GFP-sgKEAP1. Clone number indicates the single-cell clones identified to have complete loss of the indicated protein(s). (B) Crystal violet staining assays of the cell growth of three isogenic clones from each genotype group from day 1 after plating and day 3 in culture. (C) Measurement of fold-change in fluorescent intensity over 3 days for each clone. Three technical replicates were performed for each of the three biological replicates. Significance was calculated by a two-sample t test between samples at each end of the bracket. A Bonferroni correction was performed across the six tests so that *p < 0.008, **p < 0.002, ***p < 0.0002.
Figure 3.
Figure 3.. KEAP1 Re-expression Disrupts Growth of STK11/KEAP1 Co-mutant Lung Adenocarcinoma Cells
(A) Vector constructs used to transduce A549 and H460 lung adenocarcinoma cells with doxycycline inducible expression vectors for STK11 (LKB1) and KEAP1. (B) Immunoblot of protein expression in cells transduced with the expression vectors from (A), selected with neomycin, and treated with vehicle or doxycycline at the indicated concentrations for 24 h. (C) In vitro growth measurements in A549 cells expressing the indicated inducible vector systems treated with vehicle (−dox) or doxycycline at 0.1 μg/mL for 7 days. Data are represented as means ± SEM. (D) Survival curve of mice bearing A549 tumors containing inducible expression vectors with the indicated gene with or without doxycycline treatment. Survival was measured by time to tumor size of 1,000 mm3. (E) Relative tumor growth for mice harboring H460 tumors containing inducible expression vectors with the indicated gene. All tumors reached the endpoint of 1,000 mm3 or greater by week 2 (14 days), and all mice were sacrificed on the same day. The weight of H460-KEAP1 tumors treated with vehicle or doxycycline was measure at 14 days (below). Significance was calculated by a two-sample test. *p < 0.05. **p < 0.01, ***p < 0.001, p < 0.0001. Data are represented as means ± SEM.
Figure 4.
Figure 4.. Ferroptosis-Protective Genes Are Upregulated in STK11/KEAP1 Co-mutants and STK11 and KEAP1 Mutations Independently Protect Cells from Ferroptosis
(A) Bar plot of top over-represented Kyoto Encyclopedia of Genes and Genomes (KEGG) pathways among genes upregulated in double-knockout samples, across cell lines. Blue indicates a significant enrichment (q < 0.05). (B) Heatmap of differentially expressed genes between double-knockout samples versus others that can be found in the KEGG pathway of ferroptosis or have other literature linking them to the pathway. Hierarchical clustering was performed using Manhattan distance and the Ward D method of clustering. Expression shown is a Z score of the normalized transcripts per million (TPM) after removing the effect of cell line. (C) The dose-response curve of H358 isogenic clones treated with the indicated dose of ferroptosis-inducers RSL3 for 72 h. Arrow indicates the dose depicted in the bar graph. Significance was calculated by a two-sample test between samples at each end of the bracket. A Bonferroni correction was performed across the six tests so that *p < 0.008, **p < 0.002, ***p < 0.0002. (D) Lipid peroxidation, as measured by a C11-BODIPY probe, in H358 and A549 cells treated with RSL3 with 500 nM for the indicated time periods. A shift to the right indicates an increase in lipid peroxidation. (E) Lipid peroxidation, as measured by C11-BODIPY probe, in A549 cells with de novo LKB1 and KEAP1 loss-of-function mutation (−dox) or re-expression (+dox) treated with RSL3 for 4 h. A shift to the right indicates an increase in lipid peroxidation and subsequent ferroptosis induction.
Figure 5.
Figure 5.. AKR1C Family Is Highly Upregulated in STK11/KEAP1 Co-mutants
(A) Heatmap of AKR1C expression in isogenic knockout clones from three cell lines. Expression shown is a Z score of the normalized TPM after removing the effect of cell line. Hierarchical clustering was performed using Manhattan distance and the Ward D method of clustering. (B) Boxplots show normalized TPM (after removing cell line effect) of each AKR1C family member in three isogenic clones with indicated genotype. (C) Immunoblots of protein expression of AKR1C family members in isogenic clones. (D) Immunohistochemical staining for AKR1C1 in two independent tumor microarrays containing duplicate patient tumor samples from 60 (TMA1) and 58 (TMA2) patients with lung adenocarcinoma and known STK11 and KEAP1 status. Blind scoring was performed by a pathologist and retrospectively correlated to genotype for each tumor. Damaged samples were not considered in the scoring.
Figure 6.
Figure 6.. SCD1 Activity Is Essential for Survival of STK11/KEAP1 Co-mutant Adenocarcinoma
(A) Schematic indicating the timeline for each CRISPR screen. (B) Differential sgRNA abundance between NTC and DKO clones was determined using MAGeCK in robust ranking algorithm (RRA) mode. Gene-wise log-fold changes (LFC) are plotted as the means of the statistically significant sgRNAs for each gene. A cutoff of −1.5 LFCs was chosen to identify candidate hits from the two screens. Results from H358 screen are plotted on the x axis and from H292 on the y axis. (C) Boxplots show normalized TPM (after removing cell line effect) of SCD in three isogenic clones with indicated genotype from two cell lines (H358 and H292). (D) Immunoblot of protein expression of SCD1 in H358 isogenic clones. (E) BFP measurements at day 1 after transduction (lighter color) and day 12 after transduction (darker color) in H358 isogenic clones transduced with sgTrack-BFP vector containing the indicated sgRNA. Graphs quantify change in the percentage of BFP in each clone over time.
Figure 7.
Figure 7.. Pharmacologic Inhibition of SCD1 Is Effective in STK11/KEAP1 Co-mutants In Vivo and In Vitro Alone or in Combination with a Ferroptosis Inducer
(A) Lipid peroxides, as measures by a C11-BODIPY probe, in A549 cells with Cas9-mediated knockout of SCD1 (left) and H358 cells with SCD1 overexpression (right) compared with their wild-type counterparts. A shift to the right indicated an increase in levels of lipid peroxides. (B) Immunoblot of cell lines from (A) indicating knockout or overexpression of SCD1. (C) Measurement of the percentage of viable cells comparing isogenic clones from H358 cell line treated with SCD1 inhibitor CVT-11127 at 1 μM for 4 days. Significance was calculated by a two-sample t test between samples at each end of the bracket. A Bonferroni correction was performed across the six drug treatment tests so that *p < 0.008, **p < 0.002, ***p < 0.0002. Data are represented as means ± SEM. (D) Measurement of the percentage of viable cells comparing isogenic clones from H358 cell line treated with SCD1 inhibitor at 1 μM alone, erastin alone at 2 μM, or a combination of SCD1 inhibitor and erastin for 4 days. Significance was calculated by a two-sample t test in which specific hypotheses were tested for samples in the DKO group where *p < 0.05, **p < 0.01, ***p < 0.001. Data are represented as means ± SEM. (E) Tumor volume of H358-DKO tumors treated with vehicle (purple) or 50 mg/kg SCD1 inhibitor A939572 (dotted green). Significance was calculated using the non-parametric Mann-Whitney test where *p < 0.05, **p < 0.01. (F) Survival data of mice from (E) in which survival was denoted as the time from injection of cells to tumor volumes of 1,000 mm3.

Similar articles

Cited by

References

    1. Arbour KC, Jordan E, Kim HR, Dienstag J, Yu HA, Sanchez-Vega F, Lito P, Berger M, Solit DB, Hellmann M, et al. (2018). Effects of co-occurring genomic alterations on outcomes in patients with KRAS-mutant non-small cell lung cancer. Clin. Cancer. Res 24, 334–340. - PMC - PubMed
    1. Bray N, Pimentel H, Melsted P, and Pachter L (2016). Near-optimal probabilistic RNA-seq quantification. Nat. Biotechnol 34, 525–527. - PubMed
    1. Bray F, Ferlay J, Soerjomataram I, Siegel RL, Torre LA, and Jemal A (2018). Global cancer statistics 2018: GLOBOCAN estimates of incidence and mortality worldwide for 36 cancers in 185 countries. CA Cancer J. Clin 68, 394–424. - PubMed
    1. Cerami E, Gao J, Dogrusoz U, Gross BE, Sumer SO, Aksoy BA, Jacobsen A, Byrne CJ, Heuer ML, Larsson E, et al. (2012). The cBio cancer genomics portal: an open platform for exploring multidimensional cancer genomics data. Cancer Discov. 2, 401–404. - PMC - PubMed
    1. Chang WM, Chang YC, Yang YC, Lin SK, Chang PM, and Hsiao M (2019). AKR1C1 controls cisplatin-resistance in head and neck squamous cell carcinoma through cross-talk with the STAT1/3 signaling pathway. J. Exp. Clin. Cancer Res 38, 245. - PMC - PubMed

Publication types

MeSH terms

Substances