. 2020 Dec 1;33(9):108438.
doi: 10.1016/j.celrep.2020.108438.

Multi-modal Single-Cell Analysis Reveals Brain Immune Landscape Plasticity during Aging and Gut Microbiota Dysbiosis

Affiliations

Multi-modal Single-Cell Analysis Reveals Brain Immune Landscape Plasticity during Aging and Gut Microbiota Dysbiosis

Samantha M Golomb et al. Cell Rep. .

Abstract

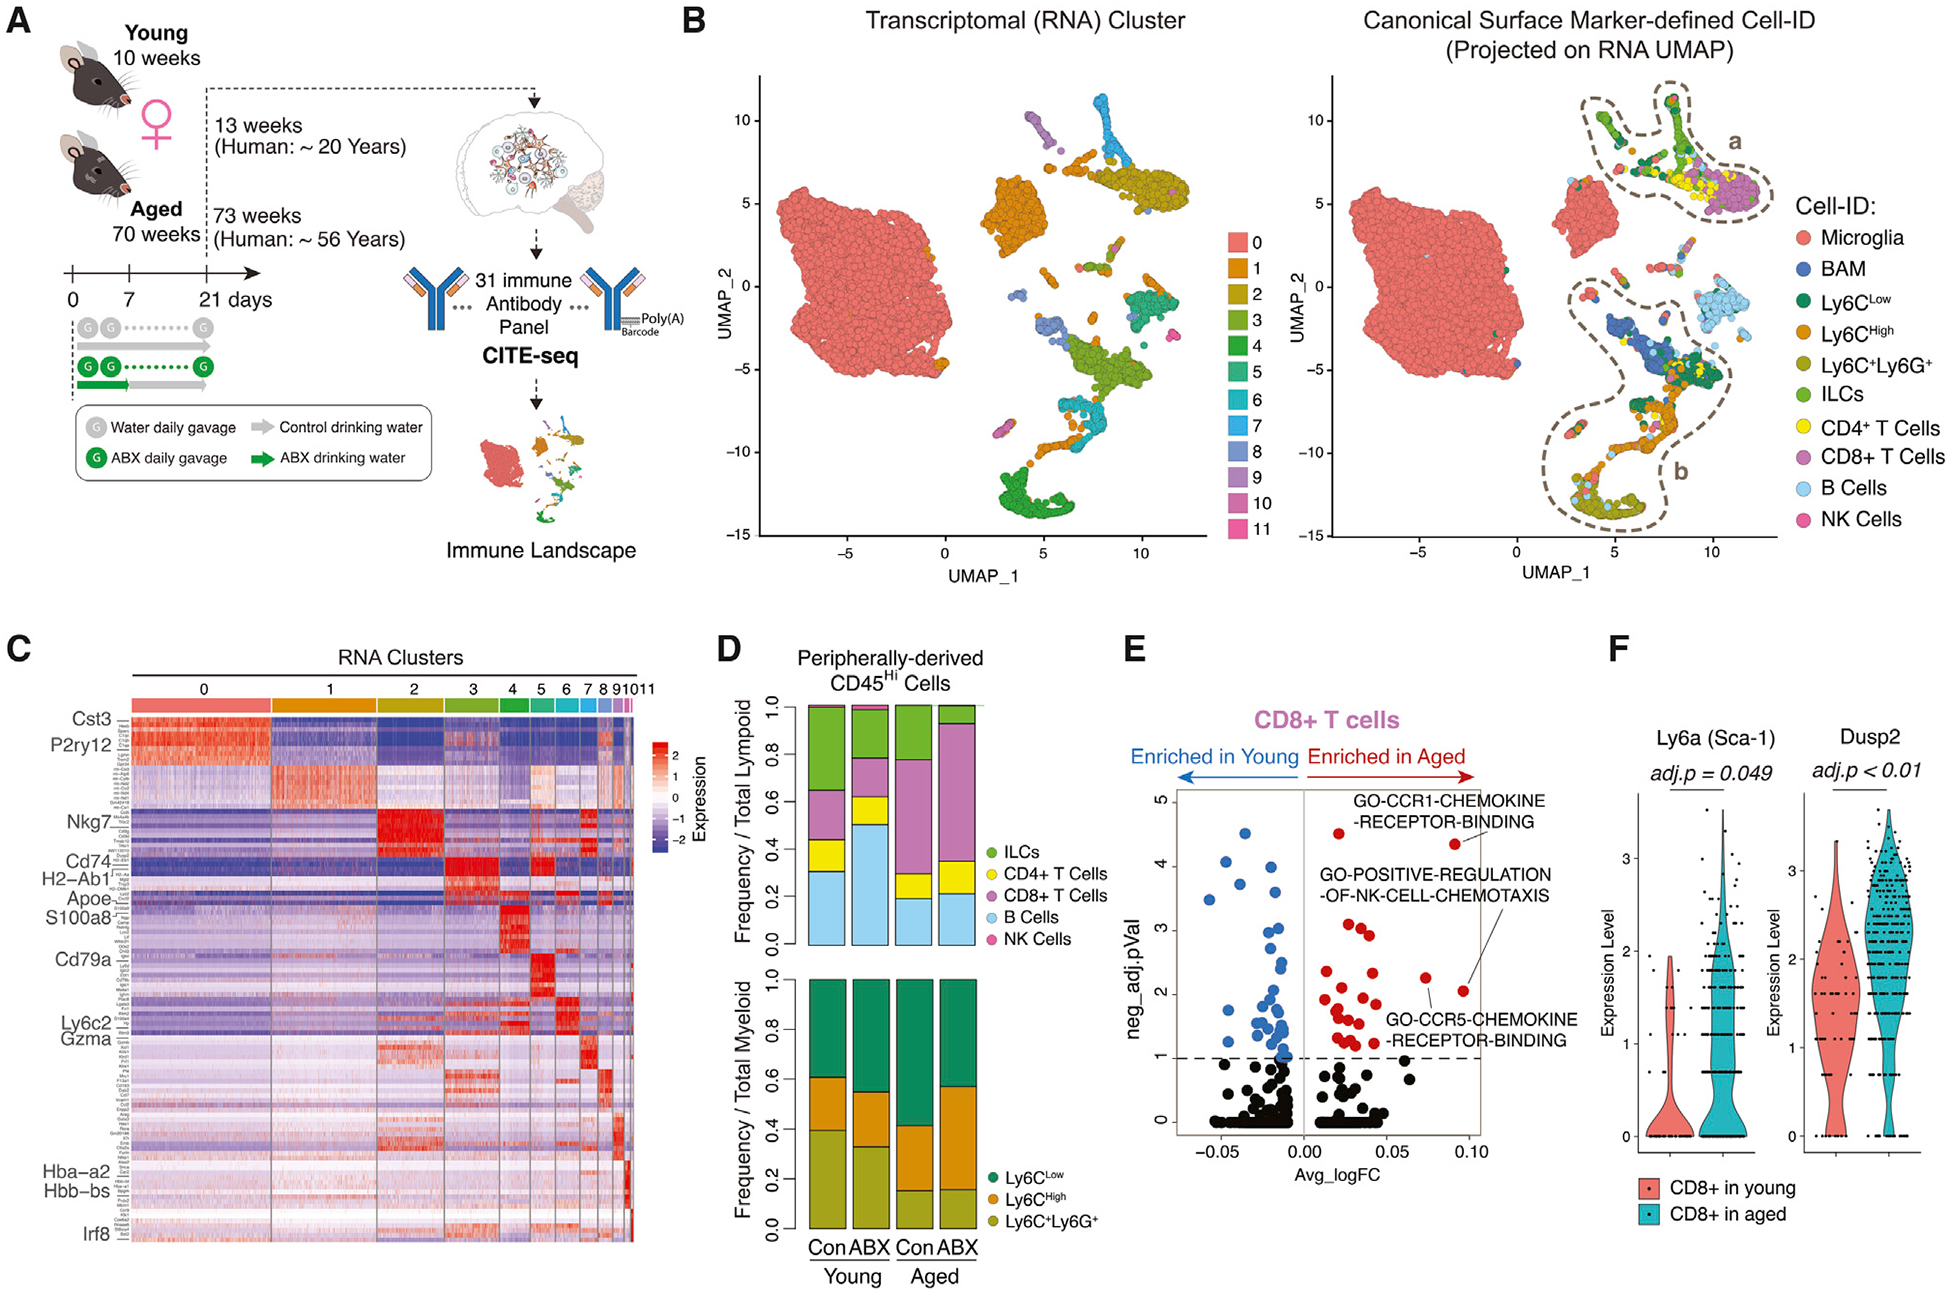
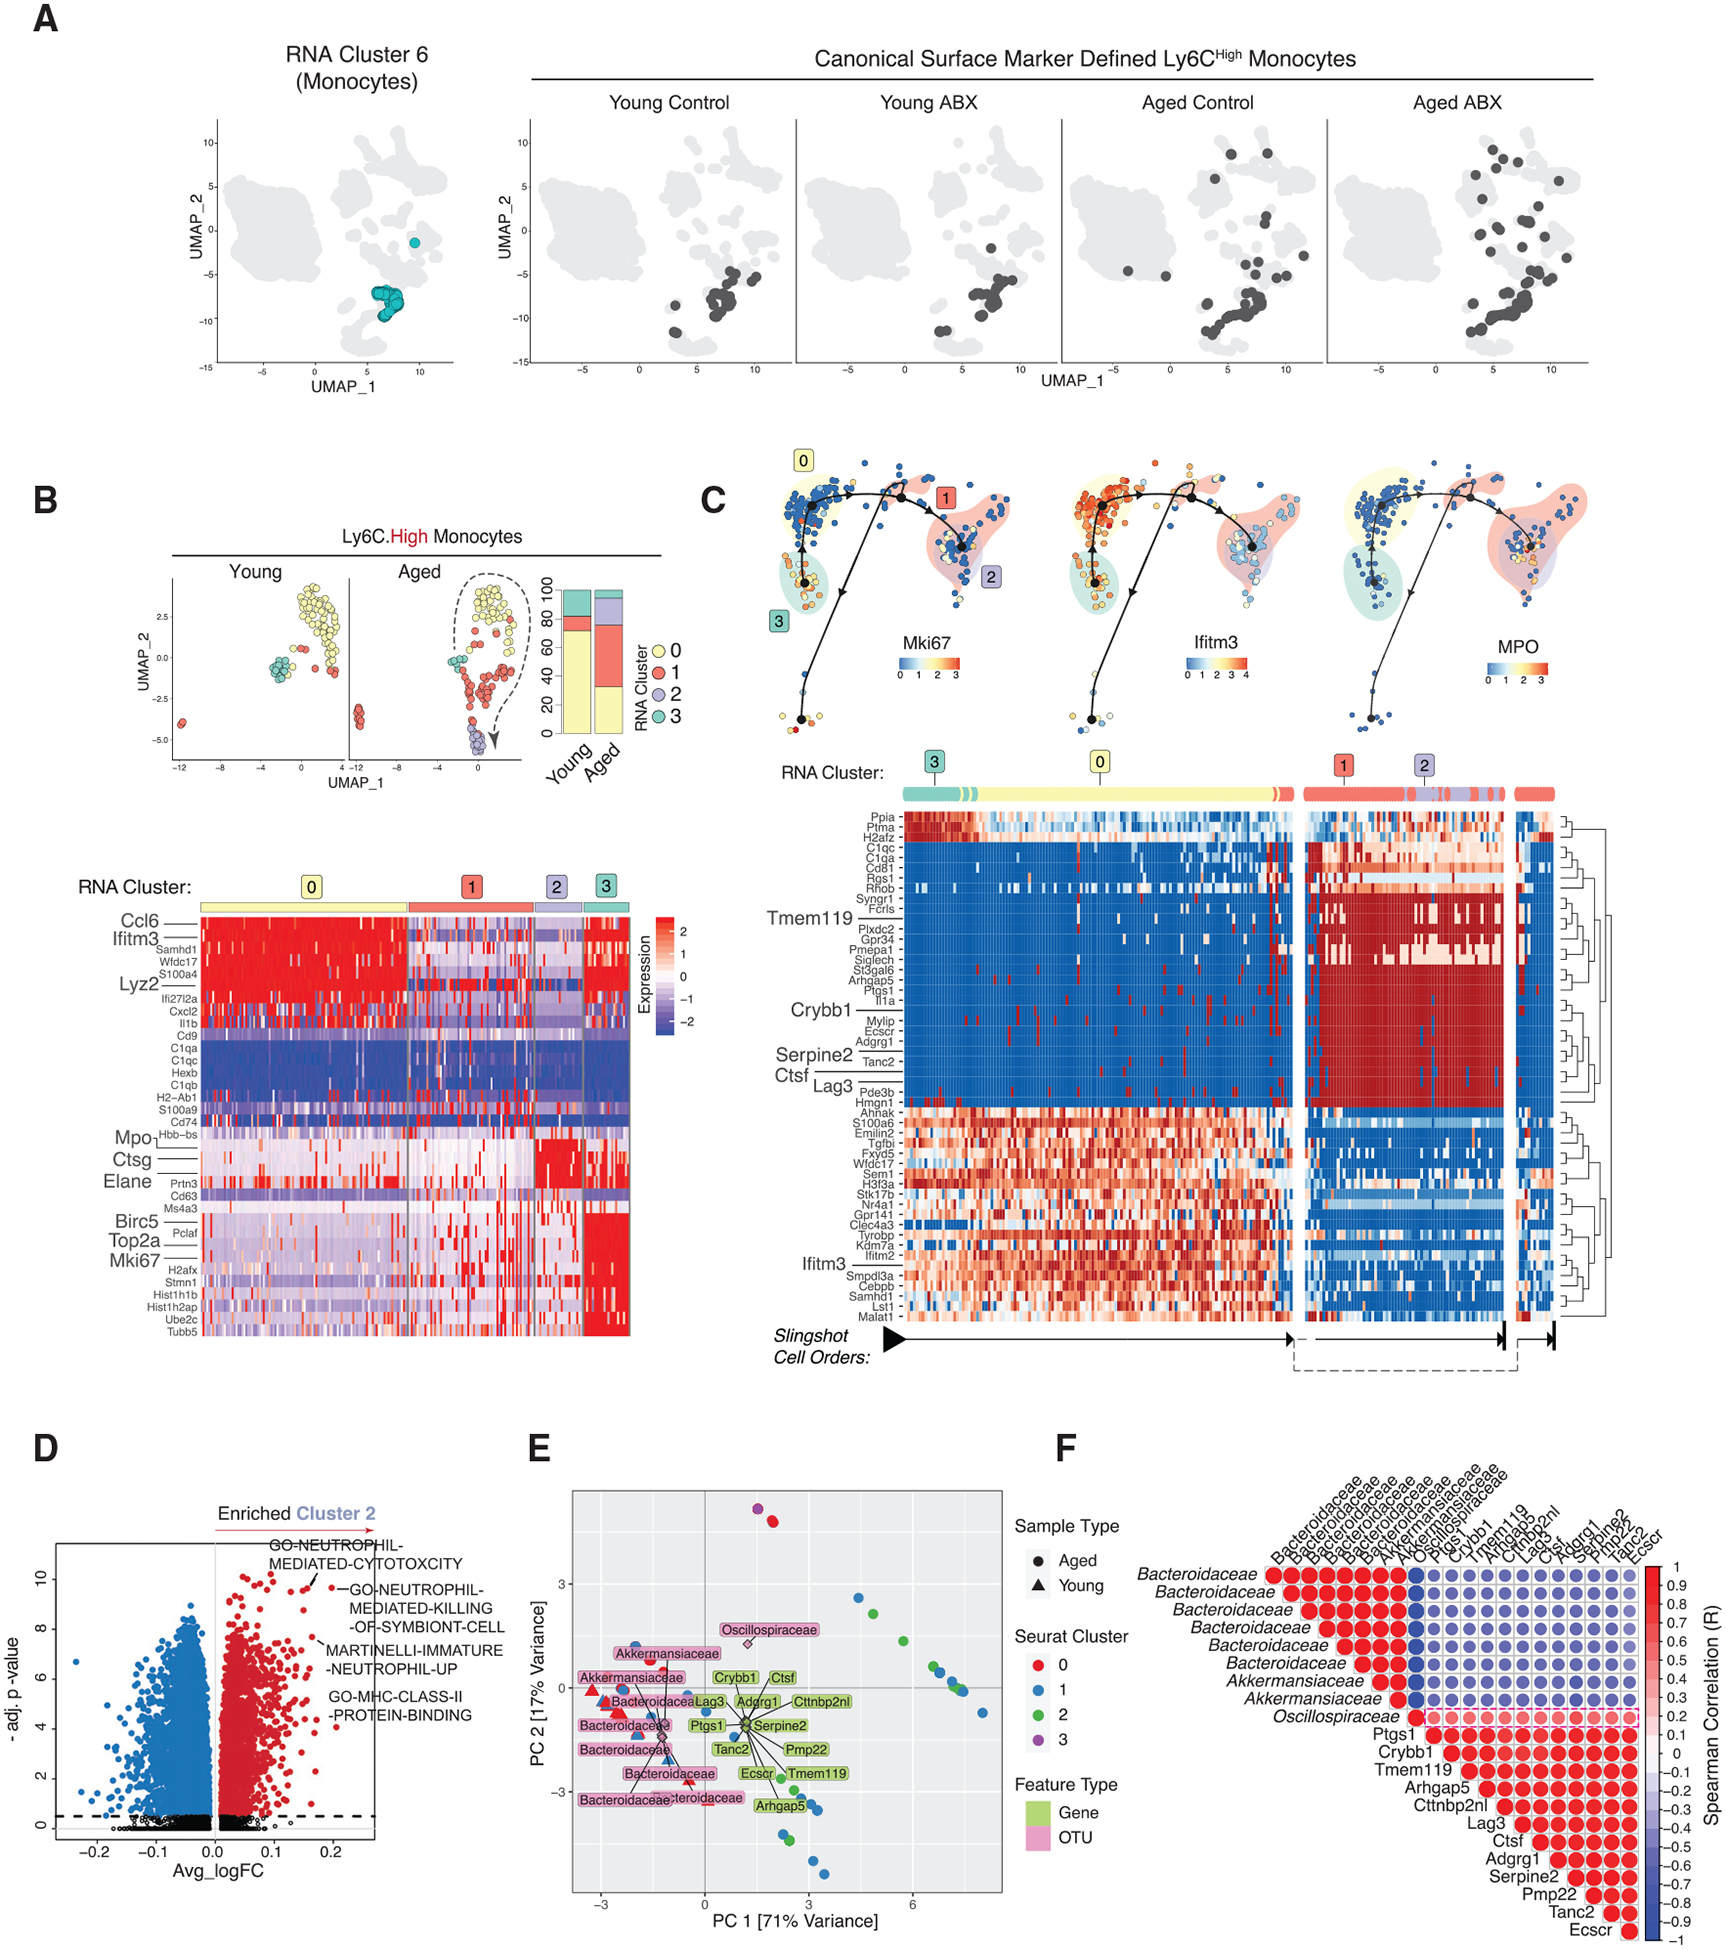
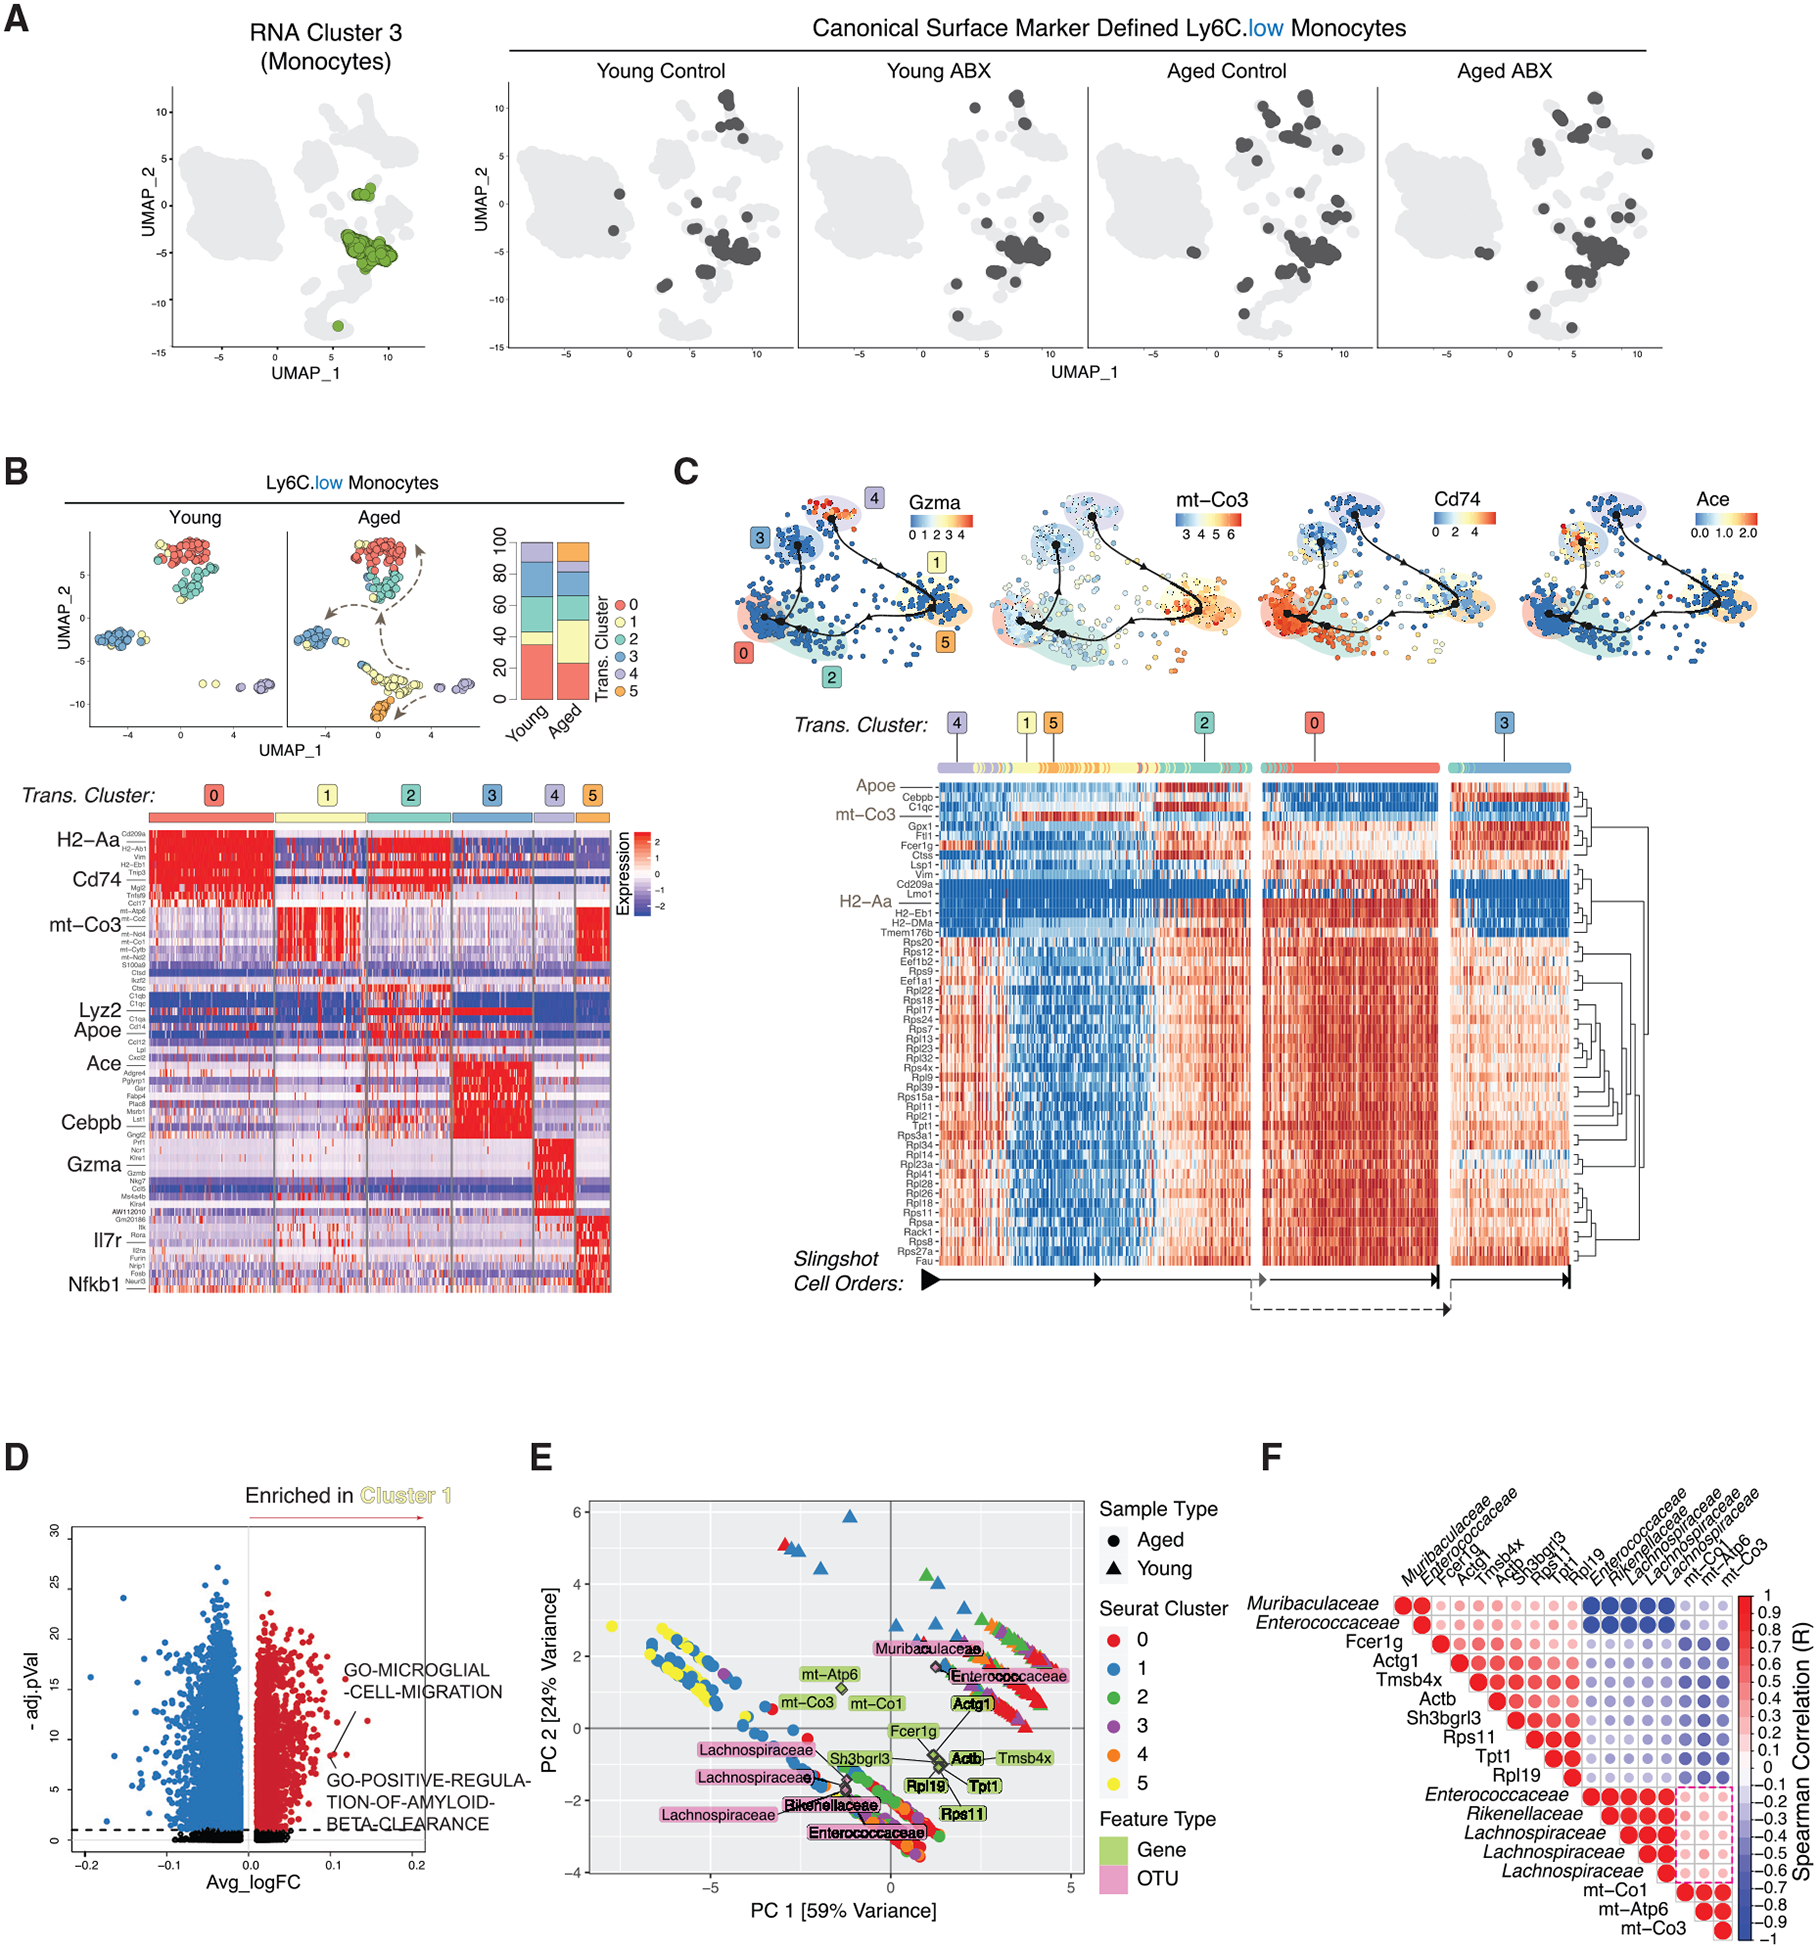
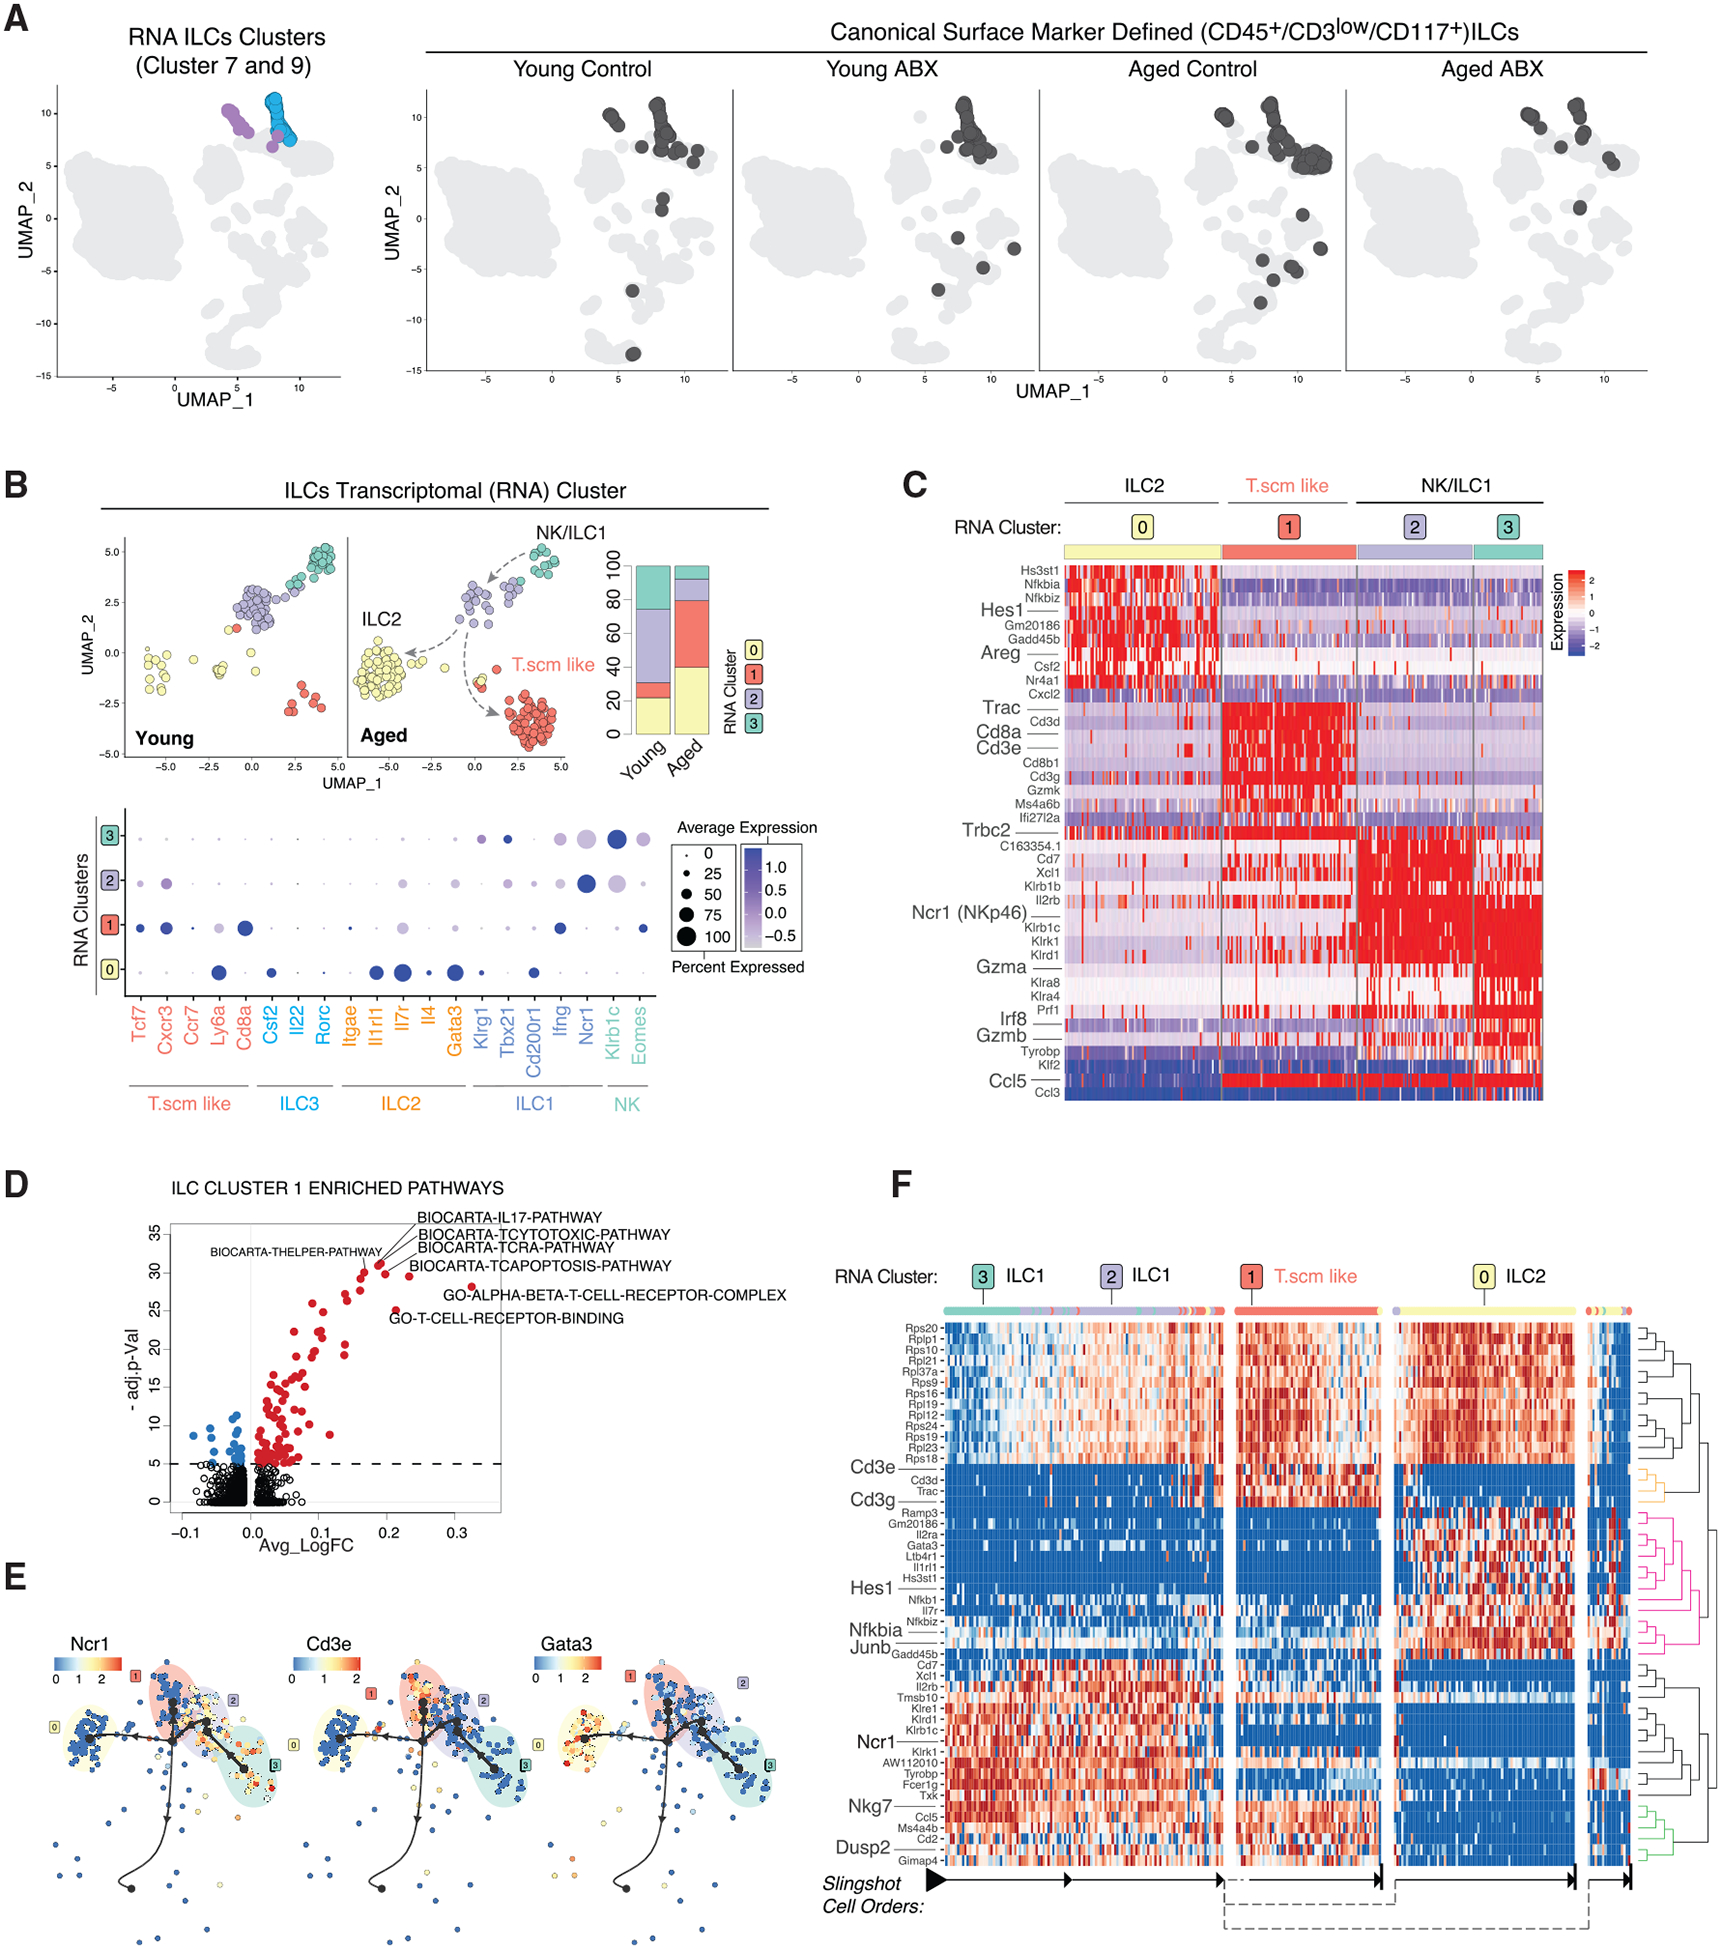
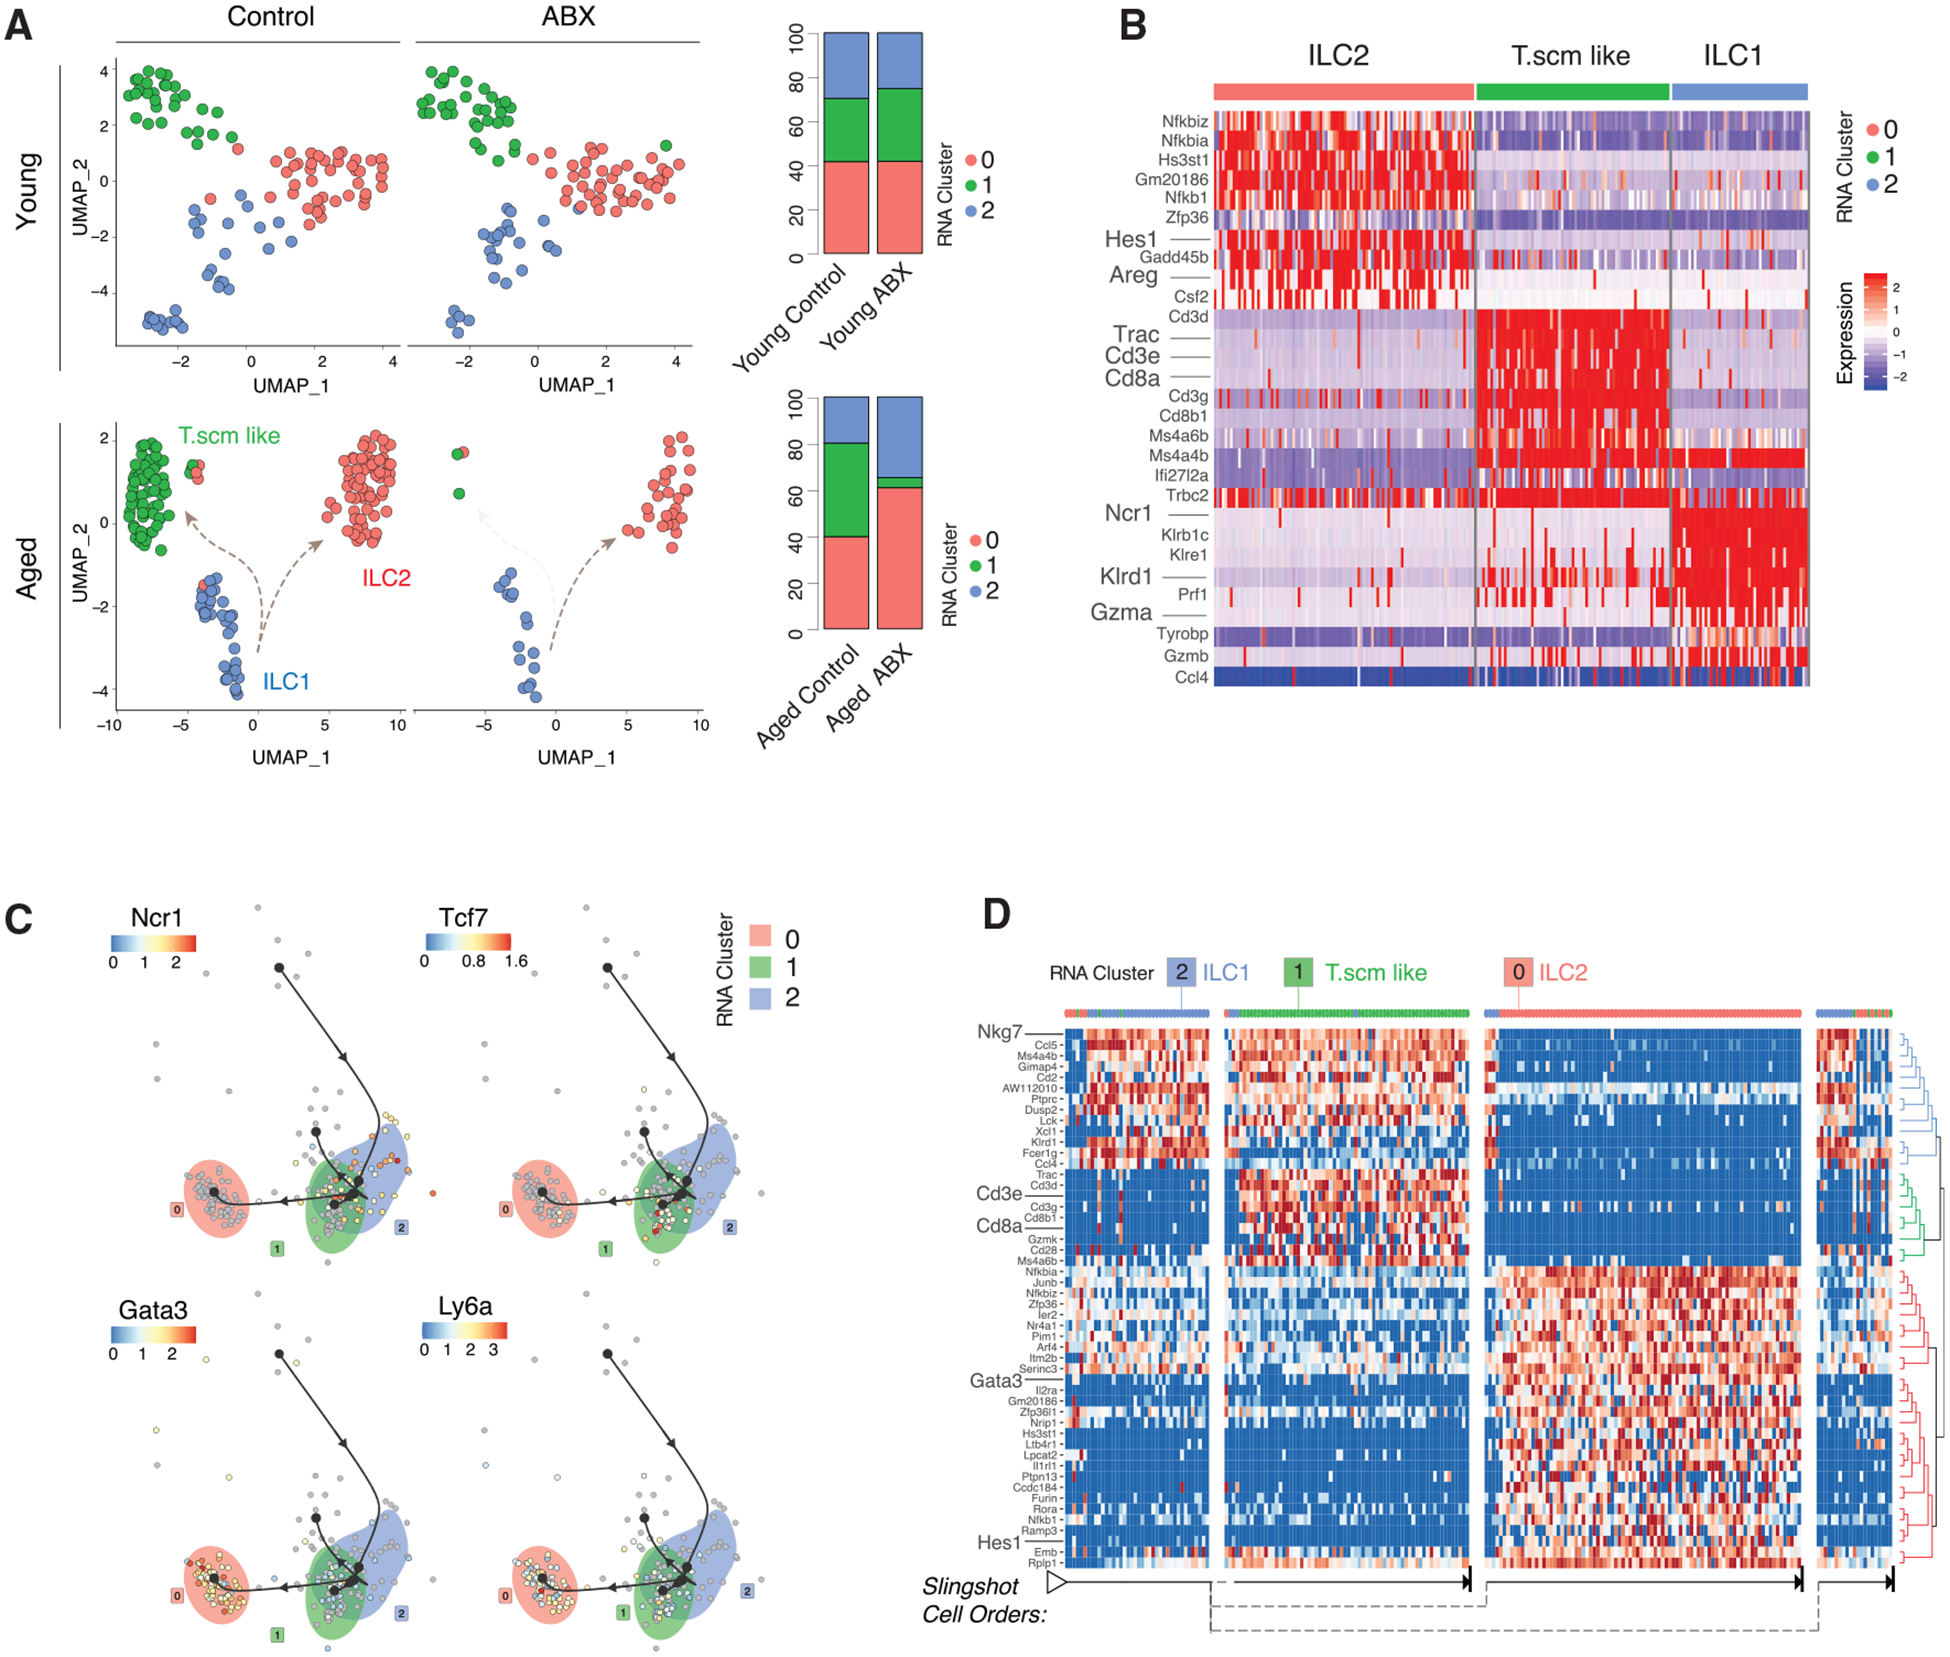
Phenotypic and functional plasticity of brain immune cells contribute to brain tissue homeostasis and disease. Immune cell plasticity is profoundly influenced by tissue microenvironment cues and systemic factors. Aging and gut microbiota dysbiosis that reshape brain immune cell plasticity and homeostasis has not been fully delineated. Using Cellular Indexing of Transcriptomes and Epitopes by sequencing (CITE-seq), we analyze compositional and transcriptional changes of the brain immune landscape in response to aging and gut dysbiosis. Discordance between canonical surface-marker-defined immune cell types and their transcriptomes suggest transcriptional plasticity among immune cells. Ly6C+ monocytes predominate a pro-inflammatory signature in the aged brain, while innate lymphoid cells (ILCs) shift toward an ILC2-like profile. Aging increases ILC-like cells expressing a T memory stemness (Tscm) signature, which is reduced through antibiotics-induced gut dysbiosis. Systemic changes due to aging and gut dysbiosis increase propensity for neuroinflammation, providing insights into gut dysbiosis in age-related neurological diseases.

Keywords: CITE-seq; CNS; aging; brain; brain immunity; dysbiosis; gut microbiota; single-cell sequencing.


Conflict of interest statement

declaration of interests The authors declare no competing interests.

Figures

Figure 1.
Figure 1.. CITE-Seq Delineates the Global Immune Cell Diversity in the Brain
(A) Schematic of experimental approach. (B) Single cells projected onto UMAP with cells color coded by transcriptional cluster ID (left). UMAP clustering as in left plot with cells color coded by canonical Cell-ID (right). Dashed circle (a) on peripheral lymphoid cell populations and dashed circle (b) on non-microglia myeloid cells are shown. (C) Heatmap of top differentially expressed genes (DEGs) per transcriptional cluster. (D) Stacked bar charts of peripheral lymphoid cells (top) and peripheral myeloid cells (bottom) frequencies (n = 3 biological replicates per group). (E) Volcano plot of differentially enriched gene pathways (DEGPs) in CD8+ T cells between aged and young. (F) Violin plots of Ly6a and Dusp2 expression in CD8+ T cells in young and aged (n = 3 biological replicates per group). All plots were derived from pooling three biological replicates per experimental condition. Data in (E) and (F) were analyzed by Wilcoxon rank-sum test. Also see Tables S1, S2, S3 and S4.
Figure 2.
Figure 2.. Aged Brain Is Enriched for Inflammation-Prone Brain-Resident Myeloid Cells
(A) UMAP clustering as in Figure 1B with Cell-ID microglia colored in pink (top) and with Cell-ID microglia colored by transcriptional clusters (bottom). (B) Stacked bar charts of Cell-ID microglia frequencies within transcriptional clusters (n = 3 biological replicates per group) (top). Volcano plot of DEGPs between RNA cluster 1 and RNA cluster 0 (bottom) is shown. (C) Heatmap with top 40 DEGs in Cell-ID microglia. (D) UMAP clustering as in Figure 1B with Cell-ID BAMs in blue (top) and with Cell-ID BAMs colored by transcriptional cluster ID (bottom). (E) Stacked bar charts of Cell-ID BAMs frequencies within transcriptional clusters (n = 3 biological replicates per group) (top). Volcano plot of DEGPs between RNA cluster 3 and RNA cluster 8 (bottom) is shown. (F) Heatmap with top 26 DEGs in Cell-ID BAMs. All plots were derived from pooling three biological replicates per experimental condition. Data in (B) and (E) were analyzed by Wilcoxon rank-sum test. Also see Tables S2, S3, and S4.
Figure 3.
Figure 3.. Innate Ly6CHigh Monocytes Show Microenvironment-Dependent Plasticity in Aged Brain
(A) UMAP clustering as in Figure 1B with RNA cluster 6 in turquoise (left) and with Cell-ID Ly6CHigh darkened (right, split by conditions). (B) Re-clustered young and aged Ly6CHigh cells on UMAP (top left) and stacked bar charts of cluster frequencies (n = 3 biological replicates per group) (top right) and heatmap of Ly6CHigh subcluster DEGs (bottom). (C) Trajectory of Ly6CHigh subclusters overlaid with indicated genes (top). Heatmap of trajectory DEGs in cluster ordering (bottom). Ordering is denoted by arrows at the bottom. (D) Volcano plot of DEGPs in Ly6CHigh subcluster 2 versus all other Ly6CHigh subclusters. (E) PCA triplot of sparse canonical correlation analysis (CCA) of microbiota families and Ly6CHigh DEGs in young and aged. Dots represent cells from aged and triangles represent cells from young. Ly6CHigh subclusters are represented by different colors. Gene names are in green and OTUs are in pink. (F) Gene-microbial family correlation plot. Red indicates positive and blue indicates negative correlation. All correlations have corr.test p < 0.01. All plots were derived from pooling three biological replicates per experimental condition. Data in (D) were analyzed by Wilcoxon rank-sum test. Also see Tables S2, S3, and S4.
Figure 4.
Figure 4.. Aged Brain Increases Ly6CLow Patrolling Monocyte Plasticity
(A) UMAP clustering as in Figure 1B with RNA cluster 3 in green (left) and with Cell-ID Ly6CLow darkened (right, split by conditions). (B) Re-clustered young and aged Ly6CLow cells on UMAP (top left) and stacked bar charts of cluster frequencies (n = 3 biological replicates per group) (top right). Heatmap of Ly6CLow subcluster DEGs (bottom) is shown. (C) Trajectory of Ly6CLow subclusters overlaid with indicated genes (top). Heatmap of trajectory DEGs in cluster ordering (bottom) is shown. Ordering is denoted by arrows at the bottom. (D) Volcano plot of DEGPs in Ly6CLow subcluster 1 versus all other Ly6CLow subclusters. (E) PCA triplot of sparse CCA of microbiota families and Ly6CLow DEGs in young and aged. Dots represent cells from aged and triangles represent cells from young. Ly6CLow subclusters are represented by different colors. Gene names are in green and OTUs are in pink. (F) Gene-microbial family correlation plot. Red indicates positive and blue indicates negative correlation. All correlations have corr.test p < 0.01. All plots were derived from pooling three biological replicates per experimental condition. Data in (D) were analyzed by Wilcoxon rank-sum test. Also see Tables S2, S3, and S4.
Figure 5.
Figure 5.. CNS Innate Lymphoid Cell Plasticity Reflects Chronic Neuroinflammation in the Aged Brain
(A) UMAP clustering as in Figure 1B highlighting RNA-based clusters 7 (blue) and 9 (purple) (left) and with Cell-ID ILCs darkened (right, split by conditions). (B) Re-clustered young and aged ILCs on UMAP. Plots split by young and aged (top left) and stacked bar charts of cluster frequencies (n = 3 biological replicates per group) (top right). Dot plot of ILC subcluster expression level (color scale) and percentage (size of dot) for indicated cell types and associated marker genes (bottom). (C) Heatmap of ILC subcluster DEGs. (D) Volcano plot of DEGPs in ILC subcluster 1 versus all other ILC subclusters. (E) Trajectory of ILC subclusters overlaid with indicated genes. (F) Heatmap of trajectory DEGs in cluster ordering. Ordering is denoted by arrows at the bottom. All plots were derived from pooling three biological replicates per experimental condition. Data in (D) were analyzed by Wilcoxon rank-sum test. Also see Tables S2 and S3.
Figure 6.
Figure 6.. ABX Treatment Alters ILC Plasticity Pattern in the Aged Mice
(A) Re-clustered young control and young ABX ILCs on UMAP (top left) and stacked bar charts of cluster frequencies (n = 3 biological replicates per group) (top right). Re-clustered aged control and aged ABX ILCs on UMAP (bottom left) and stacked bar charts of cluster frequencies (n = 3 biological replicates per group) (bottom right). (B) Heatmap of aged control and aged ABX ILC subcluster DEGs. (C) Trajectory of aged control and aged ABX ILC subclusters overlaid with indicated genes. (D) Heatmap of trajectory DEGs in cluster ordering. Ordering is denoted by arrows at the bottom. All plots were derived from pooling three biological replicates per experimental condition. Also see Tables S2, S3, and S4.

References

    1. Aibar S, González-Blas CB, Moerman T, Huynh-Thu VA, Imrichova H, Hulselmans G, Rambow F, Marine J-C, Geurts P, Aerts J, et al. (2017). SCENIC: single-cell regulatory network inference and clustering. Nat. Methods 14, 1083–1086. - PMC - PubMed
    1. Al-Mossawi H, Yager N, Taylor CA, Lau E, Danielli S, de Wit J, Gilchrist J, Nassiri I, Mahe EA, Lee W, et al. (2019). Context-specific regulation of surface and soluble IL7R expression by an autoimmune risk allele. Nat. Commun 10, 4575. - PMC - PubMed
    1. Arpaia N, Campbell C, Fan X, Dikiy S, van der Veeken J, deRoos P, Liu H, Cross JR, Pfeffer K, Coffer PJ, and Rudensky AY (2013). Metabolites produced by commensal bacteria promote peripheral regulatory T-cell generation. Nature 504, 451–455. - PMC - PubMed
    1. Auffray C, Sieweke MH, and Geissmann F (2009). Blood monocytes: development, heterogeneity, and relationship with dendritic cells. Annu. Rev. Immunol 27, 669–692. - PubMed
    1. Bachem A, Makhlouf C, Binger KJ, de Souza DP, Tull D, Hochheiser K, Whitney PG, Fernandez-Ruiz D, Dähling S, Kastenmüller W, et al. (2019). Microbiota-Derived Short-Chain Fatty Acids Promote the Memory Potential of Antigen-Activated CD8+ T Cells. Immunity 51, 285–297. - PubMed

Publication types