. 2020 Dec 1;33(9):108467.
doi: 10.1016/j.celrep.2020.108467.

Optogenetic Tuning Reveals Rho Amplification-Dependent Dynamics of a Cell Contraction Signal Network

Affiliations

Optogenetic Tuning Reveals Rho Amplification-Dependent Dynamics of a Cell Contraction Signal Network

Dominic Kamps et al. Cell Rep. .

Abstract

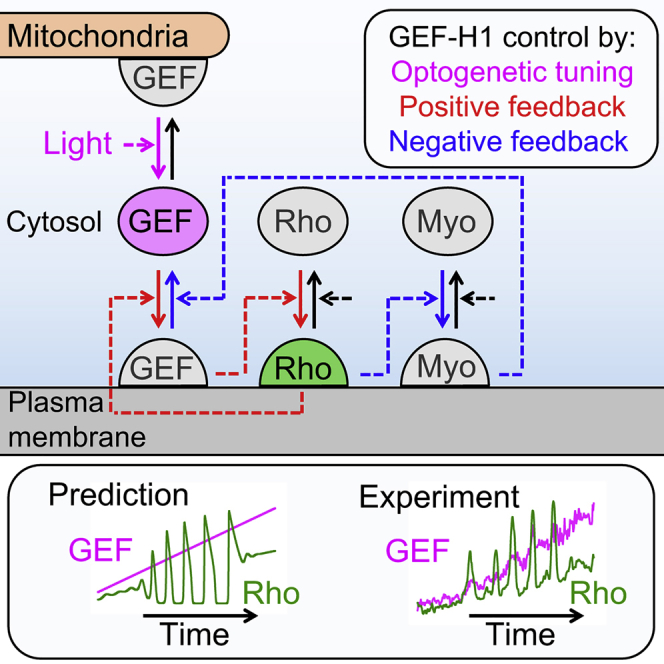
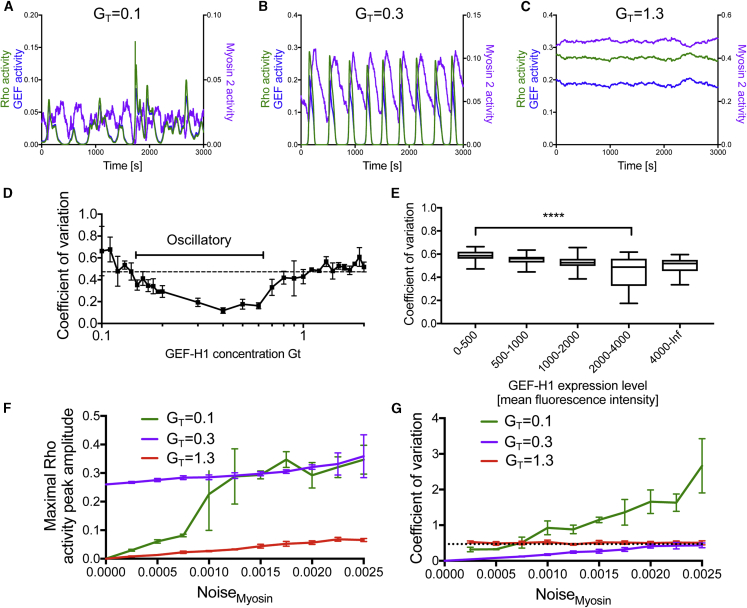
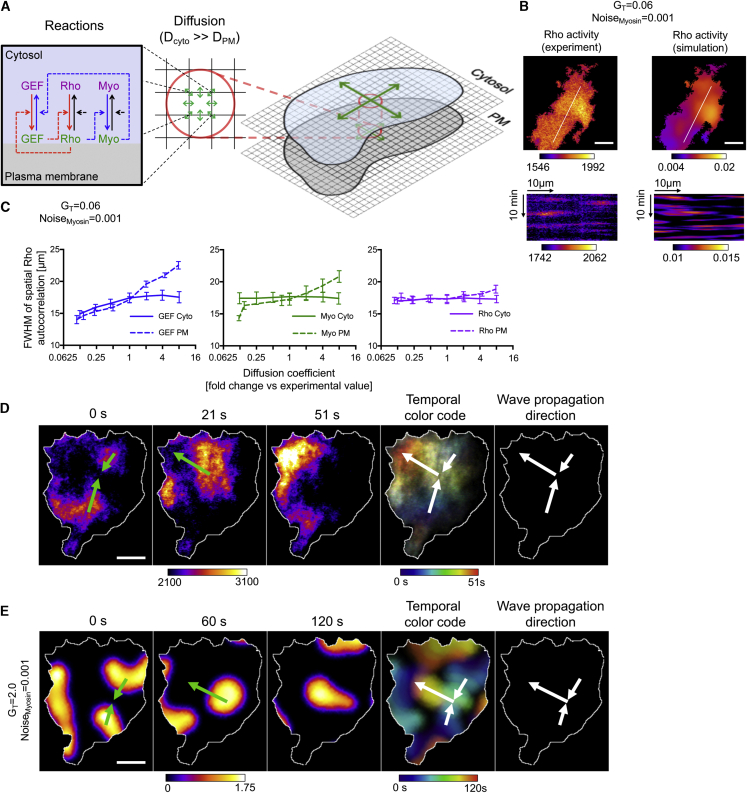
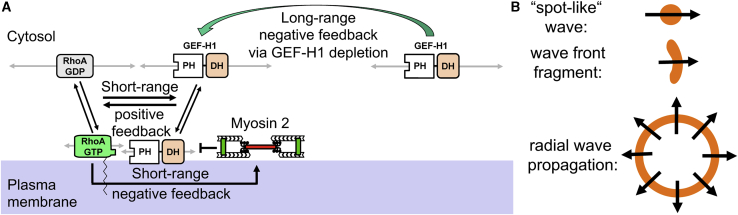
Local cell contraction pulses play important roles in tissue and cell morphogenesis. Here, we improve a chemo-optogenetic approach and apply it to investigate the signal network that generates these pulses. We use these measurements to derive and parameterize a system of ordinary differential equations describing temporal signal network dynamics. Bifurcation analysis and numerical simulations predict a strong dependence of oscillatory system dynamics on the concentration of GEF-H1, an Lbc-type RhoGEF, which mediates the positive feedback amplification of Rho activity. This prediction is confirmed experimentally via optogenetic tuning of the effective GEF-H1 concentration in individual living cells. Numerical simulations show that pulse amplitude is most sensitive to external inputs into the myosin component at low GEF-H1 concentrations and that the spatial pulse width is dependent on GEF-H1 diffusion. Our study offers a theoretical framework to explain the emergence of local cell contraction pulses and their modulation by biochemical and mechanical signals.

Keywords: cell contraction; cytoskeleton; dynamical system; mechanotransduction; myosin; optogenetics; oscillations; parameter inference; reaction-diffusion system; rho GTPase.


Conflict of interest statement

Declaration of Interests The authors declare no competing interests.

Figures

None
Graphical abstract
Figure 1
Figure 1
Direct Investigation of Rho-Dependent GEF-H1 Plasma Membrane Recruitment (A) TIRF image of a U2OS cell that expresses the Rho activity sensor mCherry-Rhotekin-GBD. Rho activity dynamics were stimulated by releasing GEF-H1 (ARHGEF2) from microtubules into the cytosol via nocodazole. (B) Kymographs corresponding to the yellow box in (A), which represent irregular, Rho activity dynamics before and after nocodazole application. (C) Schematic representation of acute chemo-optogenetic plasma membrane recruitment of active Rho. NvocTMP-Cl: photocaged chemical dimerizer; HaloTag/eDHFR: dimerization domains for chemo-optogenetic perturbation. (D) Representative TIRF images of chemo-optogenetic mTurquoise2-eDHFR-Rho Q63L plasma membrane recruitment and co-recruitment of Rho activity sensor (mCitrine-Rhotekin-GBD) and cytosolic, microtubule-binding deficient GEF-H1(C53R) mutant fused to mCherry (see also Video S1). (E and F) Quantification of co-recruitment of RhoA constructs, Rho activity or control sensors, and GEF-H1(C53R) or GEF-H1 PH domain (percentage increase above average intensity before photoactivation at t = 0 s with standard error of the mean (SEM); n ≥ 10 (E) or n ≥ 15 (F) cells from 3 experiments; ∗∗p ≤ 0.01; ∗∗∗p ≤ 0.001; ∗∗∗∗p ≤ 0.0001; paired t test before and 10 s after photoactivation. Scale bars: 10 μm. See also Figure S1.
Figure 2
Figure 2
Parameterization and Analysis of a Temporal Model for Cell Contraction Signal Network Dynamics (A) A biochemical reaction scheme for positive and negative feedback regulation of Rho activity. GEF-H1 mediates positive feedback (highlighted in red) and myosin (non-muscle myosin-IIa, MYH9) mediates negative feedback (highlighted in blue). E, enzymatic reaction, MA, mass action, C, cytosolic, PM, plasma membrane-associated (a detailed description of the model and a justification of the specific implementation is given in Method Details). (B) A schematic representation of improved molecular activity painting, a simplified, generic method for immobilized chemo-optogenetic plasma membrane recruitment and its application to introduce acute and stable GEF-H1 perturbations (see Method Details). (C) TIRF images of immobilized GEF-H1(C53R) perturbation and Rho sensor response (see also Video S2). (D) Kinetics of Rho activity sensor and myosin cell cortex recruitment response to acute chemo-optogenetic GEF-H1 perturbations and the corresponding numerical simulations of system dynamics using Equations 1, 2, and 3 (n ≥ 20 cells from at least 3 experiments, means and SEMs). (E) TIRF images of U2OS cells, in which cytosolic GEF-H1 levels were increased by nocodazole-induced microtubule depolymerization (see also Video S3). (F) Kymograph corresponding to the yellow line shown in (E) to visualize regular pulses of Rho activity followed by myosin cell cortex recruitment. (G) Quantification of experimentally measured Rho activity and myosin cell cortex recruitment pulse dynamics corresponding to the yellow box in (E), and corresponding numerical simulations of system dynamics. (H) Two parameter bifurcation analysis of Equations 1, 2, and 3 to predict total concentration ranges of the positive and negative feedback mediators GEF-H1 and myosin, which can generate stable or oscillatory system dynamics. (I) One parameter bifurcation analysis of Rho activity dynamics predicts limit cycle oscillations at intermediate GEF-H1 concentrations (subcritical Hopf bifurcations at GT = 0.1557 and GT = 0.6215). (J) Simulations of Rho activity dynamics predict maximal Rho activity peak amplitude at intermediate GEF-H1 concentrations. (K) Experimental confirmation of maximal Rho activity peak amplitude at intermediate GEF-H1(C53R) expression levels (percentage of signal above background; n = 124 cells from 3 experiments; means and SEMs; ∗∗∗1-way ANOVA, Dunnett’s post test, p < 0.001). Scale bars: 10 μm. See also Figures S2 and S3.
Figure 3
Figure 3
Model Prediction and Experimental Confirmation of GEF-H1 Concentration-Dependent Switching of Rho Activity Dynamics by Optogenetic Tuning (A) A schematic representation of GEF-H1 release from mitochondria to tune the effective cytosolic GEF-H1 concentration with light. (B) Simulation of Rho activity dynamics with linearly increasing total concentration of GEF-H1 (GT). (C–F) The dependence of Rho sensor activity dynamics on the effective, cytosolic GEF-H1 concentration was analyzed in U2OS cells expressing the LOV domain targeted to mitochondria (TOM20-LOV2), mCherry-Zdk1-GEF-H1(C53R), and a Rho sensor (mCitrine-Rhotekin-GBD). (C–E) Analysis of a representative cell. (C) Top: TIRF images of mCherry-Zdk1-GEF-H1(C53R) and the Rho sensor (see also Video S4). Bottom: kymographs corresponding to green arrows in top panel. Yellow arrows point to Rho activity pulses, cyan arrows point to Rho activity waves. (D) Cytosolic mCherry-Zdk1-GEF-H1(C53R) levels obtained as the minimum signal in green boxed regions in (C), and measurements of the Rho activity sensor signal over the time course of the experiment. (E) The local standard deviation of Rho activity signals over the time course of the experiment, using a shifting time-interval of 15 frames, average of all central cell regions of the cell shown in (C), and cytosolic mCherry-Zdk1-GEF-H1(C53R) levels (moving average of 15 frames corresponding to 2.5 min). (F) Plot of local standard deviation of Rho activity signals against cytosolic mCherry-Zdk1-GEF-H1(C53R) levels from all of the analyzed cells (n = 23 cells from 3 experiments). Lines connect 3 data points that represent the following time intervals of optogenetic tuning experiments: the average of the initial 10 frames, the intermediate frames, and the last 10 frames. Lines with net increase of local Rho activity standard deviation are in green, lines with net decrease are in magenta. (E and F) Percentage (%) indicates percentage of mean intensity. Scale bars: 10 μm. See also Figure S4.
Figure 4
Figure 4
Sensitivity of Rho Activity Pulses to Stochastic Myosin Inputs Numerical simulations of the system of stochastic differential equations (Equations 4, 5, and 6) that include extrinsic additive noise in the myosin component to represent extracellular and intracellular inputs. (A–C) SDE simulations at low (A), intermediate (B), and high (C) cytosolic concentrations of GEF-H1 (GT). (D) Measurement of the coefficient of variation (CV) of the Rho activity interpeak distance in SDE simulations at various cytosolic concentrations of GEF-H1 (GT). The black bar indicates the range of GT that generates oscillatory dynamics in the absence of noise. (E) Measurement of the CV of the Rho activity interpeak distance in experiments at varying expression levels of active, microtubule-binding deficient GEF-H1(C53R) mutant (n = 91 cells from 3 experiments; box and whisker plot; ∗∗∗∗1-way ANOVA, Dunnett’s post test, p < 0.0001). (F) Dependence of maximal Rho activity peak amplitude on extrinsic noise levels in the myosin component (Noisemyosin) at low, intermediate, and high GEF-H1 concentrations (GT). (G) Dependence of the CV of the Rho activity interpeak distance on extrinsic noise levels in the myosin component at low, intermediate, and high GEF-H1 concentrations (GT). Dotted black line in (D) and (G): CV of Gaussian input noise. (D), (F), and (G): mean and SD from 3 independent simulations.
Figure 5
Figure 5
Spatial Patterning of Rho Activity Dynamics (A) Schematic representation of the cellular automata model. Reactions (left) are simulated within individual discrete regions. Mass transfer between these regions is simulated based on fast and slow diffusive mobility of the cytosolic and plasma membrane-associated components (center). Cytosolic and plasma membrane regions of cells are represented by two 2-dimensional (2D) arrays of discrete spatial regions (right). (B) Experimentally observed Rho activity sensor signals in U2OS cells obtained via TIRF microscopy (left panels) and numerical simulations of Rho activity obtained by using a cellular automata model (right panels). Top panels: representative time frame from experiments and simulations (see also Video S6); bottom panels: kymographs corresponding to white lines in top panels. Cells co-express the Rhotekin-GBD sensor and GEF-H1(C53R). The representative cell shown in this panel expresses GEF-H1(C53R) at low levels. (C) Measurement of spatial Rho activity pulse width by fitting a 2D Gaussian to the spatial autocorrelation function of cellular automata simulations. Shown is the full width at half maximum (FWHM) of the Gaussian fit from simulations performed after multiplying diffusion coefficients with varying factors (mean and SD from 8 independent simulations). (D) Example for experimental observation of 2 focused wave fragments that fuse and change their shape and propagation direction. Cells co-express the mCherry-Rhotekin-GBD sensor and EGFP-GEF-H1. The representative cell shown in this panel expresses GEF-H1 at intermediate levels (see also Video S7). (E) Cellular automata simulation of Rho activity dynamics shows similar activity patterns as shown in (D). Scale bars: 10 μm.
Figure 6
Figure 6
Proposed Pattern Formation Mechanism That Generates Rho Activity Pulses and Waves (A) Slow-diffusing active Rho and myosin near the plasma membrane and fast-diffusing inactive components in the cytosol form a reaction-diffusion system (RDS; Equations 7, 8, 9, 10, 11, and 12) that includes short-range positive and negative feedback, as well as a long-range negative feedback via substrate depletion (green arrow). Gray arrows: diffusion; black arrows: translocations and reactions. (B) Schematic representation of propagating focused spot-like waves and focused wave fragments, as opposed to radial wave propagation, which does not require a long-range spatial focusing mechanism.

References

    1. Baird M.A., Billington N., Wang A., Adelstein R.S., Sellers J.R., Fischer R.S., Waterman C.M. Local pulsatile contractions are an intrinsic property of the myosin 2A motor in the cortical cytoskeleton of adherent cells. Mol. Biol. Cell. 2017;28:240–251. - PMC - PubMed
    1. Beck M., Schmidt A., Malmstroem J., Claassen M., Ori A., Szymborska A., Herzog F., Rinner O., Ellenberg J., Aebersold R. The quantitative proteome of a human cell line. Mol. Syst. Biol. 2011;7:549. - PMC - PubMed
    1. Belousov B.P. Периодически действующая реакция и ее механизм [Periodically acting reaction and its mechanism] In: Field R.J., Burger M., editors. Сборник рефератов по радиационной медицине [Collection of Abstracts on Radiation Medicine] Medgiz; 1959. pp. 145–147.
    1. Bement W.M., Leda M., Moe A.M., Kita A.M., Larson M.E., Golding A.E., Pfeuti C., Su K.C., Miller A.L., Goryachev A.B., von Dassow G. Activator-inhibitor coupling between Rho signalling and actin assembly makes the cell cortex an excitable medium. Nat. Cell Biol. 2015;17:1471–1483. - PMC - PubMed
    1. Brangwynne C.P., Koenderink G.H., MacKintosh F.C., Weitz D.A. Cytoplasmic diffusion: molecular motors mix it up. J. Cell Biol. 2008;183:583–587. - PMC - PubMed

Publication types

Substances

LinkOut - more resources