. 2021 Jan:38:101808.
doi: 10.1016/j.redox.2020.101808. Epub 2020 Nov 25.

Cyclobutane pyrimidine dimers from UVB exposure induce a hypermetabolic state in keratinocytes via mitochondrial oxidative stress

Affiliations

Cyclobutane pyrimidine dimers from UVB exposure induce a hypermetabolic state in keratinocytes via mitochondrial oxidative stress

Csaba Hegedűs et al. Redox Biol. 2021 Jan.

Abstract

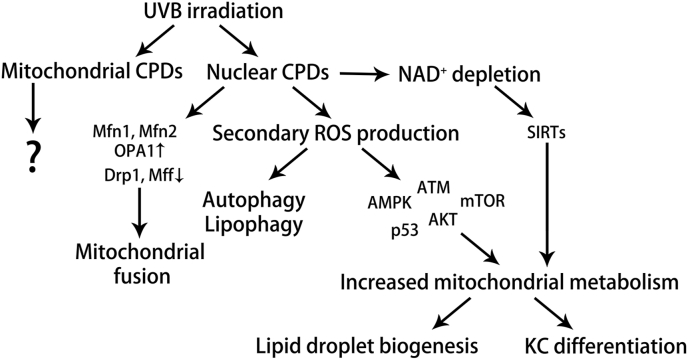
Ultraviolet B radiation (UVB) is an environmental complete carcinogen, which induces and promotes keratinocyte carcinomas, the most common human malignancies. UVB induces the formation of cyclobutane pyrimidine dimers (CPDs). Repairing CPDs through nucleotide excision repair is slow and error-prone in placental mammals. In addition to the mutagenic and malignancy-inducing effects, UVB also elicits poorly understood complex metabolic changes in keratinocytes, possibly through CPDs. To determine the effects of CPDs, CPD-photolyase was overexpressed in keratinocytes using an N1-methyl pseudouridine-containing in vitro-transcribed mRNA. CPD-photolyase, which is normally not present in placental mammals, can efficiently and rapidly repair CPDs to block signaling pathways elicited by CPDs. Keratinocytes surviving UVB irradiation turn hypermetabolic. We show that CPD-evoked mitochondrial reactive oxygen species production, followed by the activation of several energy sensor enzymes, including sirtuins, AMPK, mTORC1, mTORC2, p53, and ATM, is responsible for the compensatory metabolic adaptations in keratinocytes surviving UVB irradiation. Compensatory metabolic changes consist of enhanced glycolytic flux, Szent-Györgyi-Krebs cycle, and terminal oxidation. Furthermore, mitochondrial fusion, mitochondrial biogenesis, and lipophagy characterize compensatory hypermetabolism in UVB-exposed keratinocytes. These properties not only support the survival of keratinocytes, but also contribute to UVB-induced differentiation of keratinocytes. Our results indicate that CPD-dependent signaling acutely maintains skin integrity by supporting cellular energy metabolism.

Keywords: CPD; Keratinocyte; Mitochondria; Photolyase mRNA; UVB.


Conflict of interest statement

G.P. is a consultant for ADC Therapeutics and Buffalo Biolabs. Other authors declare no conflict of interest. The funders had no role in the design of the study, the collection, analyses, or interpretation of data, in the writing of the manuscript, or in the decision to publish the results.

Figures

Image 1
Graphical abstract
Fig. 1
Fig. 1
Photolyase activation prevents UVB-induced DNA damage and restores cell viability HaCaT keratinocytes (n = 2 × 105 cell) were treated with 20 or 40 mJ/cm2 UVB, then cells were harvested. CPD formation from (a) genomic and (b) mitochondrial DNA was measured by CPD ELISA (n = 3) after UVB exposure, as indicated. (c) Cell viability was assessed by Annexin V-Alexa-488 and Propidium iodide labeling (n = 5) 24 after UVB exposure. (d) Cells were harvested 24 h post-irradiation and a clonogenic assay was performed (5000 cells/dish, n=4). (e) Cell cycle progression was assessed by Propidium Iodide incorporation (n = 4) 24 after UVB exposure. - represents where photolyase is inactive, + represents where photolyase is active *; **, and *** indicate statistically significant differences at p < 0.05, p < 0.01, and p < 0.001 between dark non-irradiated and dark UVB-irradiated samples. #, ##, and ### indicate statistically significant differences at p < 0.05, p < 0.01, and p < 0.001 between dark and light (photoreactivated) samples. Data are presented as mean ± SEM. Significance was calculated using one-way ANOVA complemented by Sidak's multiple comparisons post-hoc test.
Fig. 2
Fig. 2
CPD removal reprograms the cellular energy sensor system HaCaT keratinocytes (n = 2 × 105 cell) were treated with 20 or 40 mJ/cm2 UVB, then cells were harvested. (a) Total cellular NAD+ content was determined by colorimetric assay 24 h post-UVB (n = 3). (b) The time-course of PARP activity (PAR) was analyzed by Western blotting (n = 3). Brightness and contrast were adjusted. Total PAR was normalized to the loading control β-actin. The uncut 10H blot is shown in Fig. S2a. (c) Expression levels of Sirtuin enzyme family members were analyzed by Western blotting 24 h post-UVB (n = 4). Brightness and contrast were adjusted. Proteins of interest were normalized to the loading control β-actin. (d) The phosphorylation of ATM, AMPK, p53, AKT, and p70S6K1 was analyzed by Western blotting (n ≥ 3). Brightness and contrast were adjusted. Proteins of interest were normalized to the loading control β-actin. *; **, and *** indicate statistically significant differences at p < 0.05, p < 0.01, and p < 0.001 between dark non-irradiated and dark UVB-irradiated samples. #; ##, and ### indicate statistically significant differences at p < 0.05, p < 0.01, and p < 0.001 between dark and light (photoreactivated) samples. Data are presented as mean ± SEM. Significance was calculated using one-way ANOVA complemented by Sidak's multiple comparisons post-hoc test. Densitometry is shown in Figs. S2B and c. In panel D, densitometry values were logarithmically transformed to achieve normal distribution for SIRT1 and SIRT5.
Fig. 3
Fig. 3
CPDs induce mitochondrial fusion in HaCaT keratinocytes (n = 2 × 105 cell) were treated with 20 or 40 mJ/cm2 UVB, then cells were harvested. (a) Cells were labeled with Mitotracker Red CMXRos dye after the indicated treatments. Representative confocal microscopic images are shown. (b) Mitochondrial morphological subtypes (tubular, intermediate, and fragmented) were quantified based on confocal microscopic images (a minimum of 100 cells were evaluated). (c) Mitochondrial parameters were quantified by ImageJ software (n = 5). (d) The expression of Mfn1, Mfn2, and OPA1, which are responsible for mitochondrial fusion, were analyzed by Western blotting (n = 4). The expression of Drp1, Mff, and PINK1, which are responsible for mitochondrial fission, were analyzed by Western blotting (n = 2). Brightness and contrast were adjusted. Proteins of interest were normalized to the loading control β-actin. *; **, and *** indicate statistically significant differences at p < 0.05, p < 0.01, and p < 0.001 between dark non-irradiated and dark UVB-irradiated samples. #; ##, and ### indicate statistically significant differences at p < 0.05, p < 0.01, and p < 0.001 between dark and light (photoreactivated) samples. Data are presented as mean ± SEM. Significance was calculated using one-way ANOVA complemented by Sidak's multiple comparisons post-hoc test. The frequency of mitochondrial morphological subtypes (fragmented, intermediate, and tubular) was calculated using a chi2 test. Densitometry is shown in Fig. S3. (For interpretation of the references to color in this figure legend, the reader is referred to the Web version of this article.)
Fig. 4
Fig. 4
CPDs induce hypermetabolism For panels a to e 2 × 105 HaCaT keratinocytes were treated with 20 or 40 mJ/cm2 UVB. From panels d, f-g 2 × 104 HaCaT keratinocytes were treated with 20 or 40 mJ/cm2 UVB. Mitochondrial biogenesis was quantified using (a) Mitotracker Green labeling, representing mitochondrial mass (n = 3) and (b) the ratio of MTCO1 and SDHA expression (n = 4). (c) Mitochondrial membrane potential (n = 3) was assessed by Mitotracker Red CMXRos incorporation. (d) Basal ECAR representing glycolysis, (f) basal OCR representing total oxidative phosphorylation, and (g) oligomycin-resistant respiration were measured using an XF96 instrument in XF medium supplemented with 10 mM glucose (n = 3). (e) Citrate synthase activity, representing TCA cycle activity, was evaluated using a citrate synthase kit (n = 4). *; **, and *** indicate statistically significant differences at p < 0.05, p < 0.01, and p < 0.001 between dark non-irradiated and dark UVB-irradiated samples. #; ##, and ### indicate statistically significant differences at p < 0.05, p < 0.01, and p < 0.001 between dark and light (photoreactivated) samples. Data are presented as mean ± SEM. Significance was calculated using one-way ANOVA complemented by Sidak's multiple comparisons post-hoc test. In panel G, values were logarithmically transformed to achieve normal distribution. (For interpretation of the references to color in this figure legend, the reader is referred to the Web version of this article.)
Fig. 5
Fig. 5
CPDs modulate substrate oxidation profile From panels a to i 2 × 104 HaCaT keratinocytes were treated with 40 mJ/cm2 UVB. From panel j, 2 × 104 HaCaT keratinocytes were treated with 20 or 40 mJ/cm2 UVB. From panel k, 2 × 105 HaCaT keratinocytes were treated with 20 or 40 mJ/cm2 UVB. (a–c) Pyruvate, (d–f) glutamine, and (g–i) fatty acid utilization were analyzed using a Mitofuel Flex test kit on the Seahorse XF96 instrument with the addition of BPTES, Etomoxir, and UK-5099 after 40 mJ/cm2 UVB dose (n = 6). (j) Endogenous (BSA treatment) and exogenous (palmitate treatment) beta oxidation were measured using the XF96 instrument in FAO assay medium (n = 4). (k) CPT1A, HADHA, and ACADM expression levels were assessed by Western blotting (n = 3). Brightness and contrast were adjusted. Proteins of interest were normalized to the loading control β-actin. *; **, and *** indicate statistically significant differences at p < 0.05, p < 0.01, and p < 0.001 between dark non-irradiated and dark UVB-irradiated samples. #; ##, and ### indicate statistically significant differences at p < 0.05, p < 0.01, and p < 0.001 between dark and light (photoreactivated) samples. Data are presented as mean ± SEM. Significance was calculated using one-way ANOVA complemented by Sidak's multiple comparisons post-hoc test. Densitometry is shown in Fig. S4.
Fig. 6
Fig. 6
UVB induces lipophagy in a CPD-dependent fashion HaCaT keratinocytes (n = 2 × 105 cells) were treated with 20 or 40 mJ/cm2 UVB, then cells were harvested. (a) Autophagy induction and lipid droplet (LD) formation were measured by punctate LC3A/B localization and Adipored accumulation on a confocal microscopy (n = 3). Brightness and contrast were adjusted. (b) Number and (c) size of LC3+ autophagosomes and (d) number and (e) size of LDs in cells from confocal images were quantified (n = 3). (f) Autophagosome-LD co-localization was measured using JACOP plugin in ImageJ (n = 3). HaCaT keratinocytes (n = 2 × 105 cells) were treated with 20 or 40 mJ/cm2 UVB, then cells were harvested. (g) Mitochondria were labeled using Mitotracker Red CMXRos and LDs were detected using Bodipy 493/503 dye. Brightness and contrast were adjusted. *; **, and *** indicate statistically significant differences at p < 0.05, p < 0.01, and p < 0.001 between dark non-irradiated and dark UVB-irradiated samples. #; ##, and ### indicate statistically significant differences at p < 0.05, p < 0.01, and p < 0.001 between dark and light (photoreactivated) samples and aaa indicates statistically significant differences at p < 0.001 between dark vehicle and dark chloroquine-treated samples. Data are presented as mean ± SEM. Significance was calculated using one-way ANOVA complemented by Sidak's multiple comparisons post-hoc test. (For interpretation of the references to color in this figure legend, the reader is referred to the Web version of this article.)
Fig. 7
Fig. 7
Compensatory effects after UVB irradiation are due to CPD-dependent reactive oxygen species production From panels a to f and j to k 2 × 105 HaCaT keratinocytes were treated with 20 or 40 mJ/cm2 UVB, then cells were harvested. From panel h to i, 2 × 104 HaCaT keratinocytes were treated with 20 or 40 mJ/cm2 UVB, then cells were harvested 24 h post-irradiation. In all cases, cells were pretreated with antioxidants for 2 h prior to UVB treatment and after the treatment, wells were refilled with medium containing antioxidants. (a) Total (n = 5) and (b) mitochondrial ROS production (n = 4) were assessed by dihydroethidium and MitoSOX Red incorporation. (c) Total (n = 9) and (d) mitochondrial ROS production (n = 8), (e) mitochondrial biogenesis (n = 7), (f) mitochondrial membrane potential (n = 7), (g) basal ECAR (n = 3), (h) basal OCR (n = 3), (i) oligomycin-sensitive respiration (n = 3), (j) lipid droplet accumulation (n = 7), and (k) LC3, as readouts of autophagy induction (n = 6) were assessed as previously described after pretreatment with 5 mM GSH, 5 mM NAC and 10 μM MitoTEMPO. *; **, and *** indicate statistically significant differences at p < 0.05, p < 0.01, and p < 0.001 between dark non-irradiated and dark UVB-irradiated samples. #; ##, and ### indicate statistically significant differences at p < 0.05, p < 0.01, and p < 0.001 between dark and light (photoreactivated) samples. a, aa, aaa, b, bb, bbb, and c, cc, ccc indicate statistically significant differences at p < 0.05 p < 0.01, and p < 0.001 between vehicle and ROS scavenger-treated samples. Data are presented as mean ± SEM. Significance was calculated using one-way ANOVA complemented by Sidak's multiple comparisons post-hoc test. In panel I and J, values were logarithmically transformed to achieve normal distribution. (For interpretation of the references to color in this figure legend, the reader is referred to the Web version of this article.)
Fig. 8
Fig. 8
UVB-induced lipid droplet biogenesis and keratinocyte differentiation are tightly interconnected and regulated by mitochondrial activity HaCaT keratinocytes (n = 2 × 105 cell) were treated with 20 or 40 mJ/cm2 UVB, then cells were harvested (panel a, b, e). HaCaT keratinocytes (n = 2 × 105 cell) were treated with 40 mJ/cm2 UVB (panel f, g, h, i) then cells were harvested. Antioxidants (5 mM GSH, 5 mM NAC and 10 μM MitoTEMPO) were added to medium 2 h prior to UVB treatment and after the treatment, wells were refilled with medium containing the antioxidants. (a) Keratinocyte differentiation and lipid droplet formation were measured by Keratin 1 (K1) protein expression and Adipored accumulation using confocal microscopy. (b) Changes in the number of K1 granules was determined by ImageJ (n = 4). (c) K1 expression and (d) LD formation were determined by flow cytometry in response to CaCl2, palmitic acid treatment, and 40 mJ/cm2 UVB irradiation (n > 5). The effect of ROS scavengers on K1 expression was determined by flow cytometry (n = 5). Analysis of K1 protein expression and LD content after 40 mJ/cm2 UVB exposure using flow cytometry after treatment with compounds that (f, g) support OXPHOS (n = 4) or (h, i) agents that inhibit mitochondrial activity (n = 6). *; **, and *** indicate statistically significant differences at p < 0.05, p < 0.01, and p < 0.001 between vehicle and differently treated samples. a, aa, aaa, b, bb, bbb, and c, cc, ccc indicate statistically significant differences p < 0.05 p < 0.01, and p < 0.001 between vehicle and ROS scavenger-treated samples. Data are presented as mean ± SEM. In panel B, E significance was calculated using one-way ANOVA complemented by Sidak's multiple comparisons post-hoc test. In panel C, D, F, G, H, I significance was calculated using one-way ANOVA complemented by Dunnett's post-hoc test.
Fig. 9
Fig. 9
CPD and ROS-mediated mitochondrial changes upon UVB exposure are not cell type-specific For panels a to f and i to k n = 2 × 105 normal human epidermal keratinocytes (NHEK) keratinocytes were treated with a total dose of 20 or 40 mJ/cm2 UVB. From panel g to h and l to m n = 2 × 104 NHEK keratinocytes were treated with a total dose of 20 or 40 mJ/cm2 UVB. (a) Total ROS production was assessed by dihydroethidium incorporation (n = 3). (b) Autophagy induction (n = 4) and (c) lipid droplet (LD) formation were measured by LC3A/B and Adipored accumulation (n = 4), respectively. (d) Mitochondrial mass was quantified by Mitotracker Green labeling (n = 3). (e) Mitochondrial membrane potential (n = 3) was assessed by Mitotracker Red CMXRos incorporation. (g) Basal ECAR representing glycolysis and (h) basal OCR representing total oxidative phosphorylation were measured by XF96 instrument in XF medium supplemented with 10 mM glucose (n = 2). (i) Total ROS production (n = 4), (j) mitochondrial membrane potential (n = 5), (k) basal ECAR (n = 3), and (l) basal OCR (n = 3) were assessed as previously described upon 5 mM GSH, 5mM NAC, and 10 μM MitoTEMPO pretreatment. *; **, and *** indicate statistically significant difference at p < 0.05, p < 0.01, and p < 0.001 between dark non-irradiated and dark UVB-irradiated samples. #; ##, and ### indicate statistically significant difference at p < 0.05, p < 0.01, and p < 0.001 between dark and light (photoreactivated) samples. a, aa, aaa, b, bb, bbb, and c, cc, ccc indicate statistically significant differences p < 0.05 p < 0.01, and p < 0.001 between vehicle and ROS scavenger-treated samples. Data are presented as mean ± SEM, significance was calculated using one-way ANOVA complemented by Sidak's multiple comparisons post-hoc test. In panels A and E, values were logarithmically transformed to achieve normal distribution. In panel D, I, K, and L, Box-Cox transformation was used to achieve normal distribution. (For interpretation of the references to color in this figure legend, the reader is referred to the Web version of this article.)
Fig. 10
Fig. 10
UVB induces free radical production and compensatory hypermetabolism in a CPD-dependent fashion.

Similar articles

Cited by

References

    1. Kaniak-Golik A., Skoneczna A. Mitochondria–nucleus network for genome stability. Free Radic. Biol. Med. 2015;82:73–104. - PubMed
    1. Brace L.E., Vose S.C., Stanya K., Gathungu R.M., Marur V.R., Longchamp A., Treviño-Villarreal H., Mejia P., Vargas D., Inouye K. Increased oxidative phosphorylation in response to acute and chronic DNA damage. NPJ aging and mechanisms of disease. 2016;2:16022. -16022. - PMC - PubMed
    1. Tondera D., Grandemange S., Jourdain A., Karbowski M., Mattenberger Y., Herzig S., Da Cruz S., Clerc P., Raschke I., Merkwirth C. SLP-2 is required for stress-induced mitochondrial hyperfusion. EMBO J. 2009;28:1589–1600. - PMC - PubMed
    1. Qin L., Fan M., Candas D., Jiang G., Papadopoulos S., Tian L., Woloschak G., Grdina D.J., Li J.J. CDK1 enhances mitochondrial bioenergetics for radiation-induced DNA repair. Cell Rep. 2015;13:2056–2063. - PMC - PubMed
    1. Bai P., Nagy L., Fodor T., Liaudet L., Pacher P. Poly(ADP-ribose) polymerases as modulators of mitochondrial activity. Trends Endocrinol. Metabol. 2015;26:75–83. - PubMed

Publication types

Substances