. 2017 Dec 28;20(1):13.
doi: 10.3390/e20010013.

Self-Organization of Genome Expression from Embryo to Terminal Cell Fate: Single-Cell Statistical Mechanics of Biological Regulation

Affiliations

Self-Organization of Genome Expression from Embryo to Terminal Cell Fate: Single-Cell Statistical Mechanics of Biological Regulation

Alessandro Giuliani et al. Entropy (Basel). .

Abstract

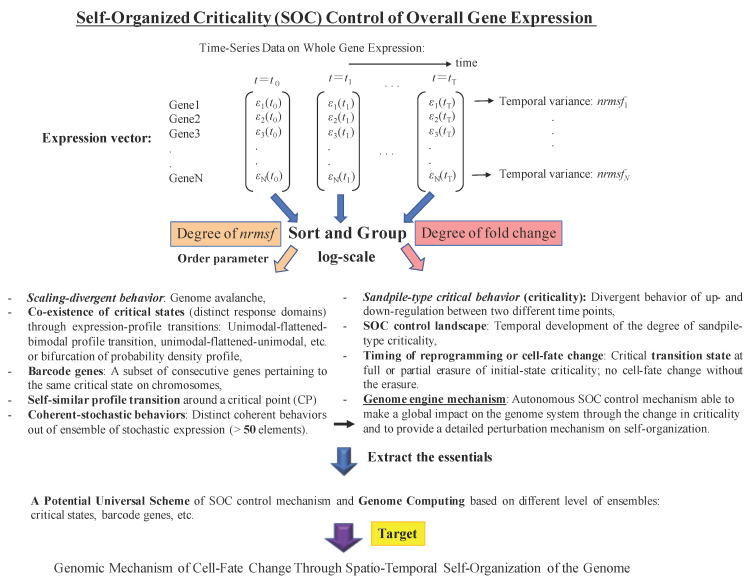
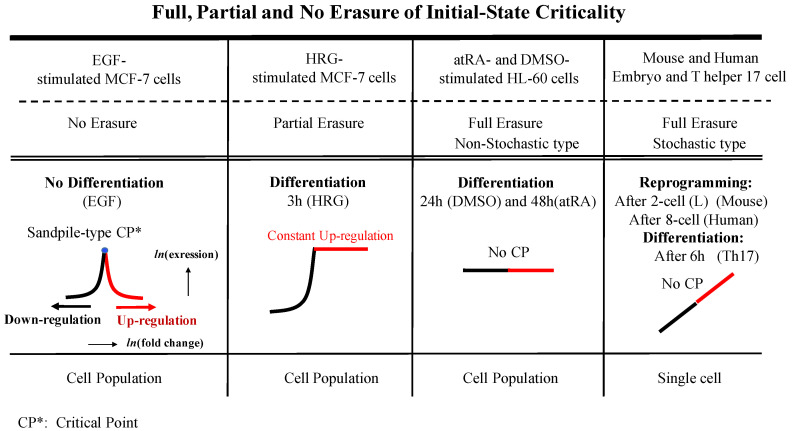
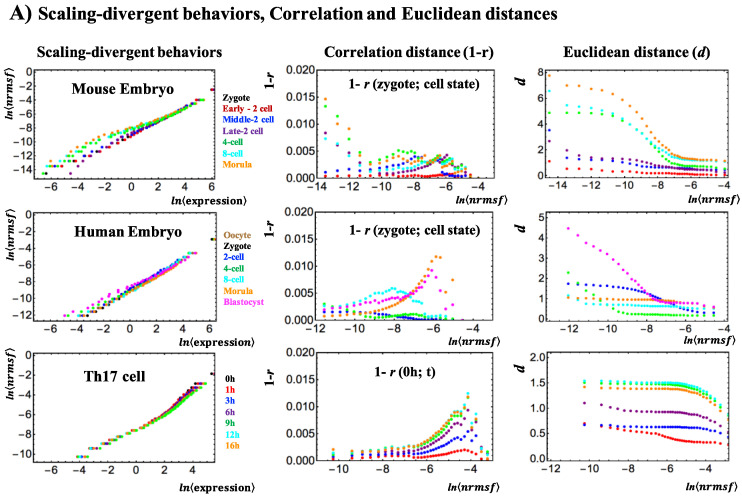
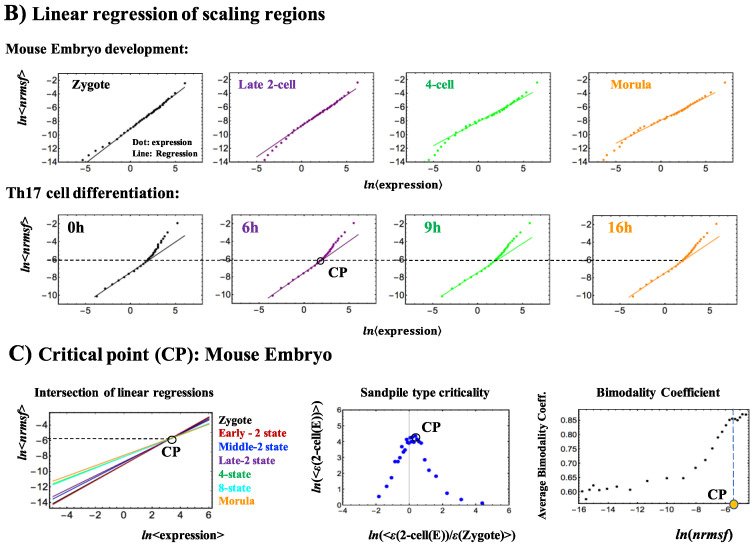
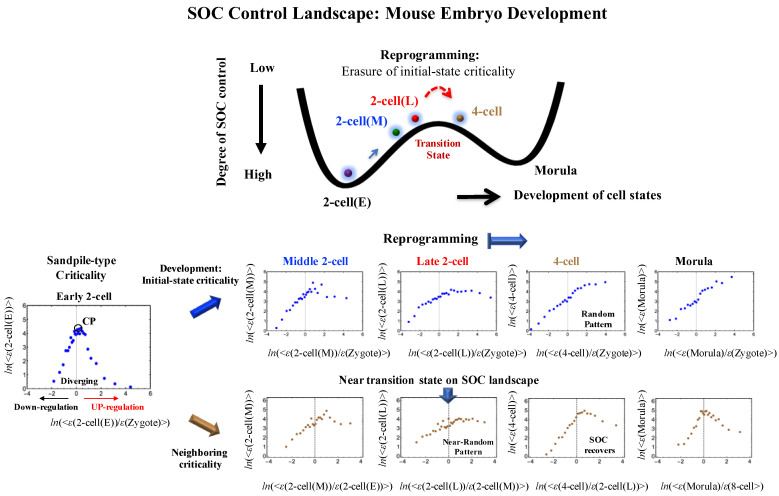
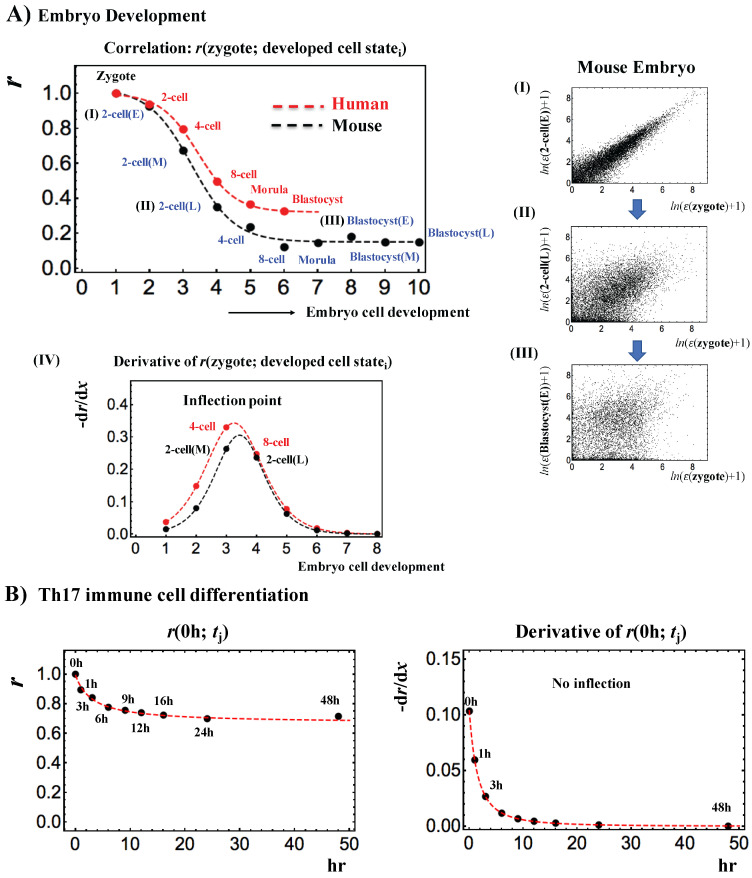
A statistical mechanical mean-field approach to the temporal development of biological regulation provides a phenomenological, but basic description of the dynamical behavior of genome expression in terms of autonomous self-organization with a critical transition (Self-Organized Criticality: SOC). This approach reveals the basis of self-regulation/organization of genome expression, where the extreme complexity of living matter precludes any strict mechanistic approach. The self-organization in SOC involves two critical behaviors: scaling-divergent behavior (genome avalanche) and sandpile-type critical behavior. Genome avalanche patterns-competition between order (scaling) and disorder (divergence) reflect the opposite sequence of events characterizing the self-organization process in embryo development and helper T17 terminal cell differentiation, respectively. On the other hand, the temporal development of sandpile-type criticality (the degree of SOC control) in mouse embryo suggests the existence of an SOC control landscape with a critical transition state (i.e., the erasure of zygote-state criticality). This indicates that a phase transition of the mouse genome before and after reprogramming (immediately after the late 2-cell state) occurs through a dynamical change in a control parameter. This result provides a quantitative open-thermodynamic appreciation of the still largely qualitative notion of the epigenetic landscape. Our results suggest: (i) the existence of coherent waves of condensation/de-condensation in chromatin, which are transmitted across regions of different gene-expression levels along the genome; and (ii) essentially the same critical dynamics we observed for cell-differentiation processes exist in overall RNA expression during embryo development, which is particularly relevant because it gives further proof of SOC control of overall expression as a universal feature.

Keywords: autonomous self-organized criticality; critical transition state; early embryo development; genome avalanche; reprogramming; self-organization; single-cell differentiation; single-cell genome dynamics; statistical thermodynamics.


Conflict of interest statement

The authors declare no conflict of interest.

Figures

Figure 1
Figure 1
Glossary and strategy of analysis: An extremely schematic view of the data analysis strategy (top) used to reveal SOC gene-expression regulation together with a glossary of the principal features of self-organization behavior highlighted by previous analyses in several biological processes (bottom); scaling divergent behavior (e.g., Figure 1A in [1]; Figure 5F in [2]; Figure 4 in [3]; Figure 1A in [4]); co-existence of critical states (Figures 4, 5 and 8 in [1]; Figures 1 and 2C in [2]; Figure 9 in [3]; Figure 3A in [4]); barcode genes (Figures 8 and 9 in [2]); self-similar profile transitions (Figure 3 in [2]; Figure 6 in [3]); coherent-stochastic behaviors (Figures 7 and 9 in [1]; Figures 5A and 6 in [2]; Figures 10 and 11 in [3]; Figure 3 in [4]); sandpile-type criticality (Figure 2D in [2]; Figures 3A and 4 in [3]); SOC control landscape (Figure 8 in [3]; Figure 2 in [4]); timing of reprogramming (Figures 5, 7B–D and S1 in [3]; Figure 2 in [4]); genome engine mechanisms (Figures 12 and 13 and the Discussion in [3]; Figures 5–7 in [4]).
Figure 2
Figure 2
Full, partial and no erasure of initial-state criticality and the timing of reprogramming and cell differentiation (see the details in [3,4]). The figure shows different types of erasure of initial state criticality in embryo development and terminal cell differentiation.
Figure 3
Figure 3
Scaling-divergent behaviors and critical points: (A) First column: Genome avalanches, scaling-divergent behaviors in overall expression, as important features of the SOC control of overall expression are evident in the log-log plot of average behaviors: mouse (first row), human (second) embryo development and Th17 immune cell differentiation (third). Second column: Correlation distance, expressed as (1 − r), where r is the Pearson correlation coefficient between the gene-expression profiles in the zygote and other development states (mouse: first row and human: second row) and between t = 0 and other time points (tj) (Th17). This distance corresponds to the relative change in the expression profile on the whole-genome scale. The results show that there is a difference in scaling-divergent behaviors: in mouse and human embryo, correlation behaviors significantly change at low and middle nrmsf, respectively, whereas in terminal Th17 cell, significant change occurs at high nrmsf. Third column: Euclidean distance from the initial-state response (zygote state for embryo development and response at t = 0 for Th17 cell) shows that two distinct biological processes (reprogramming in early embryo development versus immune cell differentiation) show opposite scaling-divergent behaviors. Scaling behavior (i.e., constant behavior in Euclidean distance) occurs in the ensemble of high-variance RNA expression (region of high nrmsf) in early embryo development, and divergent behavior occurs in the ensemble of low-variance RNA expression (region of low nrmsf: sub-critical state), whereas the T cell terminal cell fate (single cell) has opposite behaviors. Log-log plots represent the natural logarithm of the group average (< >) of expression (x-axis) and nrmsf (y-axis) (n = 485 (mouse), 475 (human), and 375 (Th17) for each dot), where overall expression is sorted and grouped (35 groups) according to the degree of nrmsf (Appendix A); (B) Linear regression of scaling regions in the scaling-divergent behaviors; mouse embryo development (upper row) and Th17 cell differentiation (lower row); (C) critical point: in mouse embryo development, a summit (CP) of sandpile criticality (middle panel) corresponds to a tipping point of transitional behavior of the bimodality coefficient (right) and, furthermore, to the intersection of linear regressions (left) (see more in [4]). This suggests that the CP is fixed during early mouse embryo development. In Th17 cell differentiation, the CP corresponds to the onset of divergent behaviors, which is also fixed in single-cell differentiation (see (B)).
Figure 3
Figure 3
Scaling-divergent behaviors and critical points: (A) First column: Genome avalanches, scaling-divergent behaviors in overall expression, as important features of the SOC control of overall expression are evident in the log-log plot of average behaviors: mouse (first row), human (second) embryo development and Th17 immune cell differentiation (third). Second column: Correlation distance, expressed as (1 − r), where r is the Pearson correlation coefficient between the gene-expression profiles in the zygote and other development states (mouse: first row and human: second row) and between t = 0 and other time points (tj) (Th17). This distance corresponds to the relative change in the expression profile on the whole-genome scale. The results show that there is a difference in scaling-divergent behaviors: in mouse and human embryo, correlation behaviors significantly change at low and middle nrmsf, respectively, whereas in terminal Th17 cell, significant change occurs at high nrmsf. Third column: Euclidean distance from the initial-state response (zygote state for embryo development and response at t = 0 for Th17 cell) shows that two distinct biological processes (reprogramming in early embryo development versus immune cell differentiation) show opposite scaling-divergent behaviors. Scaling behavior (i.e., constant behavior in Euclidean distance) occurs in the ensemble of high-variance RNA expression (region of high nrmsf) in early embryo development, and divergent behavior occurs in the ensemble of low-variance RNA expression (region of low nrmsf: sub-critical state), whereas the T cell terminal cell fate (single cell) has opposite behaviors. Log-log plots represent the natural logarithm of the group average (< >) of expression (x-axis) and nrmsf (y-axis) (n = 485 (mouse), 475 (human), and 375 (Th17) for each dot), where overall expression is sorted and grouped (35 groups) according to the degree of nrmsf (Appendix A); (B) Linear regression of scaling regions in the scaling-divergent behaviors; mouse embryo development (upper row) and Th17 cell differentiation (lower row); (C) critical point: in mouse embryo development, a summit (CP) of sandpile criticality (middle panel) corresponds to a tipping point of transitional behavior of the bimodality coefficient (right) and, furthermore, to the intersection of linear regressions (left) (see more in [4]). This suggests that the CP is fixed during early mouse embryo development. In Th17 cell differentiation, the CP corresponds to the onset of divergent behaviors, which is also fixed in single-cell differentiation (see (B)).
Figure 4
Figure 4
Timing of the genome-state change on the SOC control landscape in a single cell: A change in critical dynamics through sandpile-type criticality (diverging up- and down-regulation at the CP around ln(<nrmsf>) ~ −5.5), which affects the entire genome-expression dynamics (see details in [4]), appears in the change in overall expression (e.g., fold-change) between different time points. Thus, the erasure of sandpile-type criticality in the zygote state points to the timing of a genome-state change in mouse embryo development. This erasure of zygote criticality (upper row: development of initial-state criticality) occurs after the late 2-cell state to reveal a stochastic expression pattern as a linear correlative behavior (refer to [3]). The near-transition point (see a schematic picture of the SOC landscape: top panel) occurs at the middle-late 2-cell states (lower row: development of neighboring criticality), at which sandpile-type criticality disappears and thereafter recovers. Plots reveal the existence of an SOC control landscape and a transition state at around the middle-later 2-cell states. The x- and y-axes represent the fold-change in expression and the group average expression. A detailed mechanism of how reprogramming occurs via the interaction of distinct coherent expression states is given in [4], where the collective behavior of stochastic low-variance RNA expression as a generator of autonomous SOC control guides the reprogramming of mouse embryo development.
Figure 5
Figure 5
Critical transition revealed through changes in the Pearson correlation between the zygote and cell developed states: (A) Pearson correlation for the developed cell state with the zygote exhibits a critical transition as a tangent hyperbolic function, 0.590.44 tanh(0.78 x2.5), (p < 10−3) (black dash: mouse embryo; red: human embryo) with between-whole expression profiles (right panel): (I) zygote vs. early 2-cell state; (II) zygote vs. late 2-cell state; (III) zygote vs. early blastocyst; (IV: the plot shows that a phase transition occurs at the inflection point (zero second derivative of the tangent hyperbolic function); there is a phase difference between the 4-cell and 8-cell states for human and between the middle and late 2-cell states for mouse. Since there are zero values in RNA expression (Reads Per Kilobase Mapped (RPKM) values), before taking the natural log of expression, we add a value of 1 to all RPKM values for between-whole expression profiles. ε (cell state) represents whole RNA expression at a specific cell state. (B) Temporal development of the Pearson correlation of whole expression at t = 0 h. It follows 0.67 + 1/(3.10 + x) (p < 10−8; red dashed line) without any inflection (i.e., no phase difference as in embryo development). The (negative) derivatives of Pearson correlation for (A,B) are taken from the fitting functions.

Similar articles

Cited by

References

    1. Tsuchiya M., Hashimoto M., Takenaka Y., Motoike I.N., Yoshikawa K. Global genetic response in a cancer cell: Self-organized coherent expression dynamics. PLoS ONE. 2014;9:e97411. doi: 10.1371/journal.pone.0097411. - DOI - PMC - PubMed
    1. Tsuchiya M., Giuliani A., Hashimoto M., Erenpreisa J., Yoshikawa K. Emergent Self-Organized Criticality in gene expression dynamics: Temporal development of global phase transition revealed in a cancer cell line. PLoS ONE. 2015;11:e0128565. doi: 10.1371/journal.pone.0128565. - DOI - PMC - PubMed
    1. Tsuchiya M., Giuliani A., Hashimoto M., Erenpreisa J., Yoshikawa K. Self-organizing global gene expression regulated through criticality: Mechanism of the cell-fate change. PLoS ONE. 2016;11:e0167912. doi: 10.1371/journal.pone.0167912. - DOI - PMC - PubMed
    1. Tsuchiya M., Giuliani A., Yoshikawa K. Single-Cell Reprogramming in Mouse Embryo Development through a Critical Transition State. Entropy. 2017;19:584. doi: 10.3390/e19110584. - DOI
    1. Einstein A., Schilpp P.A. Autobiographical Notes. Open Court Publishing Company; Chicago, IL, USA: 1949.

LinkOut - more resources