

Combination of R-R Interval and Crest Time in Assessing Complexity Using Multiscale Cross-Approximate Entropy in Normal and Diabetic Subjects
- PMID: 33265587
- PMCID: PMC7513023
- DOI: 10.3390/e20070497
Combination of R-R Interval and Crest Time in Assessing Complexity Using Multiscale Cross-Approximate Entropy in Normal and Diabetic Subjects
Abstract
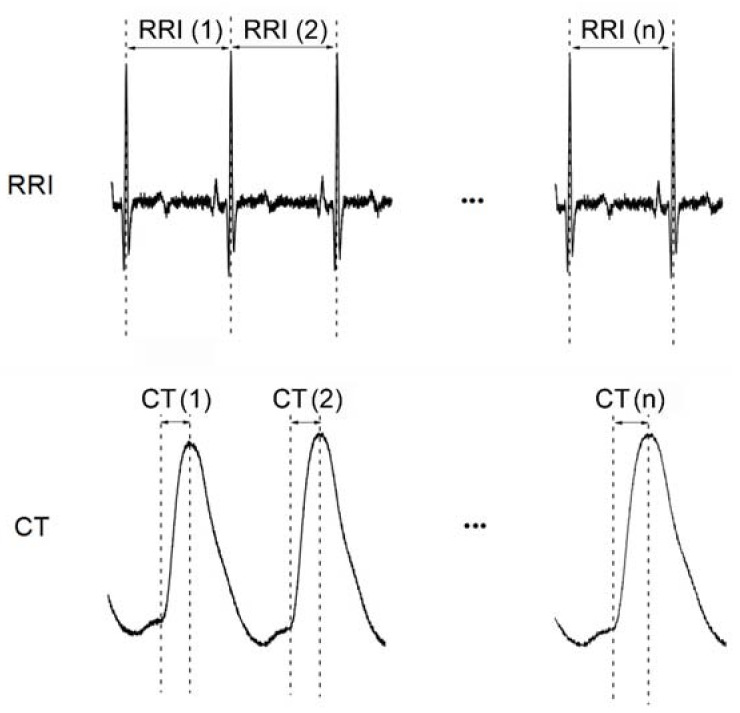
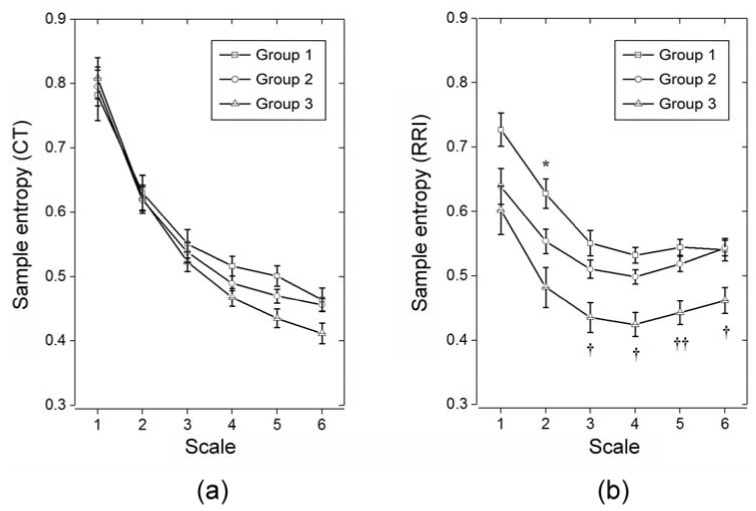
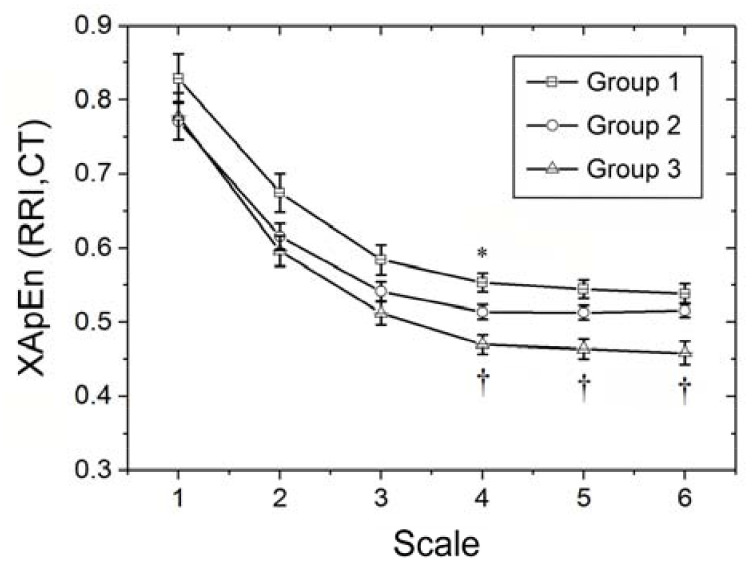
The present study aimed at testing the hypothesis that application of multiscale cross-approximate entropy (MCAE) analysis in the study of nonlinear coupling behavior of two synchronized time series of different natures [i.e., R-R interval (RRI) and crest time (CT, the time interval from foot to peakof a pulse wave)] could yield information on complexity related to diabetes-associated vascular changes. Signals of a single waveform parameter (i.e., CT) from photoplethysmography and RRI from electrocardiogram were simultaneously acquired within a period of one thousand cardiac cycles for the computation of different multiscale entropy indices from healthy young adults (n = 22) (Group 1), upper-middle aged non-diabetic subjects (n = 34) (Group 2) and diabetic patients (n = 34) (Group 3). The demographic (i.e., age), anthropometric (i.e., body height, body weight, waist circumference, body-mass index), hemodynamic (i.e., systolic and diastolic blood pressures), and serum biochemical (i.e., high- and low-density lipoprotein cholesterol, total cholesterol, and triglyceride) parameters were compared with different multiscale entropy indices including small- and large-scale multiscale entropy indices for CT and RRI [MEISS(CT), MEILS(CT), MEISS(RRI), MEILS(RRI), respectively] as well as small- and large-scale multiscale cross-approximate entropy indices [MCEISS, MCEILS, respectively]. The results demonstrated that both MEILS(RRI) and MCEILS significantly differentiated between Group 2 and Group 3 (all p < 0.017). Multivariate linear regression analysis showed significant associations of MEILS(RRI) and MCEILS(RRI,CT) with age and glycated hemoglobin level (all p < 0.017). The findings highlight the successful application of a novel multiscale cross-approximate entropy index in non-invasively identifying diabetes-associated subtle changes in vascular functional integrity, which is of clinical importance in preventive medicine.
Keywords: R-R interval; crest time; cross-approximate entropy; diabetes; multiscale entropy (MSE).
Conflict of interest statement
The authors declared no potential conflict of interests with regard to the research, authorship, and publication of this article.
Figures
References
Grants and funding
LinkOut - more resources
Full Text Sources
