. 2020 Nov 30;8(12):1900.
doi: 10.3390/microorganisms8121900.

The Exploration of Novel Regulatory Relationships Drives Haloarchaeal Operon-Like Structural Dynamics over Short Evolutionary Distances

Affiliations

The Exploration of Novel Regulatory Relationships Drives Haloarchaeal Operon-Like Structural Dynamics over Short Evolutionary Distances

Phillip Seitzer et al. Microorganisms. .

Abstract

Operons are a dominant feature of bacterial and archaeal genome organization. Numerous investigations have related aspects of operon structure to operon function, making operons exemplars for studies aimed at deciphering Nature's design principles for genomic organization at a local scale. We consider this understanding to be both fundamentally important and ultimately useful in the de novo design of increasingly complex synthetic circuits. Here we analyze the evolution of the genomic context of operon-like structures in a set of 76 sequenced and annotated species of halophilic archaea. The phylogenetic depth and breadth of this dataset allows insight into changes in operon-like structures over shorter evolutionary time scales than have been studied in previous cross-species analysis of operon evolution. Our analysis, implemented in the updated software package JContextExplorer finds that operon-like context as measured by changes in structure frequently differs from a sequence divergence model of whole-species phylogeny and that changes seem to be dominated by the exploration of novel regulatory relationships.

Keywords: archaea; evolution; genomics; haloarchaea; operon.


Conflict of interest statement

The authors declare no conflict of interest. The funders had no role in the design of the study; in the collection, analyses, or interpretation of data; in the writing of the manuscript, or in the decision to publish the results.

Figures

Figure 1
Figure 1
Comparative phylogenetic depth and breadth of datasets used in OLS comparison analyses. Phylogenetic distances were determined between all organisms used in two previous cross-species OLS comparisons analyses as well as the organisms we used in this study (see Methods). The organisms used in our investigation (“halophiles”, red) offer less breadth than those used in previous studies (“cyanobacteria”, blue, and “gamma-proteobacteria”, green), however, provide significantly more depth. This additional depth allows us to observe many more types of OLS modification, and increases the confidence with which report our results.
Figure 2
Figure 2
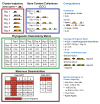
Visualization of Context Trajectory Computations. Computations applied to context trajectories are exemplified in a theoretical context trajectory: OLSs are found in six organisms described as Orgs 1–6, and contain between one and four genes (red box). This trajectory contains four gene content collections (blue box), and clustericity and variety scores of 0.83 and 0.22 (top right), respectively. Based on a theoretical matrix of species-level phylogenetic dissimilarities (green box), this trajectory has a topology divergence ratio of 5.13 (middle right). Evaluation of the gene content collections in this trajectory indicate that this context trajectory exhibits an OLS modification type of “Append” (middle right). A comparison of the dissimilarities between organisms found both within and outside of the gene content collections (brown box) enables a comparison of species phylogeny and OLS adaptivity (bottom right), which is evaluated both retaining and excluding singleton genes (red highlighter, brown box). In this example, the species-level phylogeny is consistent with differences in OLS topology between species whether or not singleton genes are excluded.
Figure 3
Figure 3
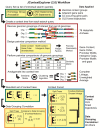
JContextExplorer 2.0 workflow and its application to 76 haloarchaeal species. The previously described JContextExplorer workflow (red box, for detailed description please see [36] and File S3) was extended to allow for the generation of a large set of context trees, which could then be correlated with external data (data grouping correlation, orange box), or to each other (context forest, blue box). In the figure, all boxes with yellow background represent additions to the original algorithm (note the addition of novel comparison metrics, yellow box within red box). The updated approach was applied to a dataset of 76 haloarchaeal species in various ways to determine the degree to which various types of OLS evolution had occurred (textual descriptions at right describe applications of the tool).
Figure 4
Figure 4
High clustericity and high variety is rare among OLS trajectories. A comparison of the haloarchaeal OLS trajectories revealed a large distribution of behavior with respect to clustericity and variety. In the above plot, each data point is a single context trajectory. Red lines segregate into 4 quadrants based on high or low clustericity paired with high or low variety. Note that the quadrant (high clustericity and high variety) is sparsely populated compared to the other three quadrants. This suggests that when many OLS gene content modifications occur (high variety), a large number of singleton gene states are also observed (decreased clustericity). A blue line is drawn to indicate a two-part piecewise fit. We propose that this model may be used to explain the path of a singleton gene evolving into a large, conserved OLS: initially, there is an exploratory phase (left blue line), where rapid formation of OLSs and dissolution of OLSs may occur until a stable OLS is formed, after which a long phase of tuning and refinement may follow (right blue line).
Figure 5
Figure 5
Modification by gene reordering. (A) Frequencies of gene reordering observed among adjacent gene pairs (green triangle) and identical content groups (red circle). These could be further segregated into simple switches (gene reordering does not accompany modification in gene content) and complex switches (gene reordering accompanies modification in gene content). Two examples are shown: a simple switch (B) and a complex switch (C). In (B), light blue, red, dark blue, green, and pink genes are a glycerol-3-phosphate ABC transporter, ugpA, ugpE, ugpC, and glycerophospohryl diester phosphodiesterase, respectively. In (C), pink, light blue, dark blue, green, red, tan, yellow, and mocha genes are dimethylbenzimidazole phosphoribosyltransferase, cobyrinic acid A,C-diamide synthase, adenosylcobinamide-phosphate synthase, cobalamin synthase, CobY, L-threonine 3-O-phosphate decarboxylase, adenosylcobinamide amidohydrolase and a “conserved cobalamin OLS protein”, respectively.
Figure 6
Figure 6
OLS modification by promoter. (A) Observed modifications in promoter sites. A total of 1954/4086 identical content groups (red circle) exhibit a modification in promoter content. Content groups that exhibit a modification (1954, red underline), were assessed for the location of the modification, if it occurred at the head of the OLS, an internal site, or both (Venn diagram). Two examples are shown: (B) a modification at the OLS head only and (C) modification at internal site(s) only. In (B), the blue gene is 3-hydroxyacyl-CoA dehydrogenase, green gene is a monoamine oxidase regulatory protein. In (C), blue, yellow, green, and red genes are a spemidine-binding ABC transporter, PotA, PotB, and aliphatic amidase, respectively.
Figure 7
Figure 7
Modification by change in intergenic gap size. Intergenic gap sizes were assessed using two different query sets, based on identical content groups (A, red circle), and co-occurring gene pairs (C, blue square). Requiring that OLSs not vary in gene content, we determined that approximately 11% of these OLSs exhibited a difference in intergenic gap size of component genes of 30 nt or more (A). Of these (466, red underline), the appearance of an internal promoter coincided with the gap-widening event in approximately 23% (108/466) cases. (B) An example of such a combined internal gap widening and promoter appearance, where a pair of genes (blue and dark pink genes) transition from an intergenic gap size of 0 nt in Natronorubrum tibetense to an intergenic distance separation of 32 nucleotides in Natronolimnobius innermongolicus (black arrow indicates gap, promoter is shown elevated above intergenic gap for clarity). Light pink, green, blue and dark pink genes are acetylglutamate kinase, acetylornithine aminotransferase, acetylornithine deacetylase and ornithine carbamoyltransferase, respectively. Assessing only gene pairs that were identified to be collinear in an OLS in at least one organism, we found that changes in intergenic distance varied frequently (C). Certain cases appeared that may represent progressive deletion (or addition) of intervening sequence such as the example shown in (D), where the intergenic spacing between green (inosose isomerase) and dark blue genes (myo-inositol 2-dehydrogenase) increases progressively from Haloferax volcanii (3 nt), to to Haloferax denitrificans (174 nt), to Natronorubrum tibetense (442 nt), finally to Halobiforma lacisalsi., where a gene in the opposite orientation appears. To interrogate this example further, we identified all examples where the genes with homology clusters 866 and 1119 were collinear and nearby, extracted intergenic gaps separating these genes, and performed a series of multiple alignments using the online ClustalW web tool [45], with default parameters. The results of multiple alignments of these intergenic can be found in supplementary information (File S10).
Figure 8
Figure 8
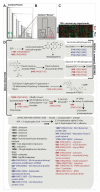
An in-depth analysis of one context grove generated from an analysis of OLS in the haloarchaea. (A) The tree at the top left shows the resulting context forest. A green box labeled “R” represents a ribosomal gene grove while the green box labeled “C” represents a cobalamin operon grove. (B) The tree immediately to the right of the context forest is an enlarged view of one context grove. (C) The heat map (top right) shows the patterns of transcriptional abundance for the genes found in this specific grove that are encoded in Halobacterium salinarum NRC-1. The expression data are derived from publicly available microarray datasets [48,49,50,51,52,53,54,55]. The data have been clustered and are found to be most parsimoniously described by two clusters of expression termed here Red and Blue. (D) When a gene present in the grove of panel B was also found in H. salinarum NRC-1, its expression cluster membership (panel C) is mapped on the branches and leaves of the context grove and in the cluster/gene names in the figure below by coloring the branch and/or gene name either Red or Blue. Gene names and annotations are labeled with cluster number in bold and H. salinarum NRC-1 geneID in italic. Cluster numbers colored black and lacking a geneID were not found in the H. salinarum NRC-1 genome.
Figure 9
Figure 9
Analysis of relative chromosomal distances for genes in the haloarchaeal OLS context forest. (A) A schematic depicting the calculation of chromosomal distance along a relative bisect. The solid circle represents the archaeal chromosome. The relative locations for hypothetical genes 1 and 2 (colored red) are depicted by numbers. Two solid red lines represent points on the chromosome that define the bisect of the chromosome when one end is anchored on the center coordinate of gene 1. One of the dashed red lines represents the distance around half the chromosome starting at the midpoint of gene 1. A second dashed line represents the distance between gene 1 and 2. The fractional angle or distance can be computed as the ratio between the gene-pair distance and the distance around half of the chromosome. A second pair of genes X and Y are labeled blue and depict the calculation of the relative chromosomal distance between these two genes along the bisect defined by starting at the midpoint of gene X. All non-redundant pairwise distances were calculated for genes that were present in the context forest and on the main chromosome. (B) The binned distribution of pairwise distances are depicted for genes on the Halalkalicoccus jeotagli chromosome. The red line is a smoothed interpolation through the data. (C) The binned distribution of pairwise distances are depicted for genes on the Haloquadratum walsbyi chromosome. The red line is a smoothed interpolation through the data.

References

    1. Bergman N.H., Passalacqua K.D., Hanna P.C., Qin Z.S. Operon prediction for sequenced bacterial genomes without experimental information. Appl. Environ. Microbiol. 2007;73:846–854. doi: 10.1128/AEM.01686-06. - DOI - PMC - PubMed
    1. Price M.N., Huang K.H., Alm E.J., Arkin A.P. A novel method for accurate operon predictions in all sequenced prokaryotes. Nucleic Acids Res. 2005;33:880–892. doi: 10.1093/nar/gki232. - DOI - PMC - PubMed
    1. Hillier L.W., Miller R.D., Baird S.E., Chinwalla A., Fulton L.A., Koboldt D.C., Waterston R.H. Comparison of C. elegans and C. briggsae genome sequences reveals extensive conservation of chromosome organization and synteny. PLoS Biol. 2007;5:e167. doi: 10.1371/journal.pbio.0050167. - DOI - PMC - PubMed
    1. Cutter A.D., Agrawal A.F. The evolutionary dynamics of operon distributions in Eukaryote genomes. Genetics. 2010;185:685–693. doi: 10.1534/genetics.110.115766. - DOI - PMC - PubMed
    1. Rogozin I.B. Connected gene neighborhoods in prokaryotic genomes. Nucleic Acids Res. 2002;30:2212–2223. doi: 10.1093/nar/30.10.2212. - DOI - PMC - PubMed