

Lactobacillus sakei ADM14 Induces Anti-Obesity Effects and Changes in Gut Microbiome in High-Fat Diet-Induced Obese Mice
- PMID: 33266101
- PMCID: PMC7761388
- DOI: 10.3390/nu12123703
Lactobacillus sakei ADM14 Induces Anti-Obesity Effects and Changes in Gut Microbiome in High-Fat Diet-Induced Obese Mice
Abstract
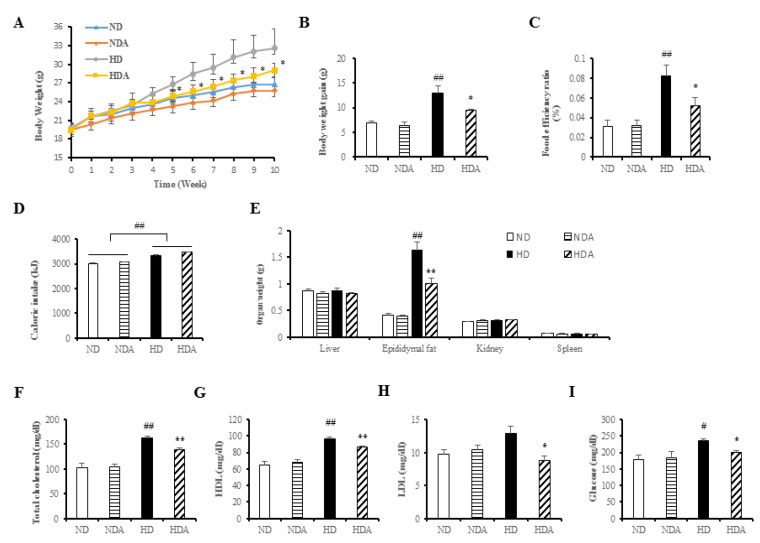
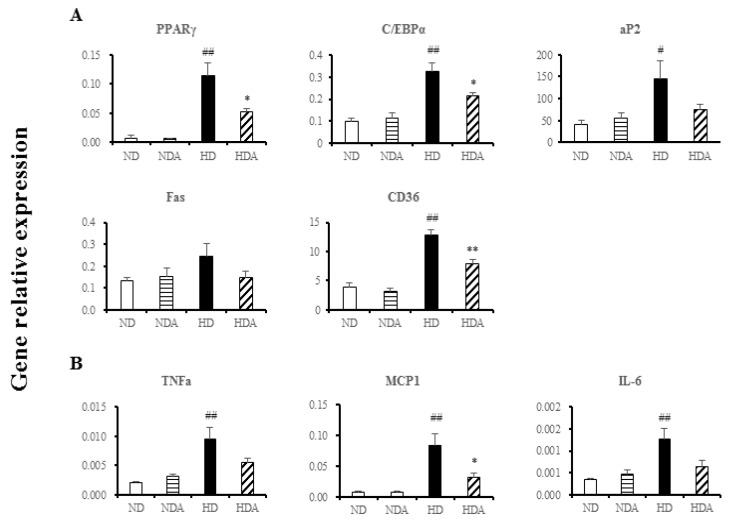
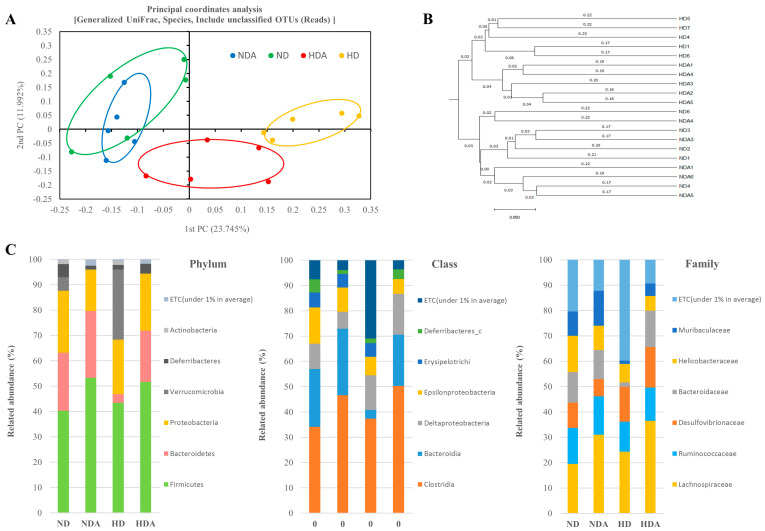
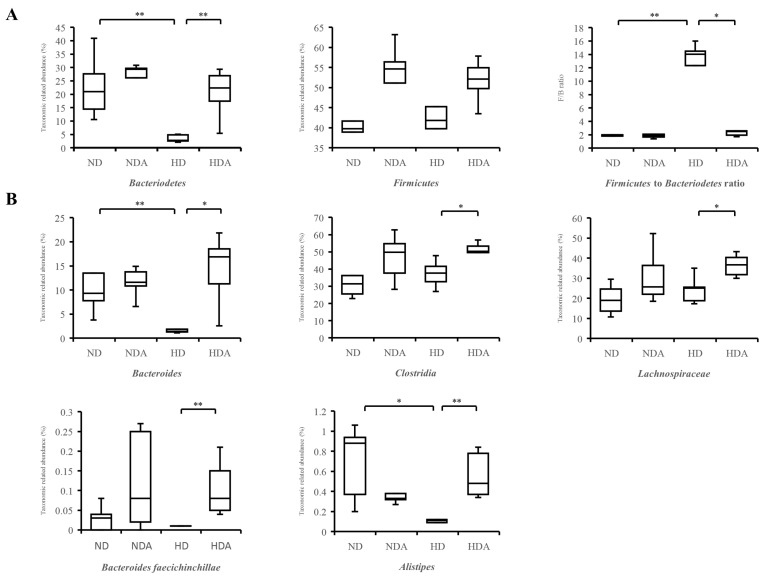
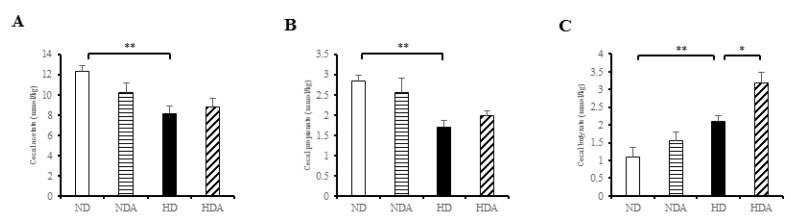
The aim of our study was to evaluate the anti-obesity effects of Lactobacillus sakei (L. sakei) ADM14 administration in a high-fat diet-induced obese mouse model and the resulting changes in the intestinal microbiota. Prior to in vivo testing, L. sakei ADM14 was shown to inhibit adipogenesis through in vitro test and genetic analysis. Subsequently, mice were orally administered 0.85% saline supplemented or not with L. sakei ADM14 to high-fat diet group and normal diet group daily. The results showed that administration of L. sakei ADM14 reduced weight gain, epididymal fat expansion, and total blood cholesterol and glucose levels, and significantly decreased expression of lipid-related genes in the epididymal fat pad. Administration of L. sakei ADM14 showed improvement in terms of energy harvesting while restoring the Firmicutes to Bacteroidetes ratio and also increased the relative abundance of specific microbial taxa such as Bacteroides faecichinchillae and Alistipes, which are abundant in non-obese people. L. sakei ADM14 affected the modulation of gut microbiota, altered the strain profile of short-chain fatty acid production in the cecum and enhanced the stimulation of butyrate production. Overall, L. sakei ADM14 showed potential as a therapeutic probiotic supplement for metabolic disorders, confirming the positive changes of in vivo indicators and controlling gut microbiota in a high-fat diet-induced obese mouse model.
Keywords: Lactobacillus sakei; anti-obesity; gut microbiome; probiotics.
Conflict of interest statement
The authors declare no conflict of interest.
Figures

Similar articles
-
Microbiota-Based Intervention Alleviates High-Fat Diet Consequences Through Host-Microbe Environment Remodeling.Nutrients. 2025 Apr 22;17(9):1402. doi: 10.3390/nu17091402. Nutrients. 2025. PMID: 40362711 Free PMC article. Review.
-
Oral Administration of Latilactobacillus sakei ADM14 Improves Lipid Metabolism and Fecal Microbiota Profile Associated With Metabolic Dysfunction in a High-Fat Diet Mouse Model.Front Microbiol. 2021 Oct 6;12:746601. doi: 10.3389/fmicb.2021.746601. eCollection 2021. Front Microbiol. 2021. PMID: 34690997 Free PMC article.
-
Latilactobacillus sakei WIKIM31 Decelerates Weight Gain in High-Fat Diet-Induced Obese Mice by Modulating Lipid Metabolism and Suppressing Inflammation.J Microbiol Biotechnol. 2021 Nov 28;31(11):1568-1575. doi: 10.4014/jmb.2107.07024. J Microbiol Biotechnol. 2021. PMID: 34528915 Free PMC article.
-
Amelioration of obesity-related biomarkers by Lactobacillus sakei CJLS03 in a high-fat diet-induced obese murine model.Sci Rep. 2019 May 2;9(1):6821. doi: 10.1038/s41598-019-43092-y. Sci Rep. 2019. PMID: 31048785 Free PMC article.
-
Exploring the anti-obesity effects of Lactobacillus in C57BL/6 mice: mechanisms, interventions, and future directions.Lett Appl Microbiol. 2025 Mar 3;78(3):ovaf024. doi: 10.1093/lambio/ovaf024. Lett Appl Microbiol. 2025. PMID: 39965784 Review.
Cited by
-
Lactobacillus paracasei JY062 Alleviates Glucolipid Metabolism Disorders via the Adipoinsular Axis and Gut Microbiota.Nutrients. 2024 Jan 16;16(2):267. doi: 10.3390/nu16020267. Nutrients. 2024. PMID: 38257160 Free PMC article.
-
Latilactobacillus sakei Furu2019 and stachyose as probiotics, prebiotics, and synbiotics alleviate constipation in mice.Front Nutr. 2023 Jan 5;9:1039403. doi: 10.3389/fnut.2022.1039403. eCollection 2022. Front Nutr. 2023. PMID: 36687730 Free PMC article.
-
Therapeutic and Improving Function of Lactobacilli in the Prevention and Treatment of Cardiovascular-Related Diseases: A Novel Perspective From Gut Microbiota.Front Nutr. 2021 Jun 7;8:693412. doi: 10.3389/fnut.2021.693412. eCollection 2021. Front Nutr. 2021. PMID: 34164427 Free PMC article. Review.
-
Understanding the complex function of gut microbiota: its impact on the pathogenesis of obesity and beyond: a comprehensive review.Diabetol Metab Syndr. 2024 Dec 23;16(1):308. doi: 10.1186/s13098-024-01561-z. Diabetol Metab Syndr. 2024. PMID: 39710683 Free PMC article. Review.
-
Microbiota-Based Intervention Alleviates High-Fat Diet Consequences Through Host-Microbe Environment Remodeling.Nutrients. 2025 Apr 22;17(9):1402. doi: 10.3390/nu17091402. Nutrients. 2025. PMID: 40362711 Free PMC article. Review.
References
MeSH terms
Substances
Supplementary concepts
Grants and funding
LinkOut - more resources
Full Text Sources
Other Literature Sources
Medical
