. 2020 Nov 30;21(23):9130.
doi: 10.3390/ijms21239130.

Histone Variant H2A.J Marks Persistent DNA Damage and Triggers the Secretory Phenotype in Radiation-Induced Senescence

Affiliations

Histone Variant H2A.J Marks Persistent DNA Damage and Triggers the Secretory Phenotype in Radiation-Induced Senescence

Anna Isermann et al. Int J Mol Sci. .

Abstract

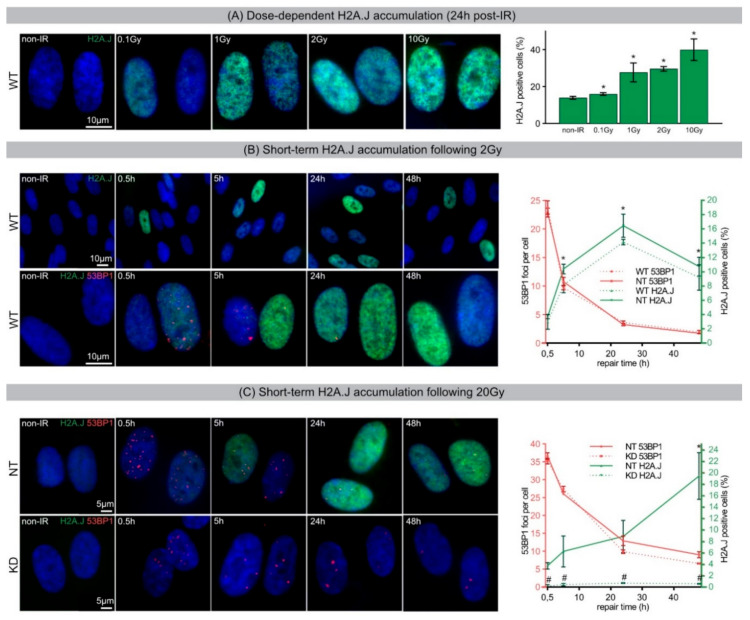
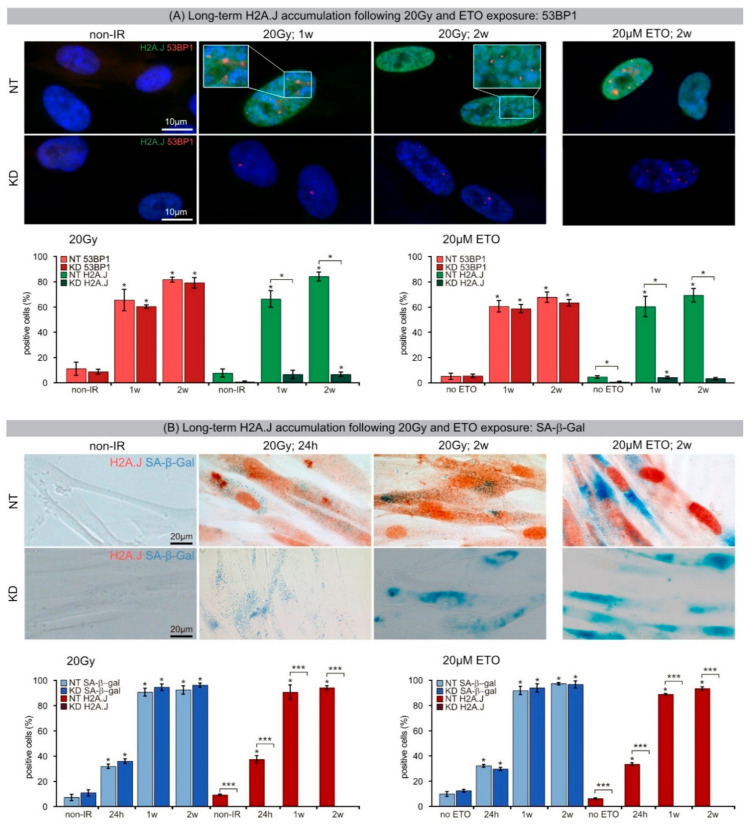
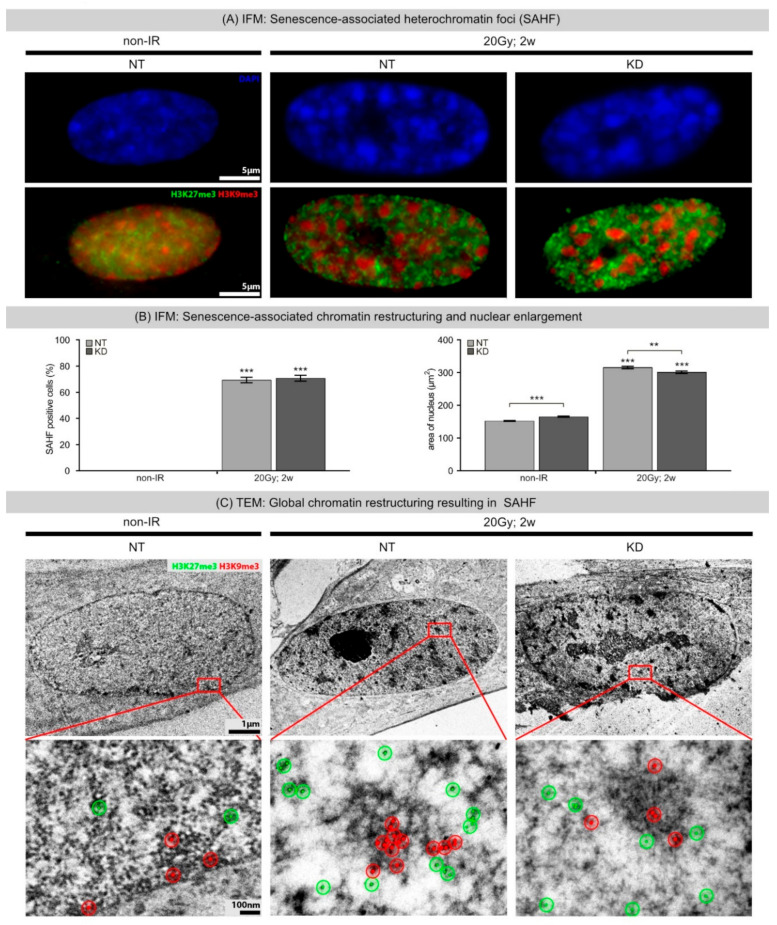
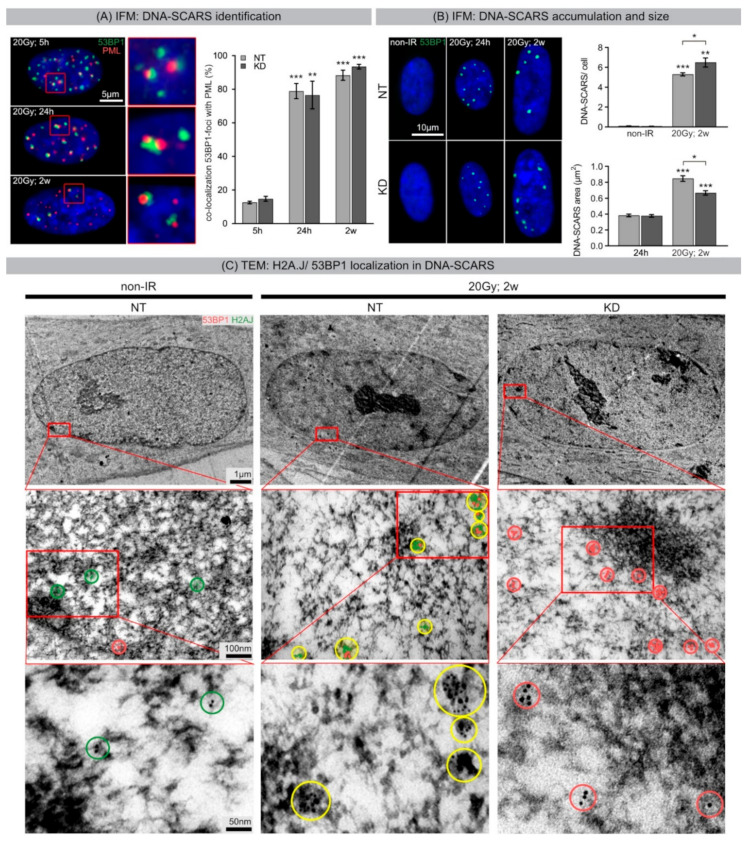
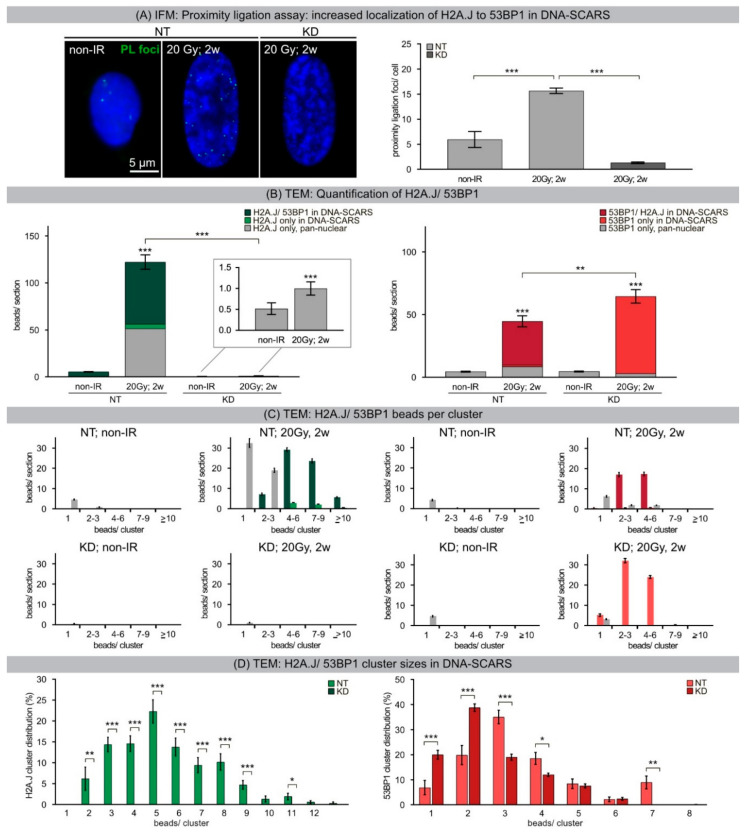
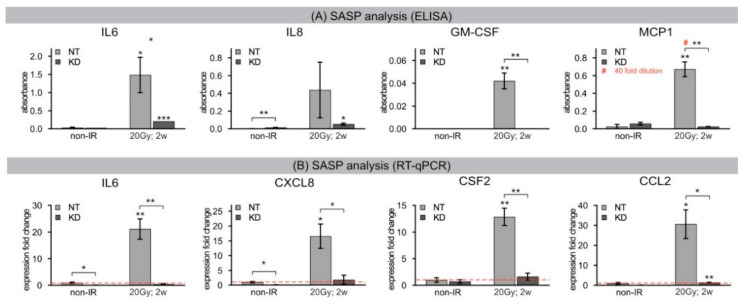
Irreparable double-strand breaks (DSBs) in response to ionizing radiation (IR) trigger prolonged DNA damage response (DDR) and induce premature senescence. Profound chromatin reorganization with formation of senescence-associated heterochromatin foci (SAHF) is an essential epigenetic mechanism for controlling the senescence-associated secretory phenotype (SASP). To decipher molecular mechanisms provoking continuous DDR leading to premature senescence, radiation-induced DSBs (53BP1-foci) and dynamics of histone variant H2A.J incorporation were analyzed together with chromatin re-modeling in human fibroblasts after IR exposure. High-resolution imaging by transmission electron microscopy revealed that persisting 53BP1-foci developed into DNA segments with chromatin alterations reinforcing senescence (DNA-SCARS), consistently located at the periphery of SAHFs. Quantitative immunogold-analysis by electron microscopy revealed that H2A.J, steadily co-localizing with 53BP1, is increasingly incorporated into DNA-SCARS during senescence progression. Strikingly, shRNA-mediated H2A.J depletion in fibroblasts modified senescence-associated chromatin re-structuring and abolished SASP, thereby shutting down the production of inflammatory mediators. These findings provide mechanistic insights into biological phenomena of SASP and suggest that H2A.J inhibition could ablate SASP, without affecting the senescence-associated growth arrest.

Keywords: DNA-SCARS; histone variant H2A.J; radiation-induced senescence; senescence-associated heterochromatin foci (SAHF); senescence-associated secretory phenotype (SASP); transmission electron microscopy (TEM).


Conflict of interest statement

The authors declare no potential conflicts of interest.

Figures

Figure 1
Figure 1
(A) Dose-dependent H2A.J accumulation (24 h post-IR). IFM micrographs of H2A.J staining in WT fibroblasts following IR exposure with varying doses (0.1, 1, 2, 10 Gy; 24 h post-IR) and accompanying quantification of H2A.J+ cells. (B) Short-term H2A.J accumulation following 2 Gy. IFM micrographs of WT fibroblasts show an acute increase of H2A.J+ cells following 2 Gy (upper panel) and the accumulation of H2A.J combined with 53BP1-foci (lower panel). Right graph shows quantification of 53BP1-foci and H2A.J+ cells in WT and NT fibroblasts (non-IR controls subtracted). (C) Short-term H2A.J accumulation following 20 Gy. IFM micrograph of NT and KD fibroblasts show the accumulation of H2A.J+ cells and 53BP1-foci following 20 Gy. Adjacent graph shows quantification of these markers (non-IR controls subtracted). Data are presented as mean of three experiments ±SE. * significant statistical difference to non-IR control (p < 0.05); # significant statistical difference to equivalent dose and time-point in NT fibroblasts (p < 0.05).
Figure 2
Figure 2
(A) Long-term H2A.J accumulation following IR and ETO exposure: 53BP1. IFM micrographs show H2A.J and 53BP1 staining of NT and KD fibroblasts following 20 Gy (1 and 2 weeks post-IR) or ETO exposure (2 weeks post-ETO), compared to non-exposed controls. Quantification of H2A.J+ and 53BP1+ cells 1 and 2 weeks following IR or ETO exposure, compared to non-exposed controls. (B) Long-term H2A.J accumulation following IR and ETO exposure: SA-β-Gal. IHC micrograph show H2A.J and SA-β-Gal staining of NT and KD 24 h and 2 weeks following IR (20 Gy) or ETO exposure, compared to non-exposed controls. Quantification of H2A.J and SA-β-Gal cells 24 h, 1 week and 2 weeks following IR or ETO exposure compared to non-exposed controls. Data are presented as mean of three experiments ±SE. Significant statistical difference compared to non-irradiated controls (marked by asterisks alone) or between NT and KD cells (asterisks with square brackets): * p < 0.05; *** p < 0.001.
Figure 3
Figure 3
(A) IFM: Senescence-associated heterochromatin foci (SAHFs). IFM micrographs show DAPI, H3K9me3, and H3K27me3 staining of NT and KD fibroblasts following 20 Gy (2 weeks post-IR), compared to non-IR controls. (B) IFM: Senescence-associated chromatin restructuring and nuclear enlargement. Quantification of SAHF+ cells and nuclear area in NT and KD fibroblasts following 20 Gy (2 weeks post-IR), compared to non-IR controls. Data are presented as mean of three experiments ±SE. Significant statistical difference compared to non-irradiated controls (marked by asterisks alone) or between NT and KD cells (asterisks with square brackets): ** p < 0.01; *** p < 0.001. (C) TEM: Global chromatin re-structuring resulting in SAHFs. TEM micrographs show chromatin structure with immunogold-labeling for H3K9me3 (10-nm beads, red) and H3K27me3 (6-nm beads, green) of NT and KD fibroblasts following IR (20 Gy, 2 w post-IR), compared to non-IR controls. Red marked areas are shown with higher magnification. To aid visualization of gold-beads, red and green overlays were added, and bead clusters encircled.
Figure 4
Figure 4
(A) IFM: DNA-SCARS identification. IFM micrographs of 53BP1 and PML staining of NT fibroblasts following 20 Gy (5 h, 24 h, and 2 weeks post-IR). Quantification of 53BP1-foci co-localizing with PML foci to detect acute DNA-repair foci and persistent DNA-SCARS in NT and KD fibroblasts. (B) IFM: DNA-SCARS accumulation and size. IFM micrographs of DNA-SCARS in non-IR controls, and 24 h and 2 weeks following 20 Gy in NT and KD cells. Quantification of DNA-SCARS in non-IR controls and 2 weeks after 20 Gy in NT and KD fibroblasts (upper panel). Area measurements of DNA-SCARS 24 h and 2 weeks following 20 Gy (lower panel). Data are presented as mean of three experiments ±SE. Significant statistical difference compared to non-irradiated controls (marked by asterisks alone) or between NT and KD cells (asterisks with square brackets): * p < 0.05; ** p < 0.01; *** p < 0.001. (C) TEM: H2A.J/53BP1 localization in DNA-SCARS. TEM micrographs show gold-labelled H2A.J (6-nm beads) and 53BP1 (10-nm beads) in NT and KD fibroblasts following 20 Gy (2 weeks post-IR), compared to non-IR controls. Red marked areas are shown with higher magnification; to aid visualization of gold-beads, green and red overlays were added, and bead clusters encircled (green: H2A.J only; red: 53BP1 only; yellow: co-localization of H2A.J and 53BP1).
Figure 5
Figure 5
(A) IFM: Proximity ligation assay: increased localization of H2A.J to 53BP1 in DNA-SCARS. IFM micrograph of proximity ligation foci generated between 53BP1 and H2A.J in NT and KD fibroblasts in non-IR control and 2 weeks after 20 Gy IR. Quantification of PLA foci in NT and KD fibroblasts in non-IR control and 2 weeks after 20 Gy. Data are presented as mean of three experiments ±SE. (B) TEM: Quantification of H2A.J/53BP1 beads. H2A.J- and 53BP1-labeled gold-beads were quantified in 25 nuclear sections of NT and KD fibroblasts after 20 Gy (2 w post-IR), compared to non-IR controls. Different colors indicate potential co-localization between H2A.J/53BP1 and spatial localization inside and outside DNA-SCARS. (C) TEM: Quantification of H2A.J/53BP1 beads per cluster. For H2A.J and 53BP1, the number of beads was quantified for different cluster sizes (1, 2–3, 4–6, 7–9, ≥10 beads/cluster) in 25 nuclear sections of NT and KD fibroblasts following 20 Gy (2 w post-IR), compared to non-IR controls. (green: H2A.J/53BP1 co-localization inside DNA-SCARS; light green: H2A.J alone inside DNA-SCARS; grey H2A.J alone outside DNA-SCARS; dark red: 53BP1/H2A.J co-localization inside DNA-SCARS; red: 53BP1 alone inside DNA-SCARS; grey: 53BP1 outside DNA-SCARS). (D) TEM: H2A.J/53BP1 cluster sizes within DNA-SCARS. Quantification of H2A.J and 53BP1 cluster size distribution as percentage of total beads within DNA-SCARS. All TEM data are presented as mean 25 nuclear sections ±SE. Significant statistical difference compared to non-irradiated controls (marked by asterisks alone) and between NT and KD cells (asterisks with square brackets): * p < 0.05; ** p < 0.01; *** p < 0.001.
Figure 6
Figure 6
(A) ELISA: SASP analysis. Quantification of SASP factors in conditioned medium of NT and KD fibroblasts analyzed 2 weeks after 20 Gy (2 weeks post-IR), compared to non-IR controls. # For MCP1 analysis NT 20 Gy, 2 weeks post-IR sample was diluted by factor 40 (10,000 cells/mL of conditioned medium) to ensure results lie within the linear range of the assay. (B) RT-qPCR: SASP analysis. Quantification of expression levels of equivalent SASP genes analyzed 2 weeks after 20 Gy (2 weeks post-IR), compared to non-IR controls. Results were normalized to GAPDH and to corresponding gene expression levels in non-IR NT controls. Red dotted line indicates the mRNA expression of non-irradiated NT cells. Significant statistical difference compared to non-irradiated controls (marked by asterisks alone) or between NT and KD cells (asterisks with square brackets): * p < 0.05; ** p < 0.01.

Similar articles

Cited by

References

    1. Campisi J., Robert L. Cell senescence: Role in aging and age-related diseases. Interdiscip. Top. Gerontol. 2014;39:45–61. doi: 10.1159/000358899. - DOI - PMC - PubMed
    1. Tchkonia T., Zhu Y., van Deursen J., Campisi J., Kirkland J.L. Cellular senescence and the senescent secretory phenotype: Therapeutic opportunities. J. Clin. Investig. 2013;123:966–972. doi: 10.1172/JCI64098. - DOI - PMC - PubMed
    1. Price B.D., D’Andrea A.D. Chromatin remodeling at DNA double-strand breaks. Cell. 2013;152:1344–1354. doi: 10.1016/j.cell.2013.02.011. - DOI - PMC - PubMed
    1. Soria G., Polo S.E., Almouzni G. Prime, repair, restore: The active role of chromatin in the DNA damage response. Mol. Cell. 2012;46:722–734. doi: 10.1016/j.molcel.2012.06.002. - DOI - PubMed
    1. Panier S., Boulton S.J. Double-strand break repair: 53BP1 comes into focus. Nat. Rev. Mol. Cell Biol. 2014;15:7–18. doi: 10.1038/nrm3719. - DOI - PubMed

LinkOut - more resources