

An Improved Method of Handling Missing Values in the Analysis of Sample Entropy for Continuous Monitoring of Physiological Signals
- PMID: 33266989
- PMCID: PMC7514754
- DOI: 10.3390/e21030274
An Improved Method of Handling Missing Values in the Analysis of Sample Entropy for Continuous Monitoring of Physiological Signals
Abstract
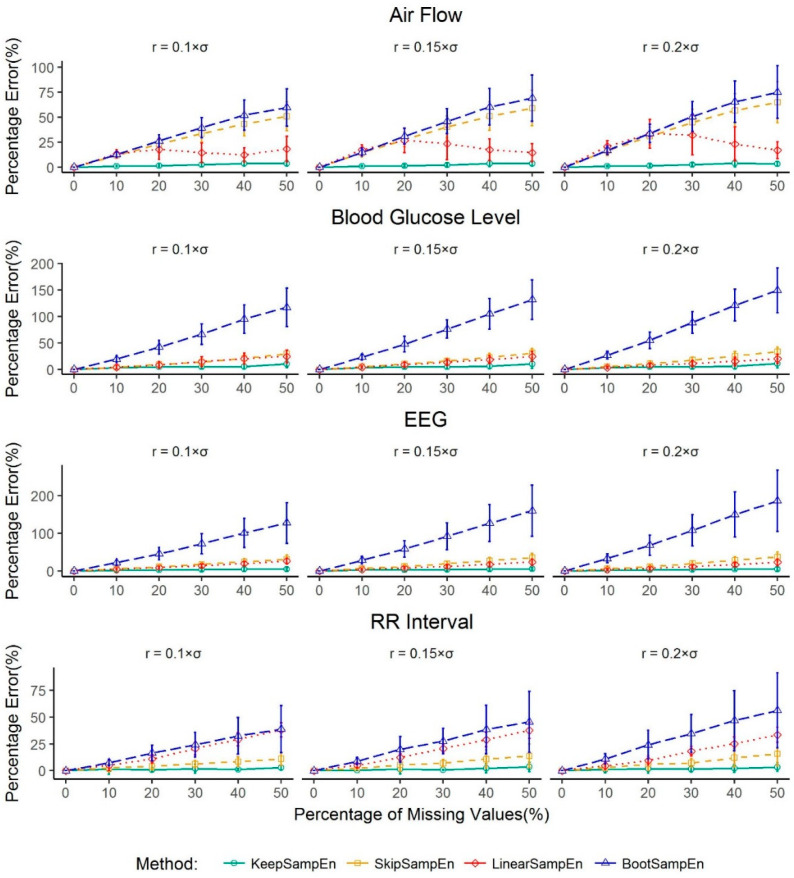
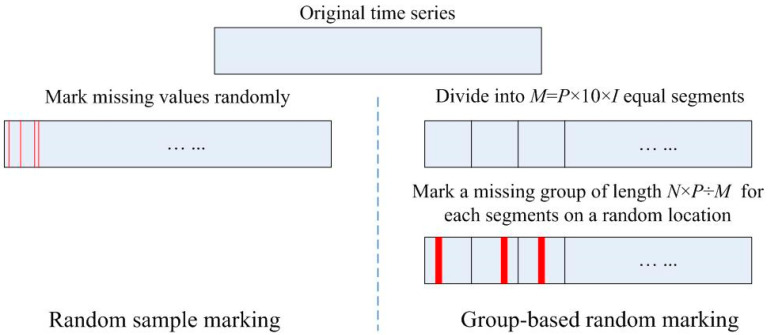
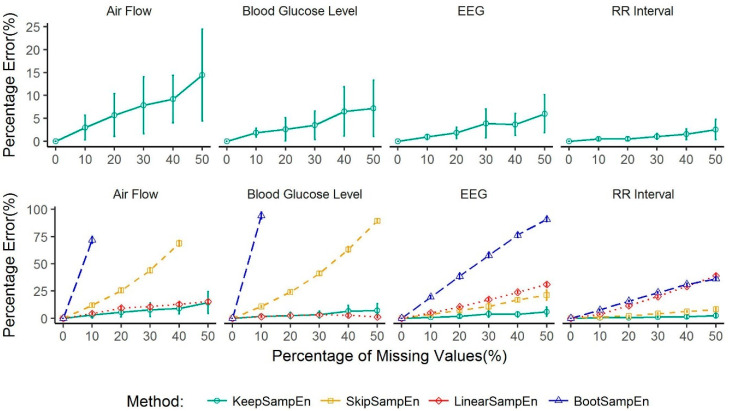
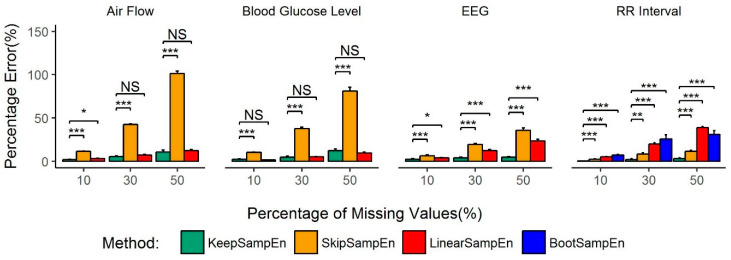
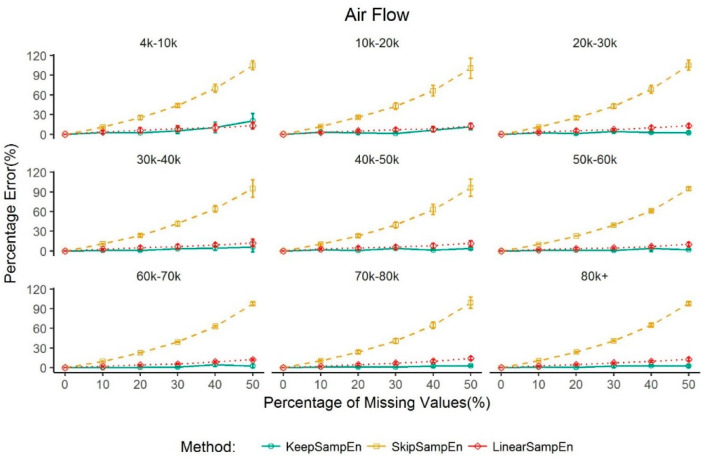
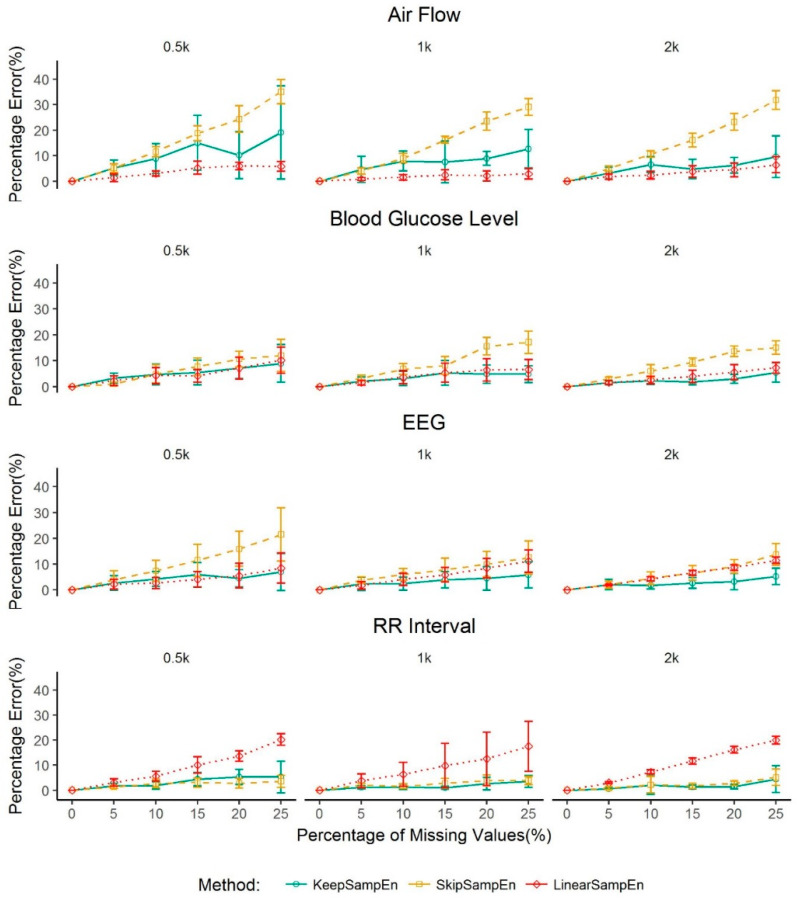
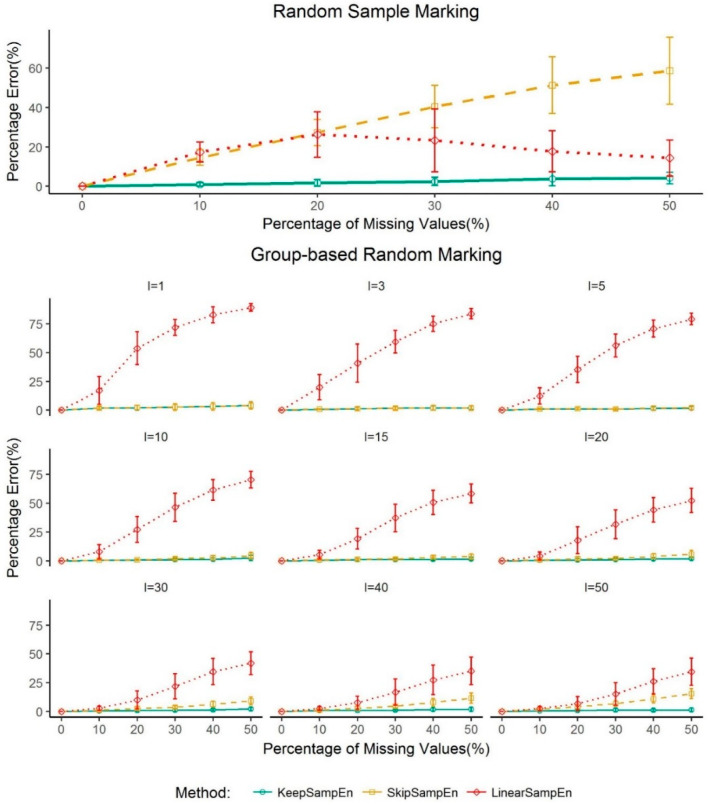
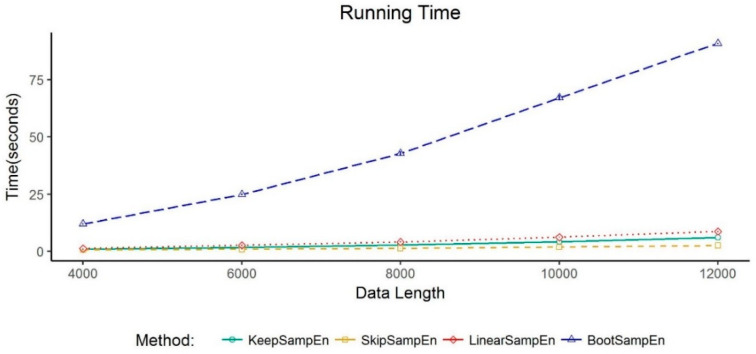
Medical devices generate huge amounts of continuous time series data. However, missing values commonly found in these data can prevent us from directly using analytic methods such as sample entropy to reveal the information contained in these data. To minimize the influence of missing points on the calculation of sample entropy, we propose a new method to handle missing values in continuous time series data. We use both experimental and simulated datasets to compare the performance (in percentage error) of our proposed method with three currently used methods: skipping the missing values, linear interpolation, and bootstrapping. Unlike the methods that involve modifying the input data, our method modifies the calculation process. This keeps the data unchanged which is less intrusive to the structure of the data. The results demonstrate that our method has a consistent lower average percentage error than other three commonly used methods in multiple common physiological signals. For missing values in common physiological signal type, different data size and generating mechanism, our method can more accurately extract the information contained in continuously monitored data than traditional methods. So it may serve as an effective tool for handling missing values and may have broad utility in analyzing sample entropy for common physiological signals. This could help develop new tools for disease diagnosis and evaluation of treatment effects.
Keywords: complexity; medical information; missing values; physiological data; sample entropy.
Conflict of interest statement
The authors declare no potential conflict of interest with respect to the research, authorship, and/or publication of this article.
Figures
Similar articles
-
Augmentation of Dispersion Entropy for Handling Missing and Outlier Samples in Physiological Signal Monitoring.Entropy (Basel). 2020 Mar 11;22(3):319. doi: 10.3390/e22030319. Entropy (Basel). 2020. PMID: 33286093 Free PMC article.
-
Sample Entropy Computation on Signals with Missing Values.Entropy (Basel). 2024 Aug 19;26(8):704. doi: 10.3390/e26080704. Entropy (Basel). 2024. PMID: 39202174 Free PMC article.
-
Analysis of the Impact of Interpolation Methods of Missing RR-intervals Caused by Motion Artifacts on HRV Features Estimations.Sensors (Basel). 2019 Jul 18;19(14):3163. doi: 10.3390/s19143163. Sensors (Basel). 2019. PMID: 31323850 Free PMC article.
-
Entropy for the Complexity of Physiological Signal Dynamics.Adv Exp Med Biol. 2017;1028:39-53. doi: 10.1007/978-981-10-6041-0_3. Adv Exp Med Biol. 2017. PMID: 29058215 Review.
-
Entropy Change of Biological Dynamics in Asthmatic Patients and Its Diagnostic Value in Individualized Treatment: A Systematic Review.Entropy (Basel). 2018 May 24;20(6):402. doi: 10.3390/e20060402. Entropy (Basel). 2018. PMID: 33265493 Free PMC article. Review.
Cited by
-
Augmentation of Dispersion Entropy for Handling Missing and Outlier Samples in Physiological Signal Monitoring.Entropy (Basel). 2020 Mar 11;22(3):319. doi: 10.3390/e22030319. Entropy (Basel). 2020. PMID: 33286093 Free PMC article.
-
Complexity analysis of head movements in autistic toddlers.J Child Psychol Psychiatry. 2023 Jan;64(1):156-166. doi: 10.1111/jcpp.13681. Epub 2022 Aug 14. J Child Psychol Psychiatry. 2023. PMID: 35965431 Free PMC article.
-
A Novel Microwave Treatment for Sleep Disorders and Classification of Sleep Stages Using Multi-Scale Entropy.Entropy (Basel). 2020 Mar 17;22(3):347. doi: 10.3390/e22030347. Entropy (Basel). 2020. PMID: 33286121 Free PMC article.
-
Optimizing the measurement of sample entropy in resting-state fMRI data.Front Neurol. 2024 Feb 15;15:1331365. doi: 10.3389/fneur.2024.1331365. eCollection 2024. Front Neurol. 2024. PMID: 38426165 Free PMC article.
-
Exploring Complexity of Facial Dynamics in Autism Spectrum Disorder.IEEE Trans Affect Comput. 2023 Apr-Jun;14(2):919-930. doi: 10.1109/taffc.2021.3113876. Epub 2021 Sep 20. IEEE Trans Affect Comput. 2023. PMID: 37266390 Free PMC article.
References
-
- Shannon C.E., Weaver W. The Mathematical Theory of Information. Math. Gazette. 1949;97:170–180.
-
- Henriques T.S., Costa M.D., Mathur P., Mathur P., Davis R.B., Mittleman M.A., Khabbaz K.R., Goldberger A.L., Subramaniam B. Complexity of Preoperative Blood Pressure Dynamics: Possible Utility in Cardiac Surgical Risk Assessment. J. Clin. Monit. Comput. 2018;33:31–38. doi: 10.1007/s10877-018-0133-4. - DOI - PMC - PubMed
Grants and funding
LinkOut - more resources
Full Text Sources
