

The Potential Role of CERS1 in Autophagy Through PI3K/AKT Signaling Pathway in Hypophysoma
- PMID: 33267708
- PMCID: PMC7720334
- DOI: 10.1177/1533033820977536
The Potential Role of CERS1 in Autophagy Through PI3K/AKT Signaling Pathway in Hypophysoma
Abstract
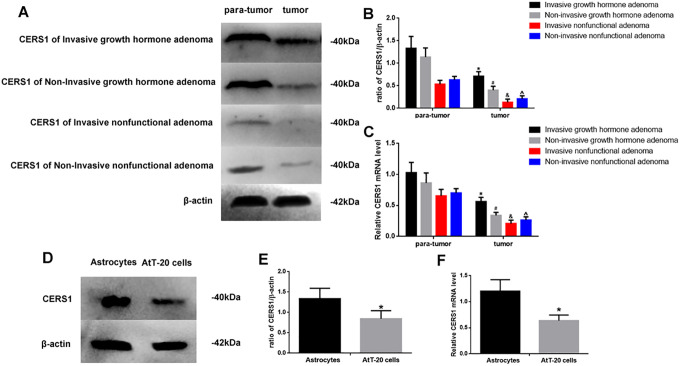
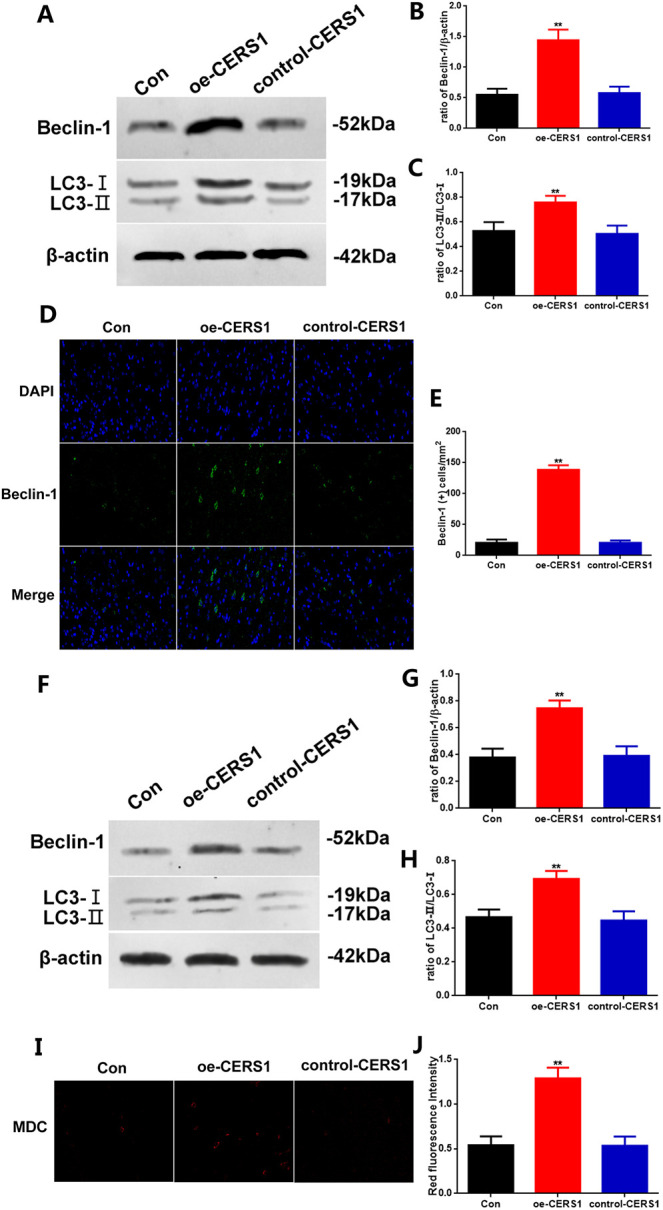
To explore the role and mechanism of CERS1 in hypophysoma and investigate whether CERS1 overexpression can change the autophagy process of hypophysoma, and then to explore whether CERS1's effect was regulated by the PI3K/AKT signaling pathway. Western blot and RT-PCR were used to analyze the expression or mRNA level of CERS1 at different tissues or cell lines. Afterwards, the occurrence and development of hypophysoma in vivo and in vitro, respectively, was observed by using CERS1 overexpression by lentivirus. Finally, MK-2206 and LY294002 were applied to discuss whether the role of CERS1 was regulated by the PI3K/AKT signaling pathway. Results show that the CERS1 expression and mRNA level in tumor or AtT-20 cells were decreased. CERS1 over-expressed by lentivirus could inhibit hypophysoma development in vivo and in vitro by reducing tumor volume and weight, weakening tumor proliferation and invasion, and enhancing apoptosis. In addition, shCERS1 could reverse the process. The above results indicate that CERS1 is possibly able to enhance autophagy in hypophysoma through the PI3K/AKT signaling pathway.
Keywords: CERS1; PI3K/AKT signaling pathway; autophagy; hypophysoma.
Conflict of interest statement
Figures


Similar articles
-
MicroRNA-106b promotes pituitary tumor cell proliferation and invasion through PI3K/AKT signaling pathway by targeting PTEN.Tumour Biol. 2016 Oct;37(10):13469-13477. doi: 10.1007/s13277-016-5155-2. Epub 2016 Jul 27. Tumour Biol. 2016. PMID: 27465551
-
S100A8 knockdown activates the PI3K/AKT signaling pathway to inhibit microglial autophagy and improve cognitive impairment mediated by chronic sleep deprivation.Int Immunopharmacol. 2024 Dec 25;143(Pt 2):113375. doi: 10.1016/j.intimp.2024.113375. Epub 2024 Oct 16. Int Immunopharmacol. 2024. PMID: 39418730
-
SOCS5 inhibition induces autophagy to impair metastasis in hepatocellular carcinoma cells via the PI3K/Akt/mTOR pathway.Cell Death Dis. 2019 Aug 13;10(8):612. doi: 10.1038/s41419-019-1856-y. Cell Death Dis. 2019. PMID: 31406106 Free PMC article.
-
Knockdown of TBRG4 suppresses proliferation, invasion and promotes apoptosis of osteosarcoma cells by downregulating TGF-β1 expression and PI3K/AKT signaling pathway.Arch Biochem Biophys. 2020 Jun 15;686:108351. doi: 10.1016/j.abb.2020.108351. Epub 2020 Mar 30. Arch Biochem Biophys. 2020. PMID: 32240636
-
Polyphyllin I Promoted Melanoma Cells Autophagy and Apoptosis via PI3K/Akt/mTOR Signaling Pathway.Biomed Res Int. 2020 Jul 17;2020:5149417. doi: 10.1155/2020/5149417. eCollection 2020. Biomed Res Int. 2020. PMID: 32733943 Free PMC article.
Cited by
-
The ceramide synthase (CERS/LASS) family: Functions involved in cancer progression.Cell Oncol (Dordr). 2023 Aug;46(4):825-845. doi: 10.1007/s13402-023-00798-6. Epub 2023 Mar 22. Cell Oncol (Dordr). 2023. PMID: 36947340 Review.
-
Aggressive PitNETs and Potential Target Therapies: A Systematic Review of Molecular and Genetic Pathways.Int J Mol Sci. 2023 Oct 29;24(21):15719. doi: 10.3390/ijms242115719. Int J Mol Sci. 2023. PMID: 37958702 Free PMC article.
-
Transcriptomic analyses of human brains with Alzheimer's disease identified dysregulated epilepsy-causing genes.Epilepsy Behav. 2025 Jul;168:110421. doi: 10.1016/j.yebeh.2025.110421. Epub 2025 Apr 17. Epilepsy Behav. 2025. PMID: 40250147
-
Transcriptomic analyses of human brains with Alzheimer's disease identified dysregulated epilepsy-causing genes.medRxiv [Preprint]. 2025 Jan 31:2025.01.02.25319900. doi: 10.1101/2025.01.02.25319900. medRxiv. 2025. Update in: Epilepsy Behav. 2025 Jul;168:110421. doi: 10.1016/j.yebeh.2025.110421. PMID: 39974070 Free PMC article. Updated. Preprint.
References
-
- Knappe UJ, Petroff D, Quinkler M, et al. Fractionated radiotherapy and radiosurgery in acromegaly: analysis of 352 patients from the German Acromegaly Registry. Eur J Endocrinol. 2020;182(3):275–284. doi:10.1530/EJE-19-0784 - PubMed
-
- Baxter JD, Duncan K, Chu W, et al. Molecular biology of human renin and its gene. Recent Prog Horm Res. 1991;47:211–257; discussion 257-258 doi:10.1016/b978-0-12-571147-0.50011 -1 - PubMed
MeSH terms
Substances
LinkOut - more resources
Full Text Sources
Medical
Molecular Biology Databases
