. 2020 Dec 2;20(1):1180.
doi: 10.1186/s12885-020-07660-0.

LAD1 expression is associated with the metastatic potential of colorectal cancer cells

Affiliations

LAD1 expression is associated with the metastatic potential of colorectal cancer cells

Byul Moon et al. BMC Cancer. .

Abstract

Background: Anchoring filament protein ladinin-1 (LAD1) was related to the aggressive progression of breast, lung, laryngeal and thyroid cancers. However, the association of LAD1 with colorectal cancer remained unknown. Here, to determine the relationship of LAD1 with colorectal cancer progression, we explored the effect of LAD1 loss on the malignant features of colorectal cancer cells.

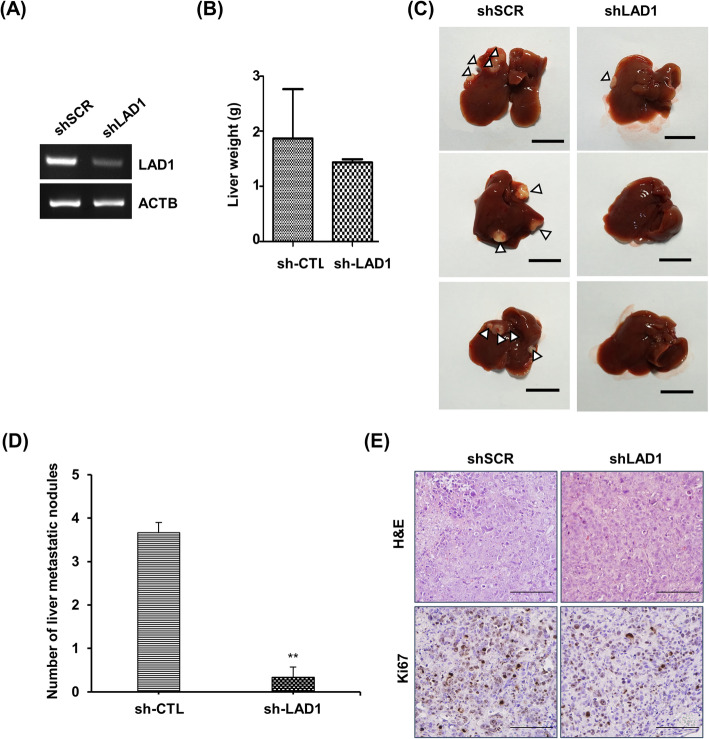
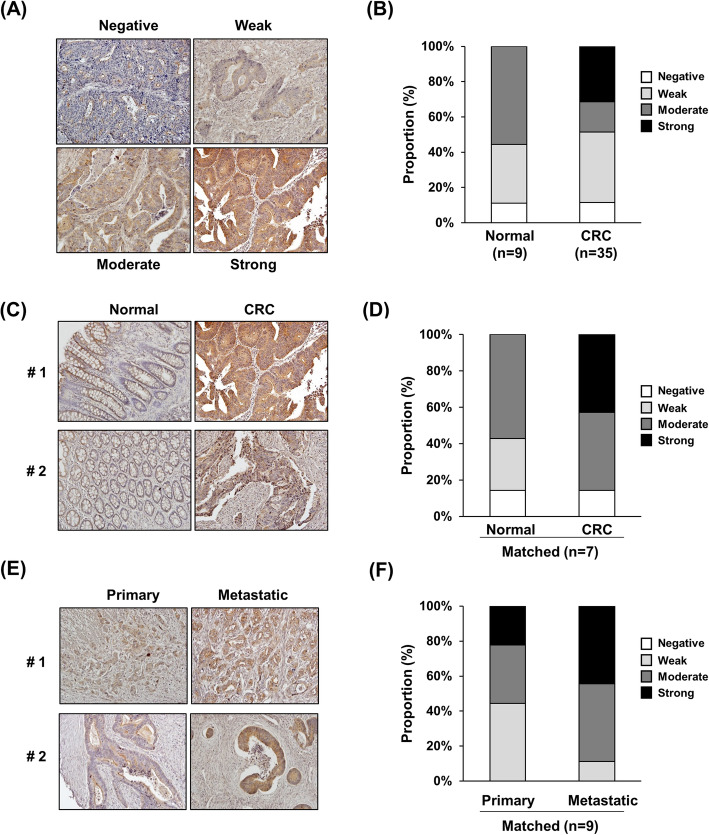
Methods: We constructed LAD1-depleted cell lines and examined the effect of LAD1 deficiency on the phenotypic and molecular features of colorectal cancer cells in vitro. The function of LAD1 in metastasis in vivo was examined by establishing a spleen-to-liver metastasis mouse model. LAD1 protein expression in colorectal cancer patient specimens was assessed by immunohistochemistry of tumor microarrays.

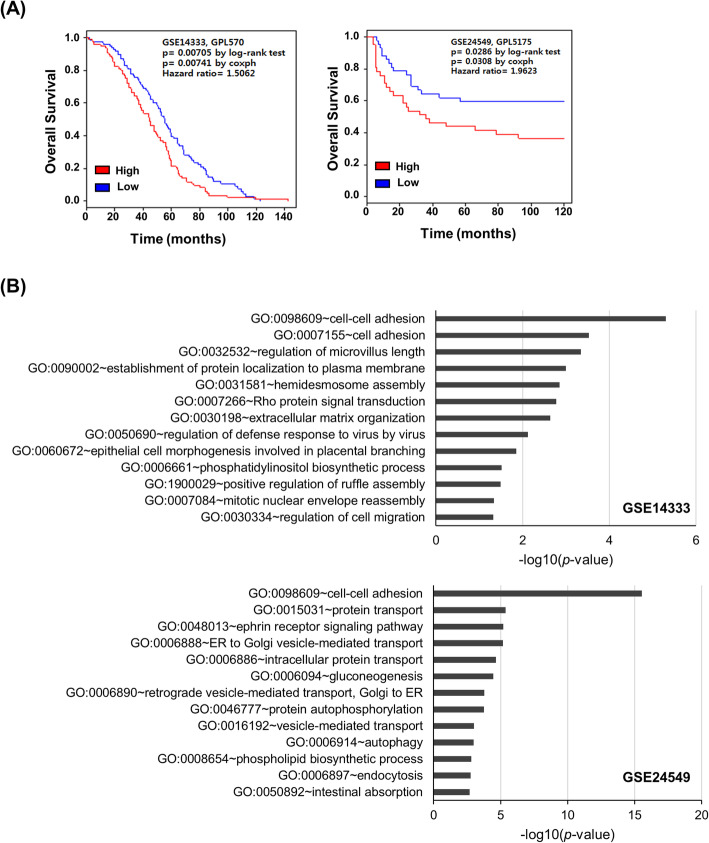
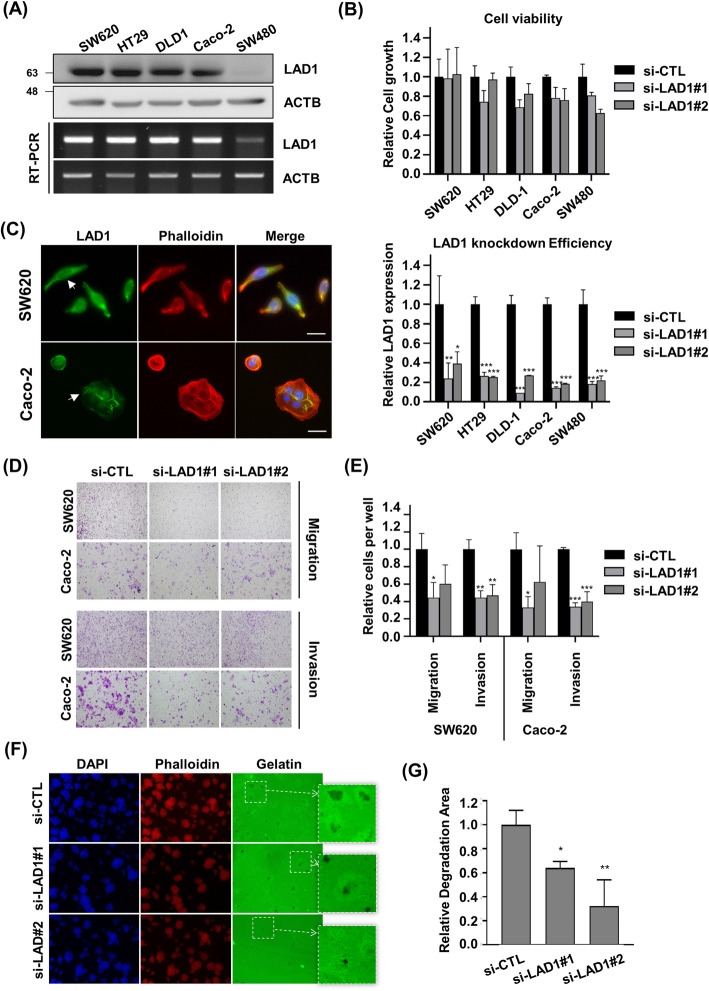
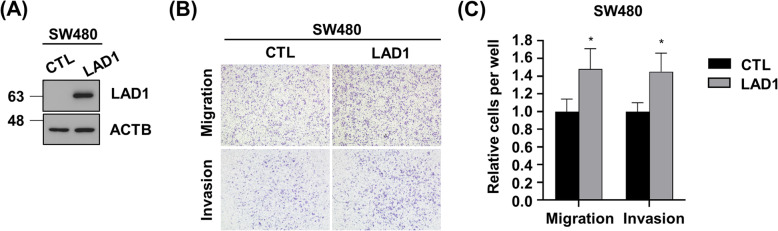
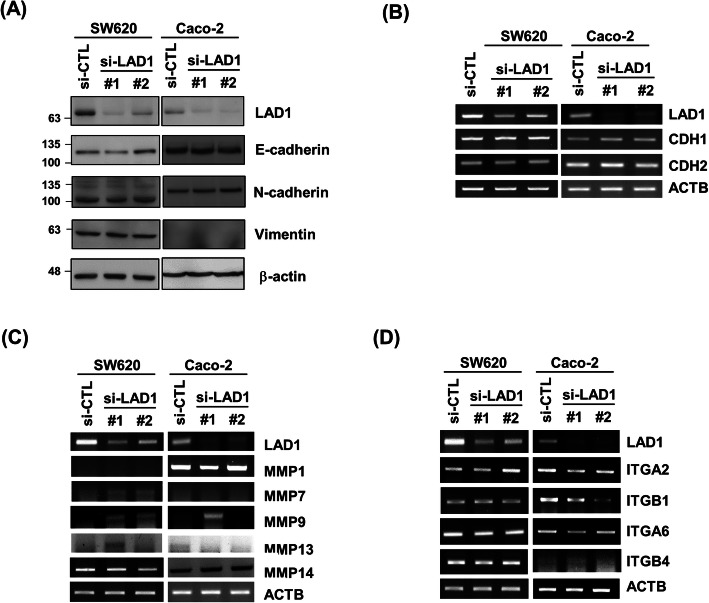
Results: We found that LAD1 was abundant in most colorectal cancer cells. In addition, high expression of LAD1 significantly correlated with poor patient outcome. LAD1 depletion inhibited the migration and invasion of two different colorectal cancer cell lines, SW620 and Caco-2, without affecting their proliferation. In addition, LAD1 loss led to defects in liver metastasis of SW620 cells in the mouse model. Immunohistochemistry of colorectal cancer tissues revealed LAD1 enrichment in metastatic tissues compared to that in primary tumor and normal tissues.

Conclusion: These results suggest that LAD1 expression is associated with the metastatic progression of colorectal cancer by promoting the migration and invasion of cancer cells.

Keywords: Colorectal cancer; Invasion; Ladinin-1; Metastasis; Migration.


Conflict of interest statement

The authors declare that they have no competing interests.

Figures

Fig. 1
Fig. 1
LAD1 expression is correlated with poor prognosis in colorectal cancer patients. a Patients with high LAD1 expression exhibited poor overall survival. The median expression value was used for stratification of patients into the high LAD1 expression (red) and the low LAD1 expression (blue) groups. Kaplan-Meier plots show significant correlations of LAD1 expression with poor survival of colorectal cancer patients whose gene expression data were extracted from GSE14333 (left) and GSE24549 (right). b Biological process annotation chart of genes that positively correlated with LAD1 in GSE14333 (upper) and GSE24549 (lower). Gene Ontology of the genes whose expression was positively correlated with LAD1 expression was analyzed by DAVID [16]
Fig. 2
Fig. 2
LAD1 is involved in the migration and invasion of colorectal cancer cells in vitro. a LAD1 was highly expressed in colorectal cancer cell lines. The expression of LAD1 in diverse human colorectal cancer cell lines was determined by immunoblots (IB) with anti-LAD1 antibody and RT-PCR. Shown are the cropped blot and gel images. b LAD1 depletion had little effect on the viability of colorectal cancer cells in vitro. The viability of colorectal cancer cells was examined with a Cell Titer-Blue Cell® viability assay. Relative cell growth was calculated by normalizing fluorescent signals in si-LAD1 with those in si-CTL (upper). The knockdown efficiency of LAD1 in human colorectal cancer cell lines was estimated by qRT-PCR (lower). Error bars represent the mean standard deviation (n = 3; *, p < 0.05, **, p < 0.01, ***, p < 0.001). c LAD1 was detected at cellular edges and partly with actin filaments in SW620 and Caco-2 cells. Localization of LAD1 and F-actin was visualized by immunofluorescence using anti-LAD1 antibody (green) and phalloidin (red). Scale bars denote 20 μm. Arrows indicate stress fiber-like structures stained by LAD1. d and e LAD1 knockdown inhibits the migration and invasion of SW620 and Caco-2 cells. SW620 and Caco-2 cells depleted of LAD1 with siRNAs were subjected to Transwell assays with or without Matrigel coating for migration or invasion measurements. Representative images of migrated and invaded cells are shown in (d). Relative cell numbers of migrated and invaded cells per well were normalized by the numbers of si-CTL-treated cells with those of si-LAD1-treated cells (e). Error bars represent the mean standard deviation (n = 3; *, p < 0.05, **, p < 0.01, ***, p < 0.001) (f and g) LAD1 depletion reduces the invadopodia-forming capability of SW620 cells. Degraded areas of fluorescently labeled gelatin matrix were visualized (f), and fluorescent-free areas were measured by ImageJ. Relative degradation area was calculated by normalizing fluorescent-free areas in si-LAD1 cells with those in si-CTL cells (g). Error bars represent the mean standard deviation (n = 3; *, p < 0.05, **, p < 0.01)
Fig. 3
Fig. 3
Overexpression of ectopic LAD1 promotes migration and invasion of SW480 cells in vitro. a LAD1 expression increased in SW480 cells transfected with ectopic LAD1 (LAD1) compared with counterpart cells with mock vector (CTL). b and c LAD1 overexpression increased the migration and invasion of SW480 cells determined by Transwell assays. Representative images of migrated and invaded cells are shown in (b). Relative cell numbers of migrated and invaded cells per well were normalized by the numbers of CTL cells with those of LAD1 cells (c). Error bars represent the mean standard deviation (n = 3; *, p < 0.05)
Fig. 4
Fig. 4
LAD1 expression barely affects the expression of EMT markers, matrix metalloproteases, and integrins. a, b LAD1 knockdown had little effect on the expression of EMT markers in SW620 and Caco-2 cells. Expression of the E-cadherin, N-cadherin, and vimentin proteins was determined by immunoblots with specific antibodies against each protein (a) and by RT-PCR (b). c, d LAD1 depletion caused little change in the expression of matrix metalloproteases (c) and integrins (d) in SW620 and Caco-2 cells. The RNA levels of each gene were measured by RT-PCR. Note that the cropped blot and gel images are shown
Fig. 5
Fig. 5
LAD1 contributes to liver metastasis of SW620 cells in vivo. a LAD1 in SW620 cells was stably knocked down by shRNA. The levels of LAD1 RNA in cells depleted of LAD1 (shLAD1) or control cells infected with virus carrying scramble RNA (shSCR) were determined by RT-PCR. Shown are the cropped gel image. b The liver weights of mice injected with SW620 cells depleted of LAD1 (shLAD1, n = 3) were comparable with those of the control (shSCR, n = 3). c, d Livers from shLAD1 mice carried fewer tumor nodules (marked by arrowheads) than those from shSCR mice. Representative images of metastatic nodules in mouse livers with scale bars for 1 cm are shown in c. The number of metastatic nodules in the liver is shown in (d). e H&E staining and immunohistochemistry with anti-Ki67 antibody showed that the nodules in the liver were tumorigenic. Scale bars denote 200 μm
Fig. 6
Fig. 6
Enhanced LAD1 expression is associated with metastatic colorectal cancer tissues. a, b LAD1 expression was enriched in colorectal cancer (CRC) tissues compared with normal tissues. Staining intensities of anti-LAD1 antibody in colorectal cancer tissues were stratified into 4 categories (negative, weak, moderate, and strong; A). Strongly stained tissues were detected only in CRC (n = 35) and not in normal controls (n = 9; b). c, d Strong LAD1 staining was observed only in CRC tissues and not in the matched normal tissues (n = 7). Representative images of LAD1 immunohistochemistry and the proportion of differentially stained LAD1 tissues are shown in (c) and (d), respectively. e, f Comparison of matched primary and metastatic CRC tissues (e) showed a higher proportion of strong LAD1 staining intensities in metastatic tissues (n = 9; f)

References

    1. Dekker E, Tanis PJ, Vleugels JLA, Kasi PM, Wallace MB. Colorectal cancer. Lancet. 2019;394(10207):1467–1480. doi: 10.1016/S0140-6736(19)32319-0. - DOI - PubMed
    1. Steeg PS. Targeting metastasis. Nat Rev Cancer. 2016;16(4):201–218. doi: 10.1038/nrc.2016.25. - DOI - PMC - PubMed
    1. Fakih MG. Metastatic colorectal cancer: current state and future directions. J Clin Oncol. 2015;33(16):1809–1824. doi: 10.1200/JCO.2014.59.7633. - DOI - PubMed
    1. Motoki K, Megahed M, LaForgia S, Uitto J. Cloning and chromosomal mapping of mouse ladinin, a novel basement membrane zone component. Genomics. 1997;39(3):323–330. doi: 10.1006/geno.1996.4507. - DOI - PubMed
    1. Teixeira JC, de Filippo C, Weihmann A, Meneu JR, Racimo F, Dannemann M, Nickel B, Fischer A, Halbwax M, Andre C, et al. Long-term balancing selection in LAD1 maintains a missense trans-species polymorphism in humans, chimpanzees, and bonobos. Mol Biol Evol. 2015;32(5):1186–1196. doi: 10.1093/molbev/msv007. - DOI - PubMed