. 2020 Dec;8(2):e001372.
doi: 10.1136/jitc-2020-001372.

Mitochondrial Lon-induced mtDNA leakage contributes to PD-L1-mediated immunoescape via STING-IFN signaling and extracellular vesicles

Affiliations

Mitochondrial Lon-induced mtDNA leakage contributes to PD-L1-mediated immunoescape via STING-IFN signaling and extracellular vesicles

An Ning Cheng et al. J Immunother Cancer. 2020 Dec.

Abstract

Background: Mitochondrial Lon is a chaperone and DNA-binding protein that functions in protein quality control and stress response pathways. The level of Lon regulates mitochondrial DNA (mtDNA) metabolism and the production of mitochondrial reactive oxygen species (ROS). However, there is little information in detail on how mitochondrial Lon regulates ROS-dependent cancer immunoescape through mtDNA metabolism in the tumor microenvironment (TME).

Methods: We explored the understanding of the intricate interplay between mitochondria and the innate immune response in the inflammatory TME.

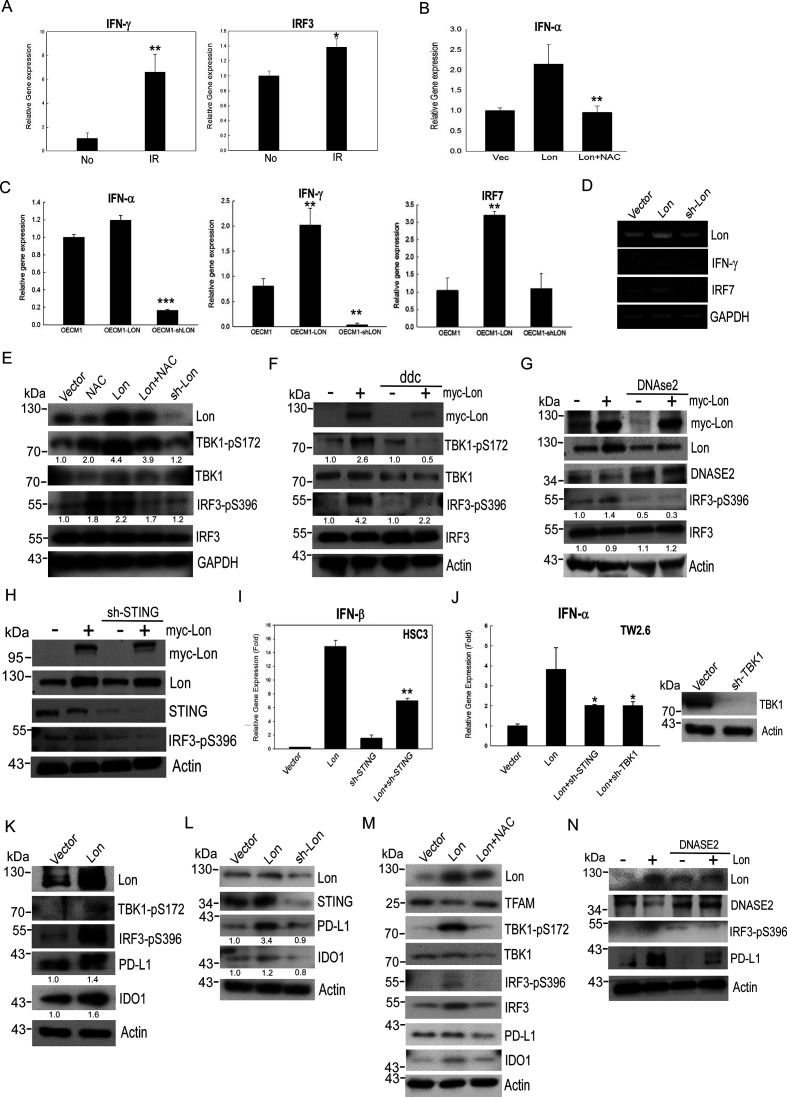
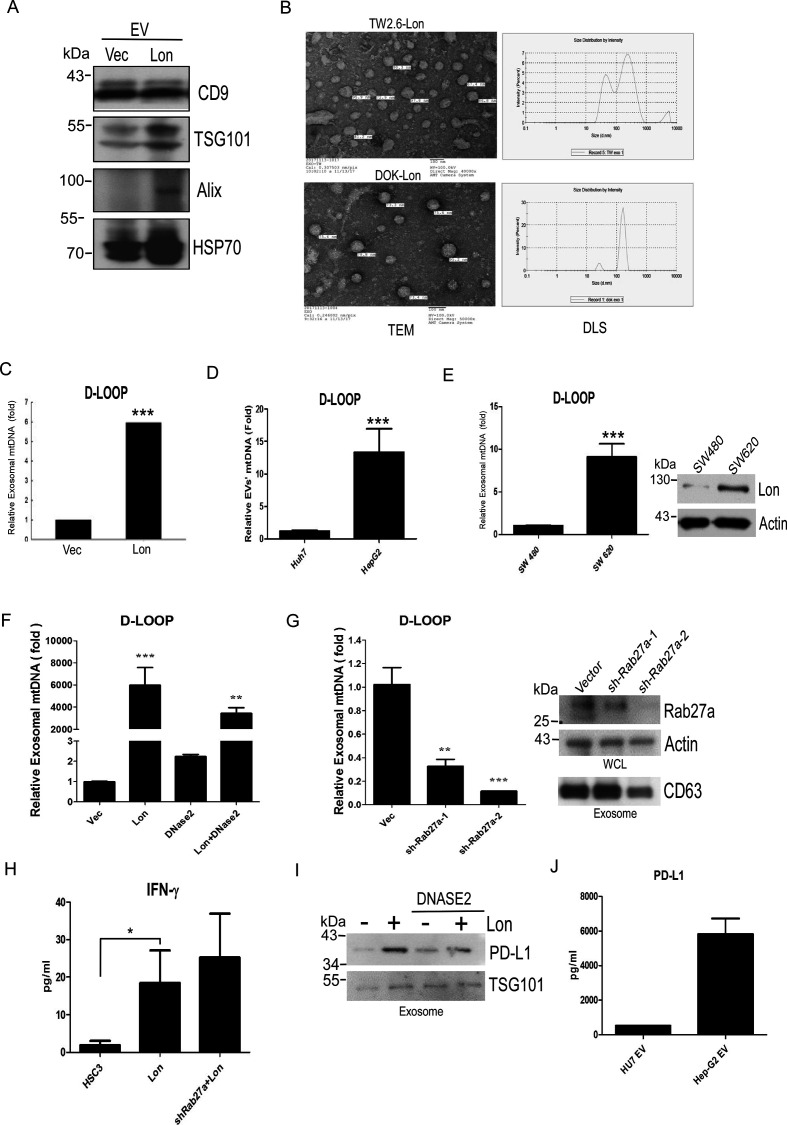
Results: We found that oxidized mtDNA is released into the cytosol when Lon is overexpressed and then it induces interferon (IFN) signaling via cGAS-STING-TBK1, which upregulates PD-L1 and IDO-1 expression to inhibit T-cell activation. Unexpectedly, upregulation of Lon also induces the secretion of extracellular vehicles (EVs), which carry mtDNA and PD-L1. Lon-induced EVs further induce the production of IFN and IL-6 from macrophages, which attenuates T-cell immunity in the TME.

Conclusions: The levels of mtDNA and PD-L1 in EVs in patients with oral cancer function as a potential diagnostic biomarker for anti-PD-L1 immunotherapy. Our studies provide an insight into the immunosuppression on mitochondrial stress and suggest a therapeutic synergy between anti-inflammation therapy and immunotherapy in cancer.

Keywords: inflammation; interferon inducers; tumor biomarkers; tumor escape; tumor microenvironment.


Conflict of interest statement

Competing interests: None declared.

Figures

Figure 1
Figure 1
Mitochondrial Lon induces oxidative stress that persuades mitochondrial DNA (mtDNA) damages. (A) Mitochondrial Lon overexpression induces ROS production. Mitochondrial superoxide generation from Lon-overexpressing OECM-1 cells was assessed by flow cytometry after cells were treated with MitoSox. H2O2 treatment acts as a positive control. The histogram of FACS plots is shown in right panel. The error bars shown in the panel represent the SD from three independent experiments. *p<0.05; **p<0.01. (B) Mitochondrial Lon induces ROS-dependent mtDNA damages of common deletion (CD). The level of common deletion of 4977 bp (CD4977) was semi-quantified by PCR. The HSC3 cells were transiently transfected with vector or Lon for 36 hours and treated with anti-oxidant NAC (2 mM) or not for 1 hour prior to cell collection. Data from three independent experiments. *p<0.05. (C, D) Mitochondrial Lon induces ROS-dependent DNA damages. (C) Mitochondrial Lon-induced oxidative damages of mtDNA and nuclear DNA were verified by immunofluorescence. HSC3 cells were transiently transfected with vector or Lon for 24 hours and treated with Trolox (0.5 mM) for 5 hours or not. The cells were fixed and immunostained by 8-hydroxy-2′-deoxyguanosine (8-OHdG, green) and anti-TFAM (red) antibodies. DNA was stained with DAPI (blue). HSC-3 cells were treated with UV 50 kJ/m2 as a positive control. Scale bars=20 µm. (D) Mitochondrial Lon-induced oxidative damages of mtDNA and nuclear DNA were verified by 8-OHdG level through ELISA. HSC3 cells were transiently transfected with vector or Lon for 24 hours and treated with Trolox (0.5 mM) for 5 hours or not. Their genomic DNA was isolated using Tissue & Cell genomic DNA purification kit (GeneMark). The ELISA of 8-OHdG was performed using 2 µg digested genomic DNA samples according to the commercial manufacturer’s protocol. HSC3 cells were treated with UV 50 kJ/m2 and allowed 5 hours of recovery. The determination range was 0.9375–60 ng/mL. The error bars shown in the panel represent the SD from three independent experiments. *p<0.05; **p<0.01; ***p<0.001. (E) Mitochondrial Lon overexpression inhibits mtDNA repair capacity. HSC3 cells were transiently transfected with vector or Lon for 24 hours and treated with 2 mM H2O2 for 1 hour. Then the cells were collected at recovery time points of 0, 1, 2, 4, and 24 hours after H2O2 treatment. Long-range PCR of full-length mtDNA was performed. An equal amount of mtDNA template in each sample normalized by the mtND1 gene was used for the long-range PCR.
Figure 2
Figure 2
Lon overexpression promotes the accumulation of cytosolic mtDNA. (A) Isolation flowchart of cytosolic mtDNA fraction. (B) Cytosolic and mitochondrial fractions were isolated from oral squamous cell carcinoma (OSCC) cells using the digitonin buffer and confirmed by immunoblotting using the indicated antibodies. Cyt, supernatant; Pel, pellet; WCE, whole cell extract. (C) Mitochondrial Lon induces mtDNA release into the cytosol in OSCC. The ratio of cytoplasmic to total mtDNA was determined by qPCR analysis of DOK cells transfected with the plasmids encoding Lon or Lon-shRNA for 24 hours (n=3). CytB, cytochrome b; ND4, NADH dehydrogenase subunit 4. (D) Mitochondrial Lon promotes the mtDNA leakeage to the cytosol in hepatocellular carcinoma. The ratio of cytoplasmic to total mtDNA was determined by qPCR analysis of HepG2 and Huh7 cells. Mitochondrial Lon protein level was confirmed by immunoblotting (right panel). (E, F) The mtDNA leakage induced by Lon is decreased by mtDNA replication inhibitor and DNAse treatment. The ratio of cytoplasmic to total mtDNA was determined by qPCR analysis of OSCC cells transfected with the plasmids encoding vector or Lon and treated with or without 2′,3′-dideoxycytidine (ddC). (E) The ratio of cytoplasmic to total mtDNA was determined by qPCR analysis of OSCC cells transfected with the plasmids encoding vector, Lon, and/or DNAse2a. (F) One-way analysis of variance followed by Student’s t-test. Data are expressed as mean±SEM. ***p<0.001. (G) IR induces the mtDNA leakeage to the cytosol in OEC-M1. The ratio of cytoplasmic to total mtDNA was determined by qPCR analysis of OEC-M1 cells with or without 5 Gy IR exposure (n=3).
Figure 3
Figure 3
Mitochondrial Lon–mtDNA axis activates the STING-TBK1–dependent interferon (IFN) pathway in response to oxidative stress. (A) OEC-M1 cells were treated with 5 Gy IR exposure. The mRNA expressions of IFNγ and IRF3 were measured by quantitative real-time PCR. (B) OEC-M1 cells transfected with pcDNA3 plasmids encoding Lon were treated with or without NAC (5 mM, 24 hours). The mRNA expression of IFNα was measured by quantitative real-time PCR. (C, D) OEC-M1 cells were transfected with the plasmids encoding Lon or Lon-shRNA and the mRNA expressions of IFNα, IFNγ, and IRF7 were mesured by quantitative real-time PCR. (E) OEC-M1 cells were transfected with the plasmids encoding Lon or Lon-shRNA and OEC-M1-Lon cells were treated with or without NAC (5 mM) for 24 hours. The whole cell lysates were analyzed by immunoblotting using the indicated antibodies. GAPDH is used as the loading control. The number represents the band intensity normalized against GAPDH. (F) OEC-M1 cells were transfected with the plasmids encoding Lon or not and treated with or without ddC (20 µM) for 24 hours. The whole cell lysates were analyzed by immunoblotting using the indicated antibodies. Actin is used as the loading control. The number represents the band intensity normalized against actin. (G) OEC-M1 cells were transfected with the plasmids encoding Lon and/or transfected with the plasmids encoding Flag-Dnase2a. The whole cell lysates were analyzed by immunoblotting using the indicated antibodies. Actin is used as the loading control. The number represents the band intensity normalized against actin. (H) OEC-M1 cells were infected with lentivirus encoding shSTING or an empty vector. After selection with puromycin, the cells were transfected with or without the plasmids encoding myc-Lon. The whole cell lysates were analyzed by immunoblotting using the indicated antibodies. Actin is used as the loading control. (I) HSC3 cells were infected with lentivirus encoding shSTING or an empty vector. After selection with puromycin, the cells were transfected with or without the plasmids encoding myc-Lon. The mRNA expressions of IFNβ were measured by quantitative real-time PCR. (J) TW 2.6 cells were infected with lentivirus encoding shSTING or shTBK1 or an empty vector. After selection with puromycin, the cells were transfected with or without the plasmids encoding myc-Lon. The mRNA expressions of IFNα were mesured by quantitative real-time PCR. The efficiency of knocking down TBK1 was confirmed by immunoblotting. (K) OEC-M1 cells were transfected with the plasmids encoding Lon or control vector. Whole cell lysates were analyzed by immunoblotting using the indicated antibodies. Actin is used as the loading control. The number represents the band intensity normalized against actin. (L) OEC-M1 cells were transfected with the plasmids encoding Lon or Lon-shRNA. Whole cell lysates were analyzed by immunoblotting using the indicated antibodies. Actin is used as the loading control. The number represents the band intensity normalized against actin. (M) OEC-M1 cells transfected with pcDNA3 plasmids encoding Lon or control vector were treated with or without NAC (5 mM, 24 hours). Cell lysates were analyzed by immunoblotting using the indicated antibodies. Actin is used as the loading control. (N) OEC-M1 cells were infected with lentivirus encoding Flag-Dnase2a or an empty vector. After selection with puromycin, the cells were transfected with or without the plasmids encoding myc-Lon. Cell lysates were analyzed by immunoblotting using the indicated antibodies. Actin is used as the loading control.
Figure 4
Figure 4
Mitochondrial Lon induces the secretion of extracellular vesicles (EVs) that carry mtDNA and PD-L1 from cancer cells. (A) Mitochondrial Lon induces EV production. DOK cells were transfected with the plasmids encoding Lon or control vector. Purified EVs were analyzed by immunoblotting using the indicated antibodies. (B) The identification of OSCC EVs was performed by transmission electron microscopy. Scale bar, 100 nm. The size distribution of oral squamous cell carcinoma EVs was performed via dynamic light scattering (right panel). (C) TW2.6 cells were transfected with the plasmids encoding Lon or control vector. EVs from the cells were purified and the relative amount of exosomal mtDNA (D-LOOP) was determined by qPCR analysis. (D) HepG2 and Huh7 cells were used to prepare EVs and the relative amount of exosomal mtDNA (D-LOOP) was determined by qPCR analysis. (E) SW480 and SW620 cells were used to prepare EVs and the relative amount of exosomal mtDNA (D-LOOP) was determined by qPCR analysis. The expression of Lon was confirmed by immunoblotting. (F) HSC3 cells were transfected with the plasmids encoding Flag-Dnase2a or control vector. After selection with hygromycin, the cells were transfected with the plasmids encoding myc-Lon. The cells were used to prepare EVs and the relative amount of exosomal mtDNA (D-LOOP) was determined by qPCR analysis. (G) HSC3 cells were infected with lentivirus encoding shRab27a or an empty vector. After selection with puromycin, the cells were used to prepare EVs and the relative amount of exosomal mtDNA (D-LOOP) was determined by qPCR analysis. The efficiency of knocking down Rab27a was confirmed by immunoblotting. The purified EVs were confirmed by immunoblotting using the indicated antibodies. Actin is used as the loading control (right panel). (H) IFNγ secretion in the culture medium from HSC3, HSC3-Lon, and HSC3-Lon/shRab27a cells was deteced by ELISA. (I) HSC3 cells were transfected with the plasmids encoding Flag-Dnase2a or control vector. After selection with hygromycin, the cells were transfected with or without the plasmids encoding myc-Lon. The purified EVs were prepared and detected by immunoblotting using the indicated antibodies. TSG101 is used as an EV loading control. (J) PD-L1 amount in the purified EVs from HepG2 and Huh7 cells was deteced by ELISA.
Figure 5
Figure 5
Mitochondrial Lon-induced extracellular vehicles (EVs) containing mtDNA and PD-L1 affect the behavior of macrophage and cytotoxic T cells. (A) Mitochondrial Lon-induced EVs activate the TLR9 receptor. HEK293 cells were co-transfected with a TLR9 expression vector and NF-κB controlled luciferase reporter gene overnight and then treated with the purified EVs for 7 hours with CpG 2007 (2.5 µg/mL) as a positive control. Relative luciferase activities were determined. Data are shown as mean±SD of three independent experiments. ***p<0.001. (A) Lon-induced EVs from cancer promote IL-6 expression in macrophage. THP-1 monocytes first were differentiated into macrophages using PMA (Phorbol 12-myristate 13-acetate, 100 ng/mL for 6 hours). The macrophages then were treated with the purified EVs from oral squamous cell carcinoma (OSCC) cells transfected with or without Lon plasmid for 48 hours. IL-6 mRNA expression of macrophage was detected by qPCR. (B) THP-1 monocytes first were differentiated into macrophages using PMA (Phorbol 12-myristate 13-acetate, 100 ng/mL for 6 hours). The macrophages were treated with purified EVs from transfected cells with or without Lon plasmid OSCC cells for 48 hours. IFNβ mRNA expression of macrophage was detected by qPCR. (D, E) The macrophages were incubated with the purified EVs from OSCC cells transfected with or without Lon plasmid for 48 hours. IFNβ production of macrophage was measured by ELISA. (F) Bone marrow–derived macrophages from C57BL/6 wild-type or TLR9-knocked-out mice were treated with the purified EVs from HSC3 cells transfected with or without Lon plasmid. IL-6 production of macrophage from mice was measured by ELISA. (G) Purified T cells were prepared from splenocytes of C57BL/6. Then the purified T cells were treated with the purified EVs from B16/F10 melanoma cells transfected with or without Lon plasmid or not (Mock). CD8+ cells were measured by flow cytometry. (H) Purified T cells were prepared from splenocytes of C57BL/6. Then the purified T cells were treated with the purified EVs from B16/F10 melanoma cells transfected with or without Lon plasmid or not (Mock). CD4+/CD25+ cells were measured by flow cytometry.
Figure 6
Figure 6
Mitochondrial Lon-induced extracellular vehicles (EVs) containing mtDNA and PD-L1 promote tumor progression in the mouse model and patients with oral squamous cell carcinoma. (A) Mitochondrial Lon induces IFN-γ and PD-L1 expression in B16/F10 melanoma. B16/F10 melanoma cells were transfected with the plasmids encoding vector, Lon, or Lon-shRNA. The transfected B16/F10 melanoma cells were injected subcutaneously into C57BL/6 mice. The msIFN-γ and msPD-L1 level in B16/F10 melanoma was determined by ELISA. (B, C) Lon overexpression promotes PD-L1–dependent tumorigenicity in vivo. B16/F10 melanoma cells were transfected with the plasmids encoding vector or Lon. The transfected B16/F10 melanoma cells were injected subcutaneously into mice. B16/F10 cells transfected with the plasmids encoding Lon were treated with IgG or anti-PD-L1 antibody (0.4 mg/kg per mouse) intraperitoneal injection (i.p.), 12 days post-inoculation and once every 3 days for three injections. The tumor volumes were measured every 3 days. Data represented are the mean of n=6 C57BL/6 mice (B). **p<0.01, *p<0.05. The tumor tissues were collected from three mice that were injected subcutaneously by the B16/F10 cells transfected with the plasmids encoding Lon or vector and treated with IgG or anti-PD-L1 antibody as indicated. Representative immunohistochemical analysis of Lon was performed by using paraffin-embedded sections of mice tissues (right panel). Scale bar, 100 µm. Whole cell lysates were analyzed by immunoblotting using the indicated antibodies. Actin is used as the loading control (C). (D) PD-L1 inhibition rescues mitochondrial Lon-reduced CD3+/CD8+ T-cell infiltration. The CD3 and CD8 immunofluorescence staining was performed in the resected tumors of C57BL/6 mice at day 17. Representative H&E staining of tumor sections from the B16/F10-Lon mouse treated with IgG or anti-PD-L1 antibody. (E) IFN-γ and PD-L1 are upregulated in plasma of patients with oral cancer. PD-L1 and IFN-γ levels were measured by ELISA in the plasma of patients with oral cancer. (F) mtDNA amount and PD-L1 are upregulated in EVs from plasma of patients with oral cancer. Relative mtDNA amount was detected by qPCR and exosomal PD-L1 level was measured by ELISA in the purified EVs from plasma of patients with oral cancer. (G) Scheme of mitochondrial Lon-induced mtDNA and PD-L1 that inhibit CD8+ T-cell activity in the tumor microenvironment by STING-TBK-IFN signaling and by direct secretion of EVs to attenuate anti-cancer macrophage.

References

    1. Mehta MM, Weinberg SE, Chandel NS. Mitochondrial control of immunity: beyond ATP. Nat Rev Immunol 2017;17:608–20. 10.1038/nri.2017.66 - DOI - PubMed
    1. Murphy MP. How mitochondria produce reactive oxygen species. Biochem J 2009;417:1–13. 10.1042/BJ20081386 - DOI - PMC - PubMed
    1. Stowe DF, Camara AKS. Mitochondrial reactive oxygen species production in excitable cells: modulators of mitochondrial and cell function. Antioxid Redox Signal 2009;11:1373–414. 10.1089/ars.2008.2331 - DOI - PMC - PubMed
    1. Karin M. NF-kappaB as a critical link between inflammation and cancer. Cold Spring Harb Perspect Biol 2009;1:a000141. 10.1101/cshperspect.a000141 - DOI - PMC - PubMed
    1. Kuo C-L, Chou H-Y, Chiu Y-C, et al. . Mitochondrial oxidative stress by Lon-PYCR1 maintains an immunosuppressive tumor microenvironment that promotes cancer progression and metastasis. Cancer Lett 2020;474:138–50. 10.1016/j.canlet.2020.01.019 - DOI - PubMed

Publication types

MeSH terms