. 2020 Dec 2;6(49):eaba3148.
doi: 10.1126/sciadv.aba3148. Print 2020 Dec.

Rapid evolution of coordinated and collective movement in response to artificial selection

Affiliations

Rapid evolution of coordinated and collective movement in response to artificial selection

Alexander Kotrschal et al. Sci Adv. .

Abstract

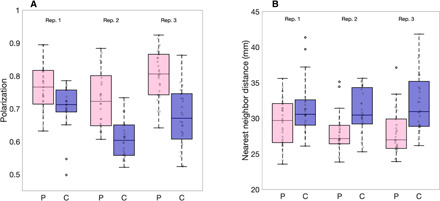
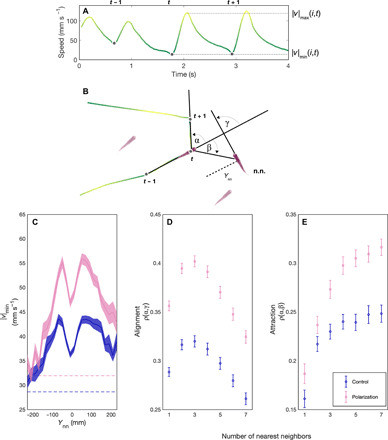
Collective motion occurs when individuals use social interaction rules to respond to the movements and positions of their neighbors. How readily these social decisions are shaped by selection remains unknown. Through artificial selection on fish (guppies, Poecilia reticulata) for increased group polarization, we demonstrate rapid evolution in how individuals use social interaction rules. Within only three generations, groups of polarization-selected females showed a 15% increase in polarization, coupled with increased cohesiveness, compared to fish from control lines. Although lines did not differ in their physical swimming ability or exploratory behavior, polarization-selected fish adopted faster speeds, particularly in social contexts, and showed stronger alignment and attraction responses to multiple neighbors. Our results reveal the social interaction rules that change when collective behavior evolves.


Figures

Fig. 1
Fig. 1. Schematic of one of three independent replicates of the selection experiment.
Each layer represents a generation of females. Arrows within a layer illustrate the sorting procedure where we identified fish that formed the most polarized groups. To do this, groups were first assayed for their group polarization. Here, variables g1 to g16 denote the 16 groups’ polarization scores in round t. These scores were subsequently ranked (blue arrows) with g(1) to g(16), denoting the ranked scores from lowest to highest. Following this, half of the group members were mixed with adjacently ranked groups (red arrows). This ranking and sorting procedure was repeated 12 times (circular gray arrow) before 26 fish from the top four ranked groups were bred for the polarization lines, and 26 fish from remaining 16 groups were bred for the control lines. This sorting procedure was repeated three times for the polarization lines (indicated by the layers), whereas fish from the control group experienced the same assaying and sorting, except that fish from these control lines were not ranked.
Fig. 2
Fig. 2. Polarization and nearest neighbor distance in groups of guppies artificially selected for polarization.
Boxplots of (A) median polarization and (B) median nearest neighbor distance for groups of eight females in polarization selected (pink boxed) or control lines (blue boxes). Replicate lines 1, 2, and 3 are denoted above the boxes. Gray markers show individual data points (i.e., trials). Horizontal lines indicate medians, boxes indicate the interquartile range, and whiskers indicate all points within 1.5 times the interquartile range. N(Replicate 1,2,3) = 60, 56, and 57.
Fig. 3
Fig. 3. Burst and glide analysis and inferring social interactions of guppies artificially selected for polarization.
(A) Time series containing three consecutive speed minima (dots) followed by bursting events. (B) The corresponding trajectory for fish i (in the center). The positions at the preceding and following speed minima are used to calculate the turning angle α of fish i at time t. In this example, the turn has the same sign as the nearest neighbor orientation (i.e., alignment) γ and the opposite sign to the attraction angle β. (C to E) The social interactions of females in the control lines (blue) and polarization selection lines (pink) in response to nearest neighbors. (C) The mean speed minimum when the nearest neighbor (n.n.) is in front (+) or behind (−) by a distance Ynn. The error region shows the SEM over trials. Dashed lines show the overall mean speed minimum for control and polarization lines in individual open-arena trials. (D) Alignment and (E) attraction responses to the geometric center of k nearest neighbors, where k ranges from 1 (nearest neighbor) to 7 (all conspecifics). The Spearman correlations ρ were computed for each k and for each trial for all β and γ with absolute values of less than 90°. The set of β was additionally restricted to time points where the k neighbors were all less than 200 mm from the focal fish (see the Supplementary Materials). Means (symbols) and SE (bars) were calculated for each selection line from these correlation coefficients.

References

    1. Couzin I. D., Krause J., Franks N. R., Levin S. A., Effective leadership and decision-making in animal groups on the move. Nature 433, 513–516 (2005). - PubMed
    1. Breder C. M., Jr., Equations descriptive of fish schools and other animal aggregations. Ecology 35, 361–370 (1954).
    1. Lopez U., Gautrais J., Couzin I. D., Theraulaz G., From behavioural analyses to models of collective motion in fish schools. Interface Focus 2, 693–707 (2012). - PMC - PubMed
    1. Calovi D. S., Lopez U., Ngo S., Sire C., Chaté H., Theraulaz G., Swarming, schooling, milling: Phase diagram of a data-driven fish school model. New J. Phys. 16, 015026 (2014).
    1. Gautrais J., Ginelli F., Fournier R., Blanco S., Soria M., Chaté H., Theraulaz G., Deciphering interactions in moving animal groups. PLoS Comput. Biol. 8, e1002678 (2012). - PMC - PubMed

Publication types

LinkOut - more resources