. 2020 Dec 2;6(49):eaba8555.
doi: 10.1126/sciadv.aba8555. Print 2020 Dec.

Landscapes of bacterial and metabolic signatures and their interaction in major depressive disorders

Affiliations

Landscapes of bacterial and metabolic signatures and their interaction in major depressive disorders

Jian Yang et al. Sci Adv. .

Abstract

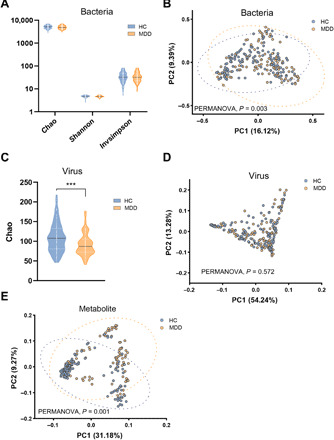
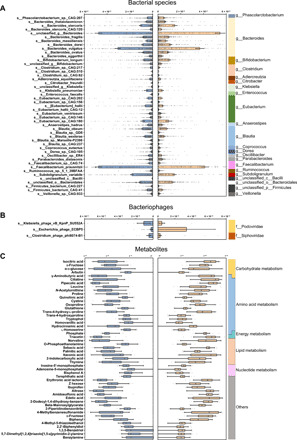
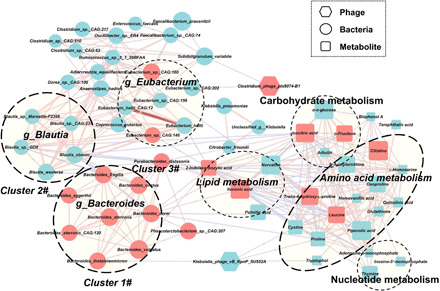
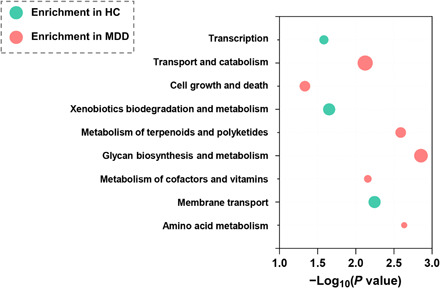
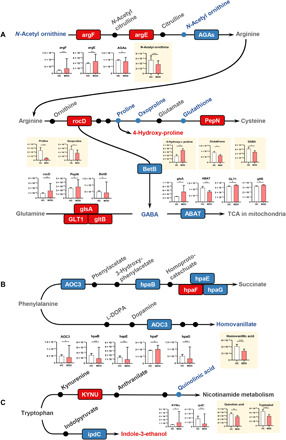
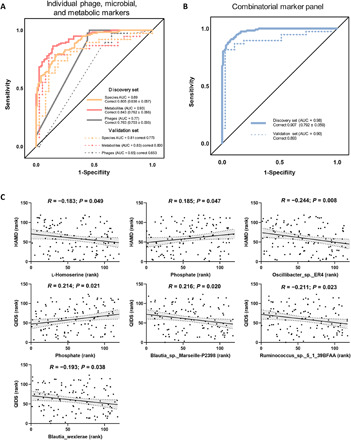
Gut microbiome disturbances have been implicated in major depressive disorder (MDD). However, little is known about how the gut virome, microbiome, and fecal metabolome change, and how they interact in MDD. Here, using whole-genome shotgun metagenomic and untargeted metabolomic methods, we identified 3 bacteriophages, 47 bacterial species, and 50 fecal metabolites showing notable differences in abundance between MDD patients and healthy controls (HCs). Patients with MDD were mainly characterized by increased abundance of the genus Bacteroides and decreased abundance of the genera Blautia and Eubacterium These multilevel omics alterations generated a characteristic MDD coexpression network. Disturbed microbial genes and fecal metabolites were consistently mapped to amino acid (γ-aminobutyrate, phenylalanine, and tryptophan) metabolism. Furthermore, we identified a combinatorial marker panel that robustly discriminated MDD from HC individuals in both the discovery and validation sets. Our findings provide a deep insight into understanding of the roles of disturbed gut ecosystem in MDD.


Figures

Fig. 1
Fig. 1. Gut microbiome characteristics in MDD versus HC.
(A) There were no significance bacterial αaciversity differences between the two groups. (B) Bacterial signatures between the two groups were significantly different (Bray-Curtis distance, PERMANOVA, P = 0.003). (C) α-Phylogenetic diversity analysis of gut viromes showed that the index of Chao (community richness) was decreased in the MDD subjects relative to HCs. (D) Overall viral signatures of the MDD group were not significantly discriminated from the HC group (Bray-Curtis distance, PERMANOVA, P = 0.572). (E) Metabolic signatures of MDD subjects were significantly distinguished from HCs (Bray-Curtis distance, PERMANOVA, P = 0.001). Discovery set: HC, n = 118; MDD, n = 118. ***P < 0.001.
Fig. 2
Fig. 2. The bacteriophages, bacterial species, and fecal metabolites that discriminate MDD from HC.
(A) Relative abundances of 47 bacterial species responsible for discriminating the MDD and HC groups. The taxonomic assignment of each species is shown on the left. At the genus level, the MDD subjects showed 18 enriched species, mainly belonging to the genus Bacteroides (10 species), and 29 depleted species mainly belonging to the genera Blautia (5 species), Eubacterium (5 species), and Clostridium (3 species). (B) Three bacteriophages, mainly assigned to Podoviridae at the family level, were differentially expressed in the MDD subjects relative to HCs. (C) Relative abundances of 50 fecal metabolites differentiating between the two groups. Compared with HC, the MDD group was characterized by 16 up-regulated metabolites and 34 down-regulated metabolites. These metabolites were mainly involved in amino acid, nucleotide, carbohydrate, and lipid metabolism. The discriminative variants (gut bacteriophages, bacterial species, and fecal metabolites) were identified on the basis of an LDA score >2.5. Discovery set: HC, n = 118; MDD, n = 118.
Fig. 3
Fig. 3. A co-occurrence network constructed from the relative abundances of differential bacteriophages, bacterial species, and fecal metabolites in MDD subjects versus HCs.
The differential bacterial species mainly generated three covarying units (clusters 1 to 3). Cluster 1 was composed of eight enriched species belonging to the genus Bacteroides (Bacteroides_stercoris_CAG:120, Bacteroides_stercoris, Bacteroides_dorei, Bacteroides_vulgatus, Bacteroides_fragilis, Bacteroides_thetaiotaomicron, Bacteroides_eggerthii, and Bacteroides_ovatus) in MDD subjects compared with HCs. Cluster 2 comprised five depleted species belonging to the genus Blautia (Blautia_obeum, Blautia_sp._GD8, Blautia_wexlerae, Blautia_sp._Marseille-P2398, and Blautia_sp._CAG:237). Within cluster 1 or 2, each bacterial species positively correlated with each other. In contrast, some members from cluster 1 (Bacteroides_fragilis) showed negative correlations with the members from the cluster 2 (Blautia_obeum and Blautia_sp._GD8). For bacteriophages, Klebsiella_phage_vB_KpnP_SU552A was positively correlated with one species of genus Bacteroides in cluster 1. Another bacteriophage, Clostridium_phage_phi8074-B1, showed positive correlations with two bacterial species (Subdoligranulum_variabile and Eubacterium_sp._CAG:202). Klebsiella_phage_vB_KpnP_SU552A was also negatively correlated with three metabolites (proline, cysteine, and tryptophol) belonging to amino acid metabolism. In this network, these altered metabolites were mainly involved in amino acid metabolism. Size of the nodes represents the abundance of these variables. Red and blue dots indicate the increased and decreased relative abundances of variables in MDD subjects relative to HCs, respectively. Bacterial species annotated to the genus level are marked. Edges between nodes indicate Spearman’s negative (light blue) or positive (light red) correlation; edge thickness indicates range of P value (P < 0.05).
Fig. 4
Fig. 4. Biological processes enriched by differential microbial genes in MDD subjects (red) or HCs (green).
Abscissa variations indicate levels of significance; size of the nodes indicates the fold change.
Fig. 5
Fig. 5. Key amino acid metabolic pathways mapped by microbial genes and fecal metabolism in gut ecosystem of MDD.
(A) Fecal levels of GABA and its relevant metabolites (N-acetylornithine, proline, oxoproline, and glutathione) were decreased in the MDD relative to the HC group. In addition, a microbial enzyme–related gene (BetB) that participated in arginine metabolism to GABA was down-regulated in MDD. Meanwhile, three microbial genes (glsA, gltB, and GLT1) involved in the metabolism of glutamine to GABA was up-regulated in MDD. (B) Microbial genes (AOC3, hpaB, hpaE, and hpaG) and metabolite (homovanillate) involved in the phenylalanine catabolic pathways were decreased in MDD relative to HCs, suggesting an inhibition of fecal phenylalanine degradation in MDD. (C) The gene (KYNU) involved in the metabolism of kynurenate to quinolinate was up-regulated in patients with MDD. Meanwhile, fecal quinolinate levels were down-regulated in MDD subjects relative to HCs. KEGG genes (squares) and metabolites are colored. Red indicates enriched microbial genes or fecal metabolites in the MDD group, and blue indicates enriched in the HC group. Fecal metabolites are colored gray, while no information was available. The pathways were generated on the basis of KEGG pathway maps. Bar plots show the relative abundances of differential microbial genes and fecal metabolites between two groups (*P < 0.05 and **P < 0.01; Wilcoxon rank-sum test).
Fig. 6
Fig. 6. Multiple markers for diagnosis and disease severity of MDD.
(A) Random forest analysis was used to quantify the diagnostic performance. In the discovery set, individual simplified signature could discriminate the two groups with area under the curve (AUC) ranging from 0.77 to 0.93 (bacteriophages: Clostridium_phage_phi8074-B1 and Escherichia_phage_ECBP5, AUC = 0.77; bacterial species: unclassified Klebsiella and Eubacterium_sp._CAG:146, AUC = 0.89; and fecal metabolites: sebacic acid and 2-indolecarboxylic acid, AUC = 0.93). Using samples from the validation set, the bacterial species and fecal metabolite markers could still effectively discriminate the two groups with AUC of 0.81 and 0.83, respectively. Using the bacteriophage markers alone, a relatively poor diagnostic performance was achieved (AUC = 0.65). (B) This combinatorial marker panel including these six markers yielded more robust diagnostic performance over that of separate bacteriophage or microbial or metabolic markers in both the discovery (AUC = 0.98; sensitivity, 95%, specificity, 87%; positive predictive value, 0.87; and negative predictive value, 0.95) and validation sets (AUC = 0.90; sensitivity, 97%, specificity, 87%; positive predictive value, 0.84; and negative predictive value, 0.97). (C) After adjusting for age and BMI by Spearman’s correlation analysis, 4 of the 47 species and 2 of the 50 metabolites were correlated with clinical scales reflecting disease severity of MDD using Spearman’s rank correlation analysis. HAMD, Hamilton Depression Rating Scale; QIDS, Quick Inventory of Depressive Symptomatology.

References

    1. Kessler R. C., Berglund P., Demler O., Jin R., Koretz D., Merikangas K. R., Rush A. J., Walters E. E., Wang P. S., The epidemiology of major depressive disorder: Results from the National Comorbidity Survey Replication (NCS-R). JAMA 289, 3095–3105 (2003). - PubMed
    1. Mitchell A. J., Chan M., Bhatti H., Halton M., Grassi L., Johansen C., Meader N., Prevalence of depression, anxiety, and adjustment disorder in oncological, haematological, and palliative-care settings: A meta-analysis of 94 interview-based studies. Lancet Oncol. 12, 160–174 (2011). - PubMed
    1. Fava M., Kendler K. S., Major depressive disorder. Neuron 28, 335–341 (2000). - PubMed
    1. Mitchell A. J., Vaze A., Rao S., Clinical diagnosis of depression in primary care: A meta-analysis. Lancet 374, 609–619 (2009). - PubMed
    1. Clemente J. C., Ursell L. K., Parfrey L. W., Knight R., The impact of the gut microbiota on human health: An integrative view. Cell 148, 1258–1270 (2012). - PMC - PubMed

Publication types