. 2021 Apr;80(4):475-486.
doi: 10.1136/annrheumdis-2020-218304. Epub 2020 Dec 2.

Immune response profiling of patients with spondyloarthritis reveals signalling networks mediating TNF-blocker function in vivo

Collaborators, Affiliations

Immune response profiling of patients with spondyloarthritis reveals signalling networks mediating TNF-blocker function in vivo

Silvia Menegatti et al. Ann Rheum Dis. 2021 Apr.

Abstract

Objectives: Antitumour necrosis factor (TNF) therapy has revolutionised treatment of several chronic inflammatory diseases, including spondyloarthritis (SpA). However, TNF inhibitors (TNFi) are not effective in all patients and the biological basis for treatment failure remains unknown. We have analysed induced immune responses to define the mechanism of action of TNF blockers in SpA and to identify immunological correlates of responsiveness to TNFi.

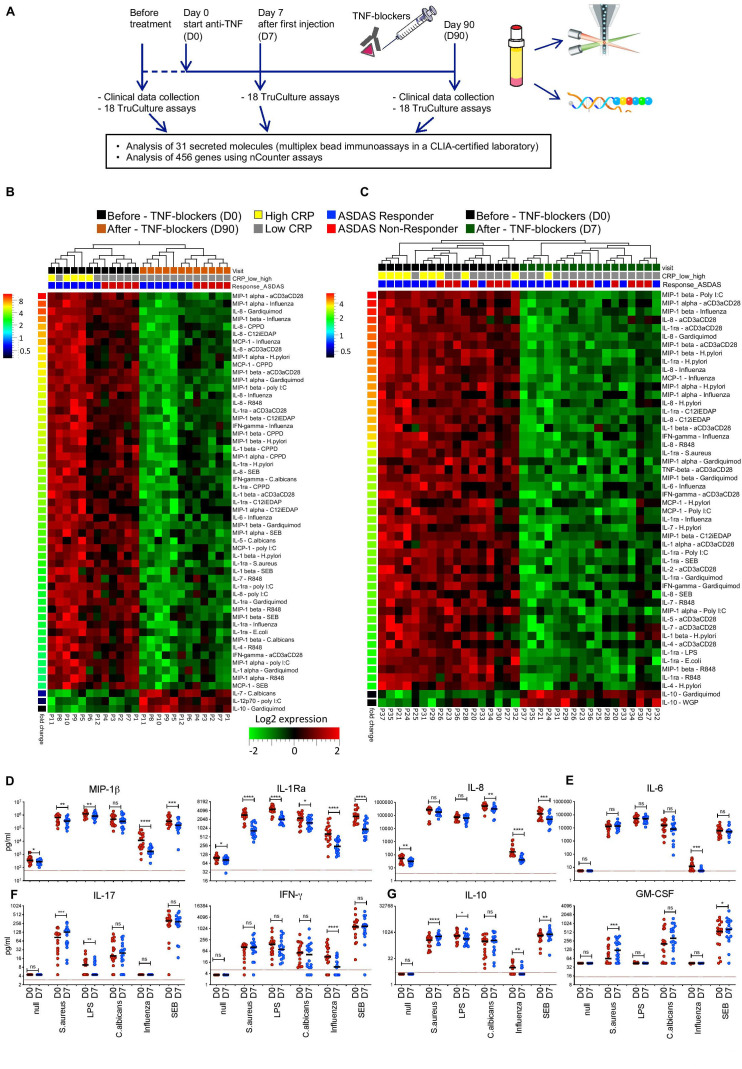
Methods: Immune responses to microbial and pathway-specific stimuli were analysed in peripheral blood samples from 80 patients with axial SpA before and after TNFi treatment, using highly standardised whole-blood stimulation assays. Cytokines and chemokines were measured in a Clinical Laboratory Improvement Amendments (CLIA)-certified laboratory, and gene expression was monitored using nCounter assays.

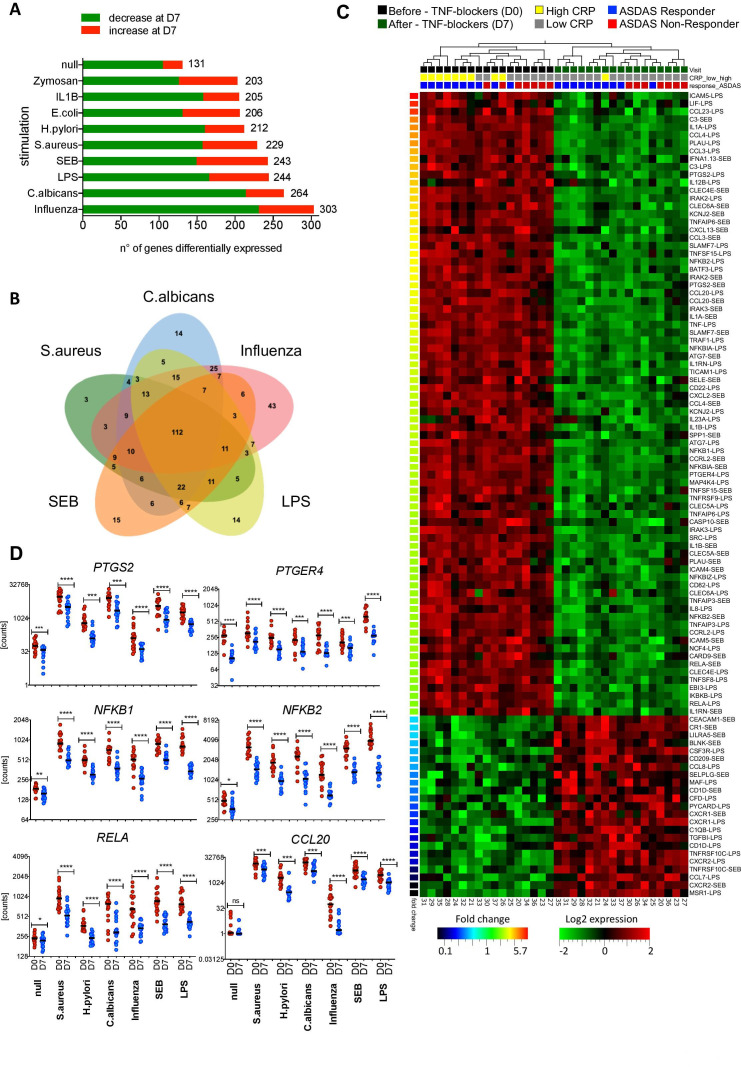
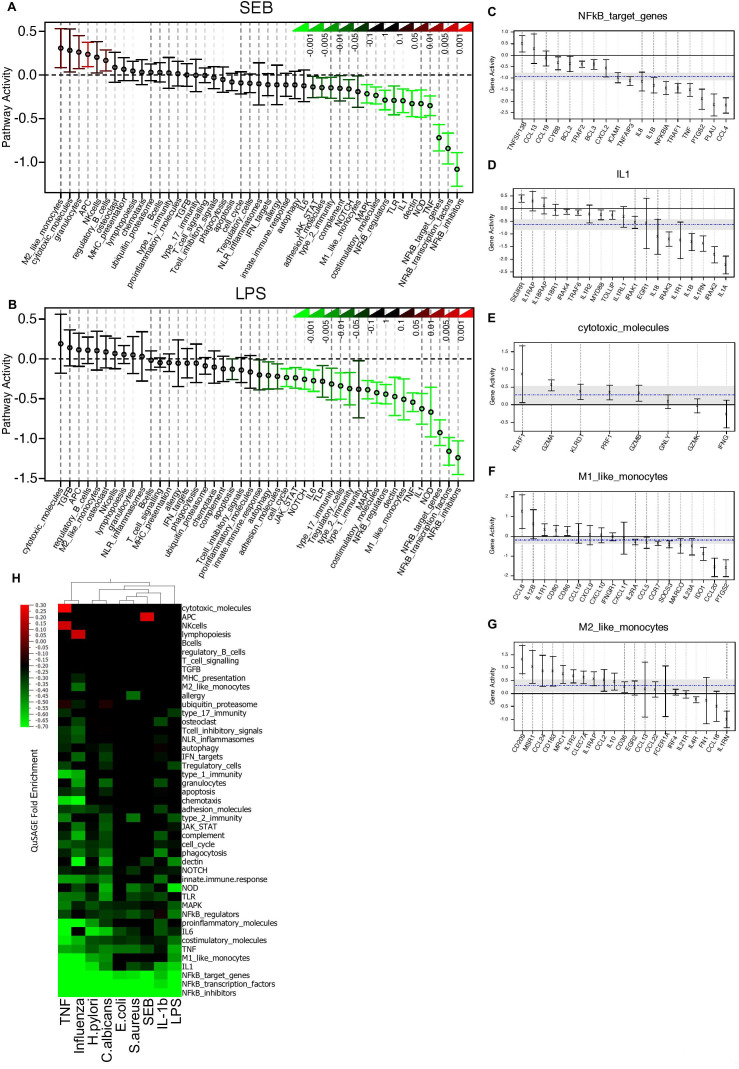
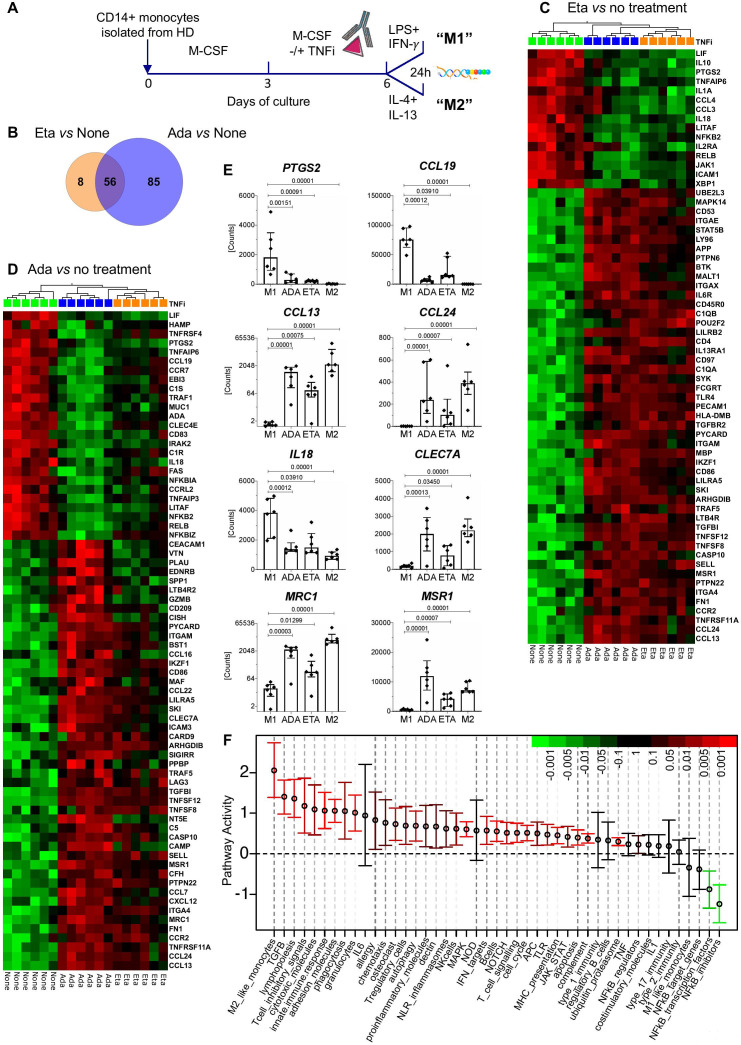
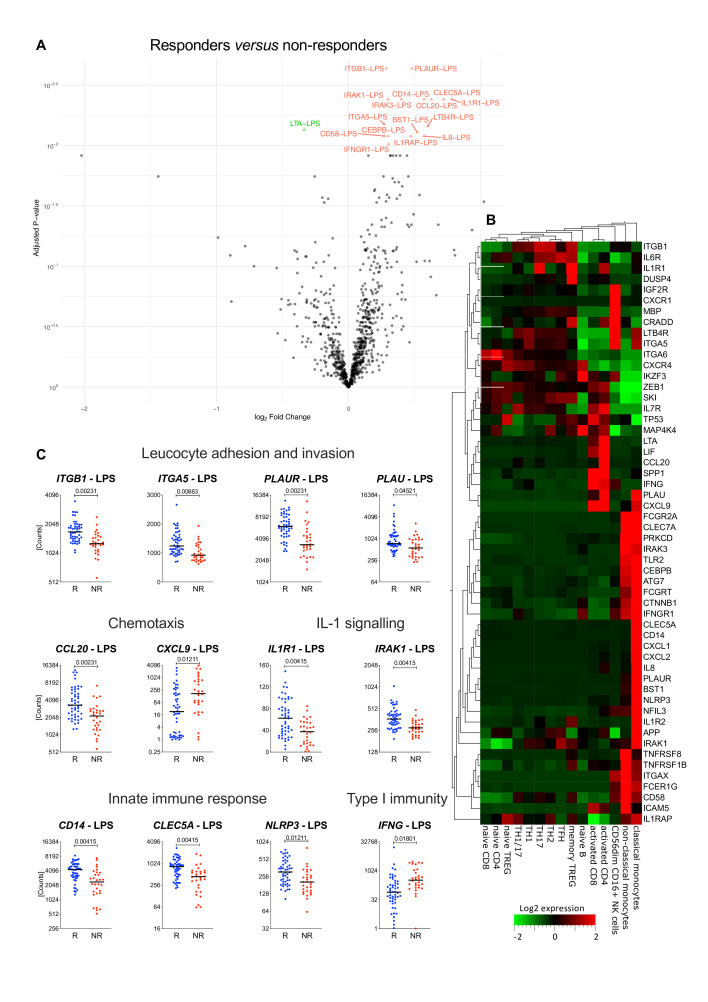
Results: Anti-TNF therapy induced profound changes in patients' innate immune responses. TNFi action was selective, and had only minor effects on Th1/Th17 immunity. Modular transcriptional repertoire analysis identified prostaglandin E2 synthesis and signalling, leucocyte recirculation, macrophage polarisation, dectin and interleukin (IL)-1 signalling, as well as the nuclear factor kappa B (NF-kB) transcription factor family as key pathways targeted by TNF blockers in vivo. Analysis of induced immune responses before treatment initiation revealed that expression of molecules associated with leucocyte adhesion and invasion, chemotaxis and IL-1 signalling are correlated with therapeutic responses to anti-TNF.

Conclusions: We show that TNFi target multiple immune cell pathways that cooperate to resolve inflammation. We propose that immune response profiling provides new insight into the biology of TNF-blocker action in patients and can identify signalling pathways associated with therapeutic responses to biological therapies.

Keywords: ankylosing; biological therapy; immune system diseases; spondylitis; tumor necrosis factor inhibitors.


Conflict of interest statement

Competing interests: None declared.

Figures

Figure 1
Figure 1
An immunological signature of antitumour necrosis factor (TNF) therapy. (A) Study design. Blood samples were collected from patients with axial spondyloarthritis (axSpA) prior to (D0), 7 days (D7, for a subset of patients), and 3 months (D90) after beginning TNF inhibitors (TNFi) treatment. Clinical efficacy was monitored at D90 according to the current standard of care. (B) The levels of 31 secreted molecules in response to 18 different immune stimuli were compared in samples from 12 patients at D0 (black rectangles) and D90 (orange rectangles). Patients with C reactive protein (CRP) levels >6 mg/L are marked with yellow rectangles, while CRP levels <6 mg/L are indicated with grey rectangles. Patients responding to anti-TNF therapy (delta ASDAS ≥1.1) are marked in blue and non-responders (delta ASDAS <1.1) are marked in red. The heatmap shows the levels of differentially secreted proteins (paired t-test, FDR≤0.05, fold-change ≥2, red indicates higher and green lower levels of protein secretion). Analyte-stimulus combinations were ranked by decreasing fold change (color-code bar, top left); patient IDs are indicated below the heatmaps. (C) The same analysis as in (B) was performed for additional 17 patients with axSpA, sampled at D0 (blue rectangles) and D7 (green rectangles). (D–G) Levels of proteins identified in (C), for 5 representative stimuli and the unstimulated (null) condition, in 17 patients with axSpA at D0 (red) and D7 (blue). Red lines indicate the least detectable dose (LDD) for each assay. P values were calculated using a Wilcoxon matched-pairs test (patients with SpA D0 vs D7) *: p<0.05; **: p<0.01; ***: p<0.001; ****: p<0.0001; ns, not significant. Horizontal black bars indicate the median. Y-axes are log10 or log2 scales. ASDAS, Ankylosing Spondylitis Disease Activity Score; IFN, interferon; IL, interleukin.
Figure 2
Figure 2
Tumour necrosis factor (TNF) blockers strongly affect key transcriptional networks of innate immune responses. (A) Number of genes differentially expressed in 10 different TruCulture stimulation assays performed at D0 and D7 (17 patients, paired t-test, false discovery rate (FDR)≤0.05). (B) Venn diagram of the genes differentially expressed as in (A), in five representative stimulation conditions. (C) Heatmap showing the genes most affected by TNF inhibitors (TNFi; D0, black rectangles vs D7, green) in lipopolysaccharides (LPS) and staphylococcal enterotoxin (SEB) stimulation conditions. Patients with C reactive protein (CRP) levels >6 mg/L are marked with yellow rectangles, while CRP levels <6 mg/L are indicated with grey rectangles. Patients responding to anti-TNF therapy (delta Ankylosing Spondylitis Disease Activity Score (ASDAS) ≥1.1) at M3 are marked in blue and non-responders (delta ASDAS <1.1) are marked in red. Paired t-test, FDR≤0.005 and fold-difference threshold of ≥2. Gene-stimulus combinations were ranked by decreasing fold change (colour code bottom left bar). (D) Expression levels of PTGS2, PTGER4, NF-κB family members, and CCL20 for the unstimulated TruCulture assay and five representative stimuli at D0 (red) and D7 (blue) after initiation of TNFi therapy. P values were determined using a Wilcoxon matched-pairs test (D0 vs D7, *: p<0.05; **: p<0.01; ***: p<0.001; ****: p<0.0001; ns, not significant, n=17). Horizontal black bars indicate the median.
Figure 3
Figure 3
Modular transcriptional repertoire analysis reveals multiple mechanisms of tumour necrosis factor (TNF)-blocker action in spondyloarthritis (SpA). (A, B) Effect of anti-TNF therapy on the activity of 45 gene modules (online supplemental table 5) generated from 456 immune-related genes. Whole-blood cultures were stimulated with SEB (A) or LPS (B). For each gene module, the mean activity fold change and 95% CI are plotted and colour coded according to their FDR-corrected p values (means compared with fold-change zero). CIs overlapping the horizontal dotted line indicate statistically significant increased or decreased module activity at D7 as compared with D0. (C–G) Detailed gene activity in five representative modules with decreased (C, D, E, LPS stimulation) or increased (F, G, SEB stimulation) pathway activity after anti-TNF therapy. The cultures were stimulated with LPS and SEB, respectively. Represented are the mean fold change and 95% CI for individual genes in each module. The horizontal dashed blue line and the grey band indicate the mean differential expression of all genes in the module at D7 versus D0, and the 95% CI. (H) QuSAGE fold enrichment of gene set activity in nine different stimulated cultures at D7 versus D0. For each module, the mean fold change is color coded to indicate increased (red) or decreased (green) module activity. Only changes reaching a significance threshold of FDR≤0.01 are represented. IFN, interferon; IL, interleukin.
Figure 4
Figure 4
TNF inhibitors (TNFi) have largely overlapping effects on in vitro differentiated M1-type macrophages. (A) Study design. CD14+ cells isolated from healthy donors were differentiated in vitro into macrophages in the presence or absence of etanercept (Eta) or adalimumab (Ada). TNFi were added at day 3 and macrophages were polarised to the M1 subset in the presence or absence of Eta or Ada. Gene expression was analysed with the nCounter Human Immunology v2 panel and with LIMMA (paired sample adjusted p value threshold 0.01). (B) Venn diagram showing the overlap of genes affected by Eta or Ada. Analysis of paired samples with LIMMA, adjusted p value threshold 0.01. (C, D) Heatmaps showing the genes most affected by Eta (orange rectangles) versus no treatment (green rectangles) (C) and Ada (blue rectangles) versus no treatment (D) in macrophages stimulated for 24 hours with LPS and interferon (IFN)-γ (‘M1’ polarisation). (C) Paired t-test, Eta versus no treatment, adjusted p value threshold 0.01. Included are also gene expression levels for Ada-treated samples for the same genes. (D) Paired t-test, Ada versus no treatment and fold-change threshold of ≥2. Included are also gene expression levels for Eta-treated samples for the same genes. Samples were ordered by hierarchical clustering and genes were ranked by decreasing fold change. (E) Shown are the mRNA levels of eight selected genes from (C) and (D) in untreated M1-polarised macrophages (M1), M1 macrophages treated with Ada, M1 macrophages treated with Eta or untreated M2-polarised macrophages (M2). Symbols represent individual data points, boxes the median and whiskers the IQR. Adjusted p values are those of the LIMMA analysis. (F) Effect of Ada on the activity of 45 gene modules (online supplemental table 5) as in figure 3. For each gene module, the mean activity fold change and 95% CI are plotted and color coded according to their FDR-corrected p values compared with zero. Red and green bars indicate statistically significant increased or decreased module activity, respectively, in M1 polarised macrophages treated with Ada versus no treatment.
Figure 5
Figure 5
Immune gene expression associated with therapeutic responses to antitumour necrosis factor (TNF) therapy. (A) Volcano plot representation of genes differentially expressed between 50 patients with spondyloarthritis (SpA) responding to anti-TNF therapy and 30 non-responders in whole-blood cultures stimulated with LPS or SEB before initiation of therapy; red triangles: genes higher in responders; green triangle: higher in non-responders (LIMMA analysis, adjusted p value<0.05). Expression levels and fold-change values of the 58 gene-stimulus combinations (corresponding to 55 genes) that are the most differentially expressed between responders and non-responders are reported in table 2. (B). The heatmap shows the expression levels of the differentially expressed genes in different immune cell subpopulations. Gene expression data were extracted from the DICE database (http://dice-database.org/). (C) The expression levels of selected gene-stimulus combinations correlated with treatment response are plotted before treatment initiation (D0). Patients with major or clinically important improvement of disease activity were grouped together as responders and are represented in blue (R, blue, n=50). Non-responders are represented in red (NR, red, n=30). The horizontal black line represents the median. Statistical significance was tested using LIMMA analysis (responders vs non-responders) and adjusted p values are indicated above the graph. IL, interleukin.

References

    1. Brown MA, Kenna T, Wordsworth BP. Genetics of ankylosing spondylitis--insights into pathogenesis. Nat Rev Rheumatol 2016;12:81–91. 10.1038/nrrheum.2015.133 - DOI - PubMed
    1. Dougados M, Baeten D. Spondyloarthritis. Lancet 2011;377:2127–37. 10.1016/S0140-6736(11)60071-8 - DOI - PubMed
    1. Sieper J, Braun J, Dougados M, et al. . Axial spondyloarthritis. Nat Rev Dis Primers 2015;1:15013. 10.1038/nrdp.2015.13 - DOI - PubMed
    1. Taurog JD, Chhabra A, Colbert RA. Ankylosing spondylitis and axial spondyloarthritis. N Engl J Med 2016;374:2563–74. 10.1056/NEJMra1406182 - DOI - PubMed
    1. Salmon-Ceron D, Tubach F, Lortholary O, et al. . Drug-specific risk of non-tuberculosis opportunistic infections in patients receiving anti-TNF therapy reported to the 3-year prospective French ratio registry. Ann Rheum Dis 2011;70:616–23. 10.1136/ard.2010.137422 - DOI - PubMed

Publication types

Substances