. 2020 Dec 2;12(572):eaaz2841.
doi: 10.1126/scitranslmed.aaz2841.

Glycine-based treatment ameliorates NAFLD by modulating fatty acid oxidation, glutathione synthesis, and the gut microbiome

Affiliations

Glycine-based treatment ameliorates NAFLD by modulating fatty acid oxidation, glutathione synthesis, and the gut microbiome

Oren Rom et al. Sci Transl Med. .

Abstract

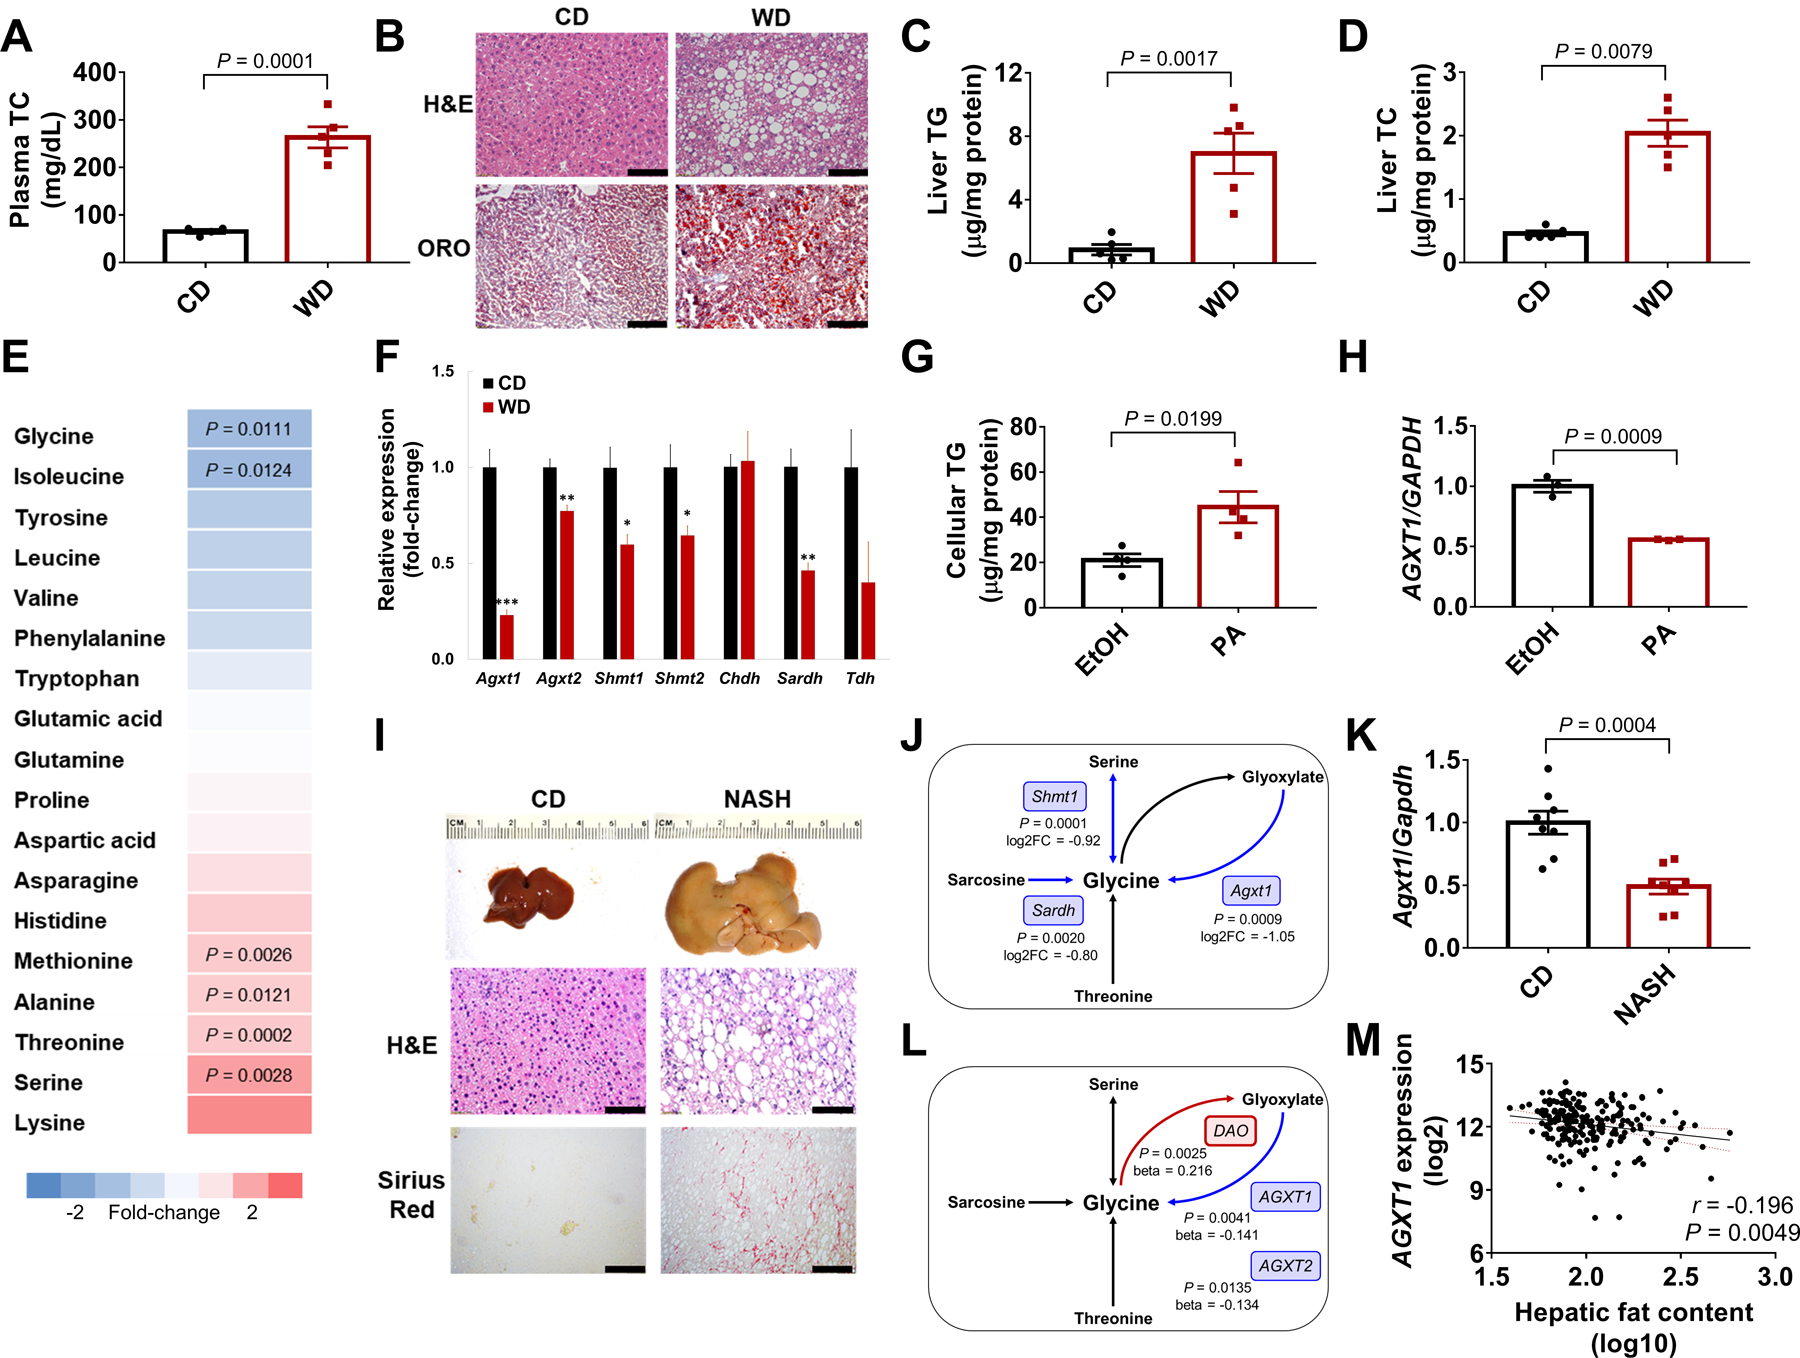
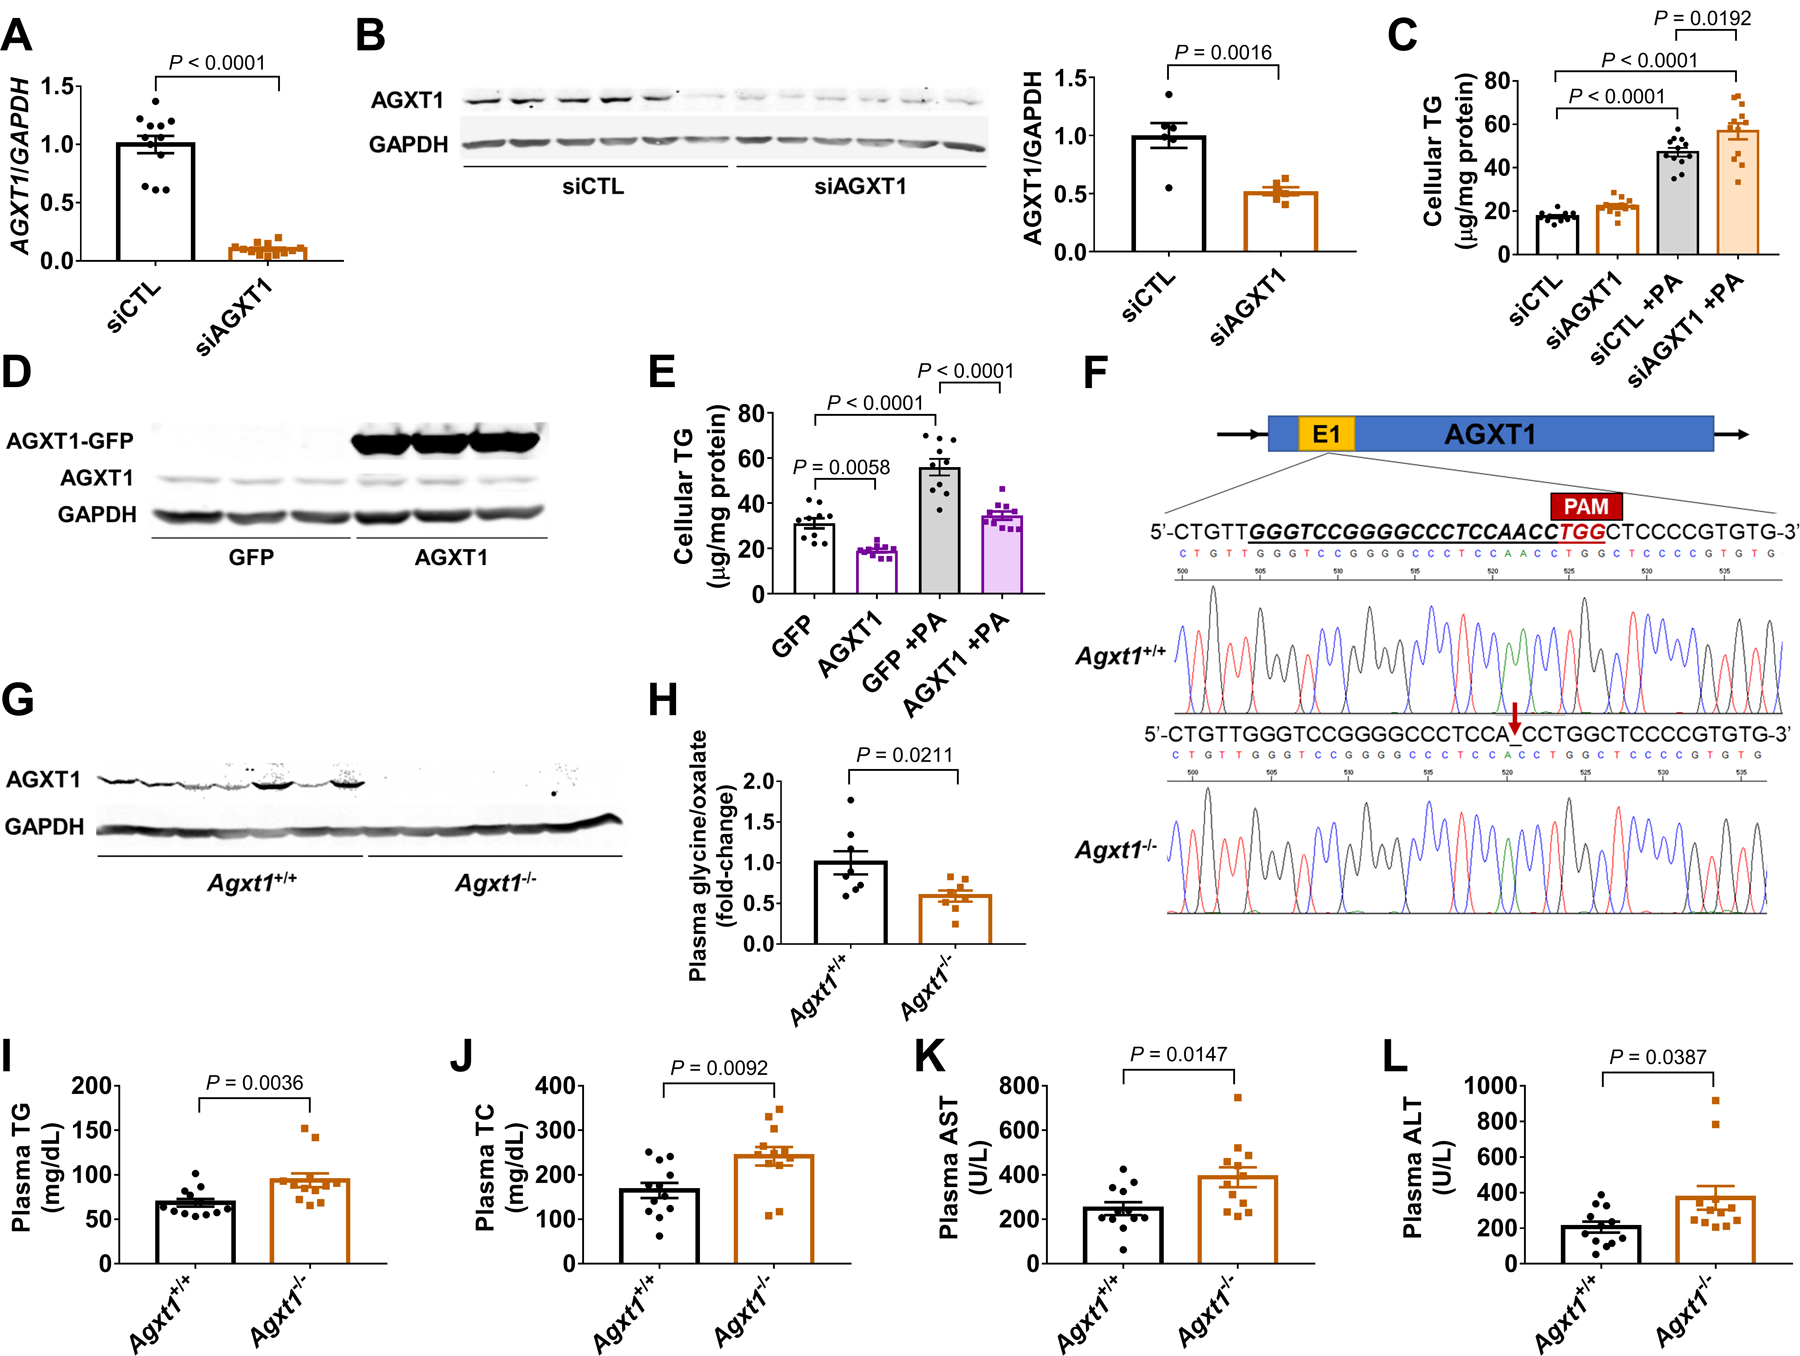
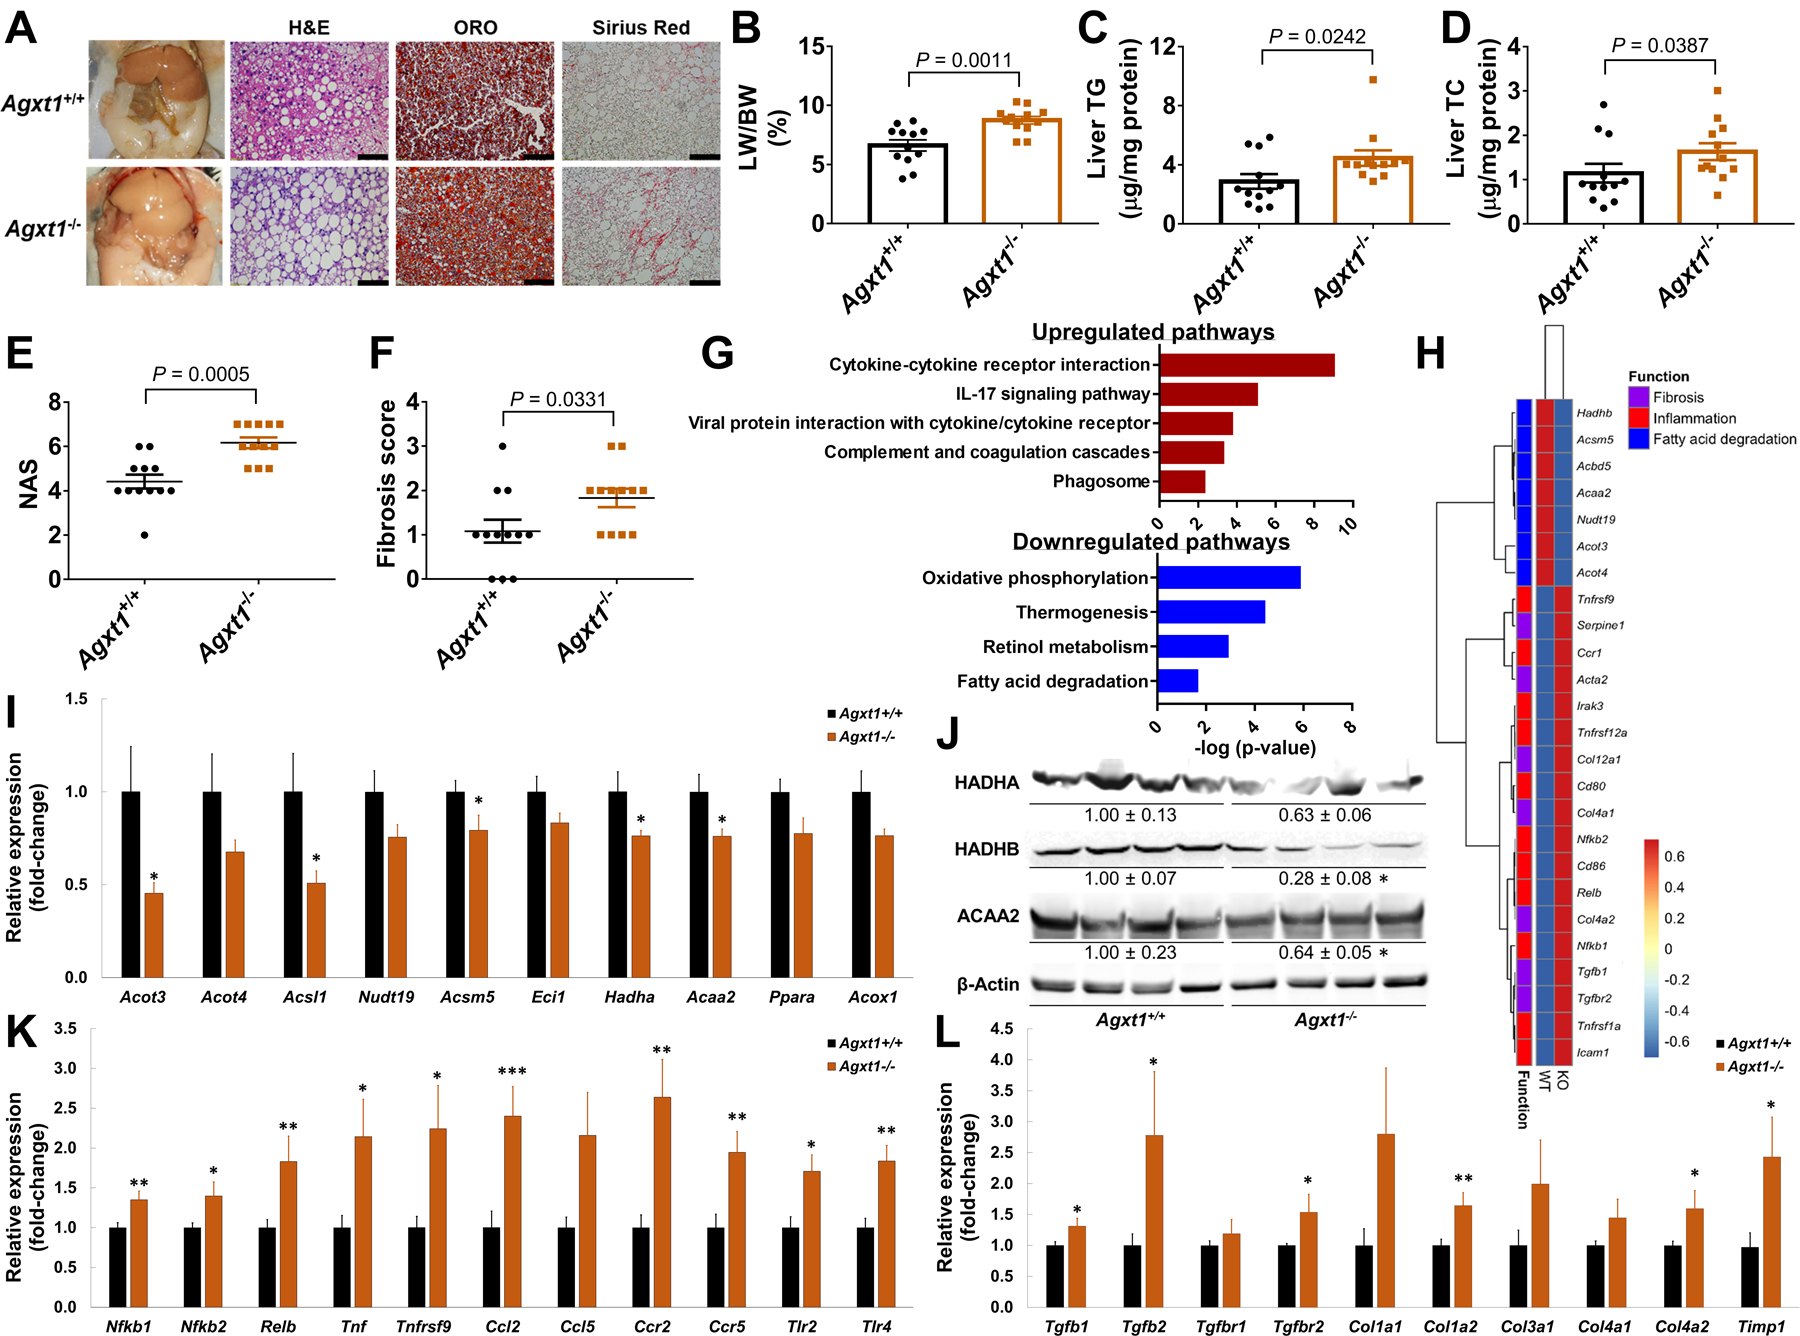
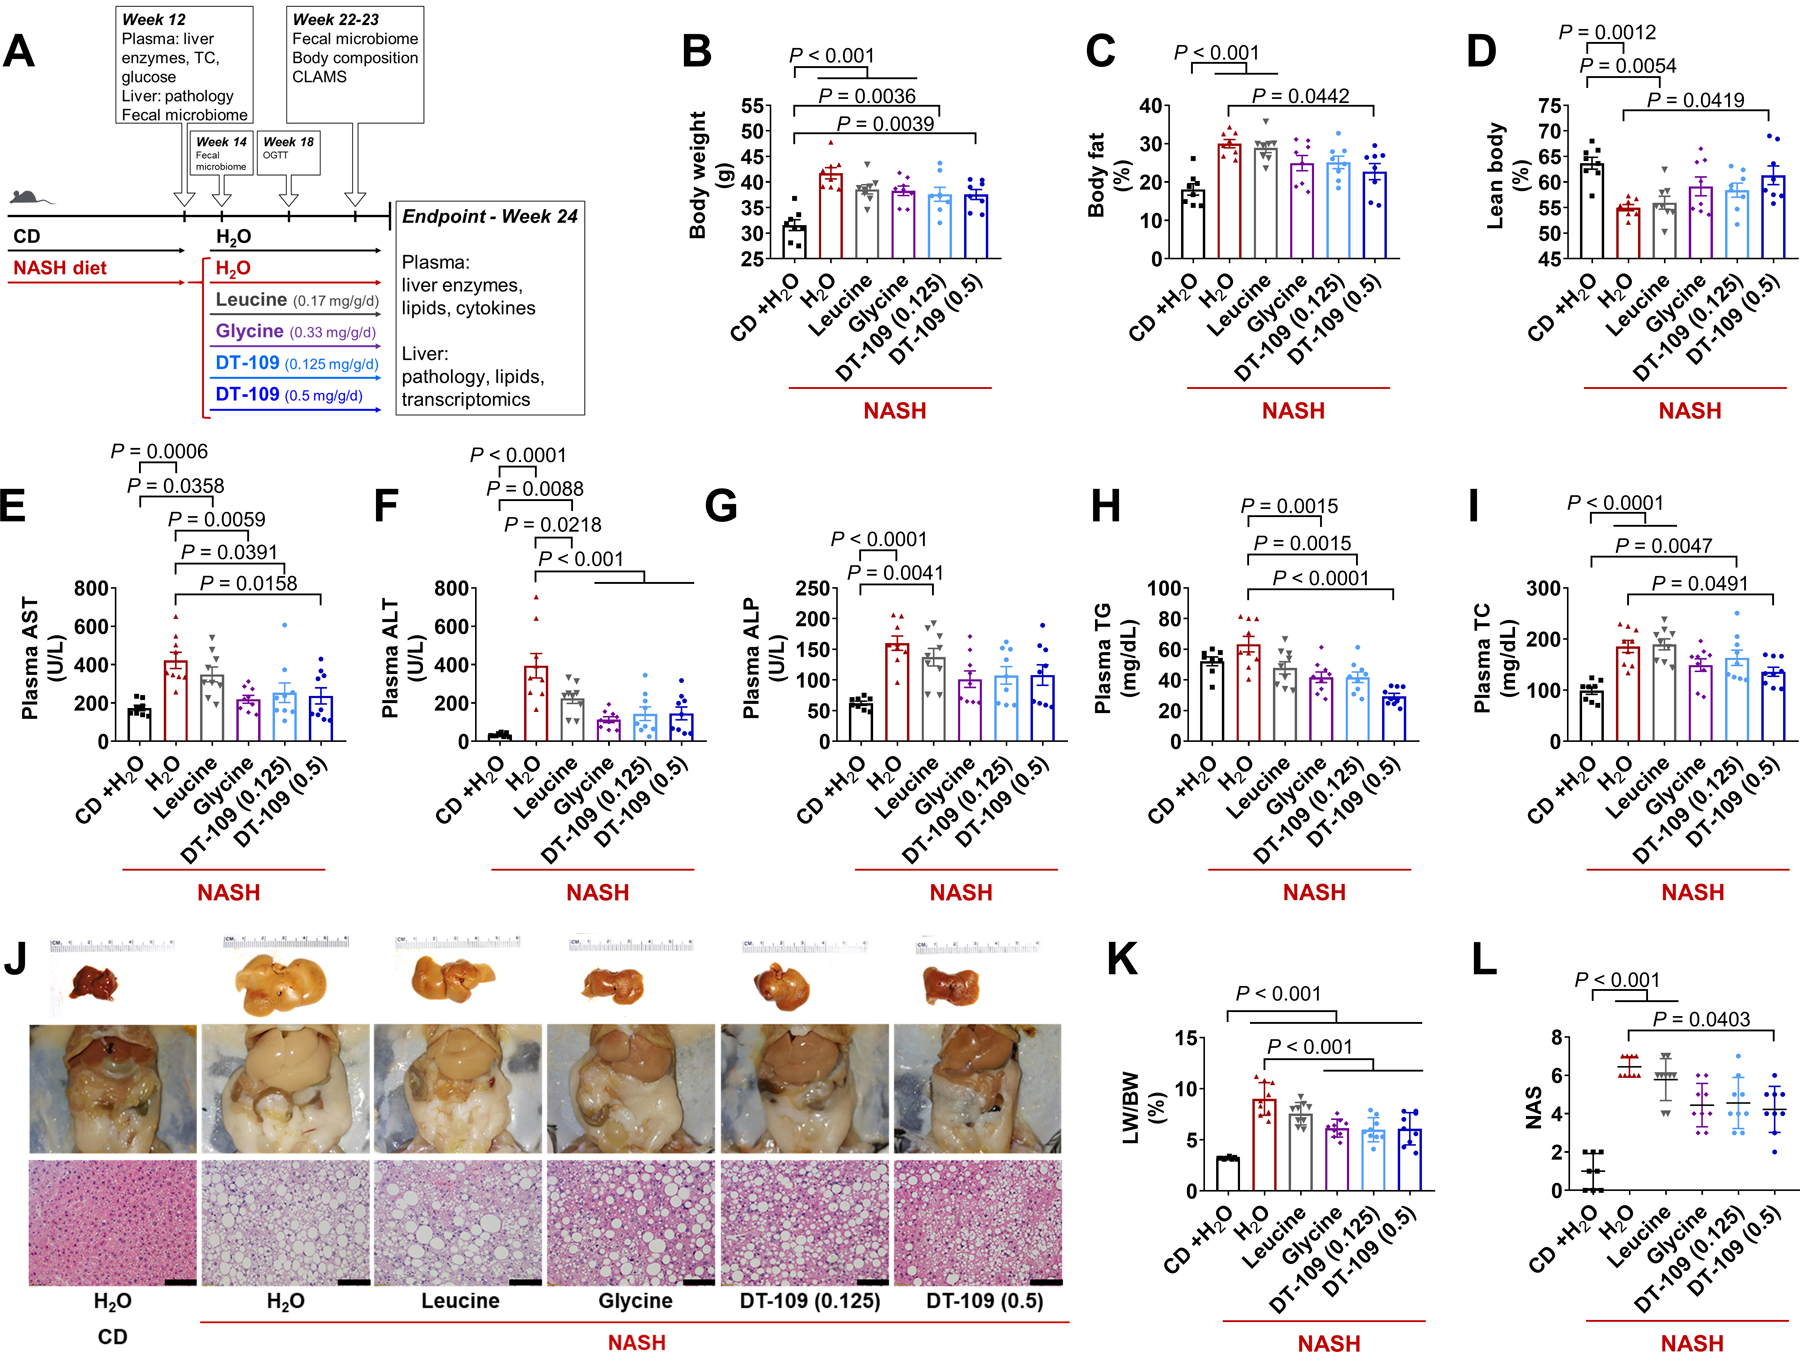
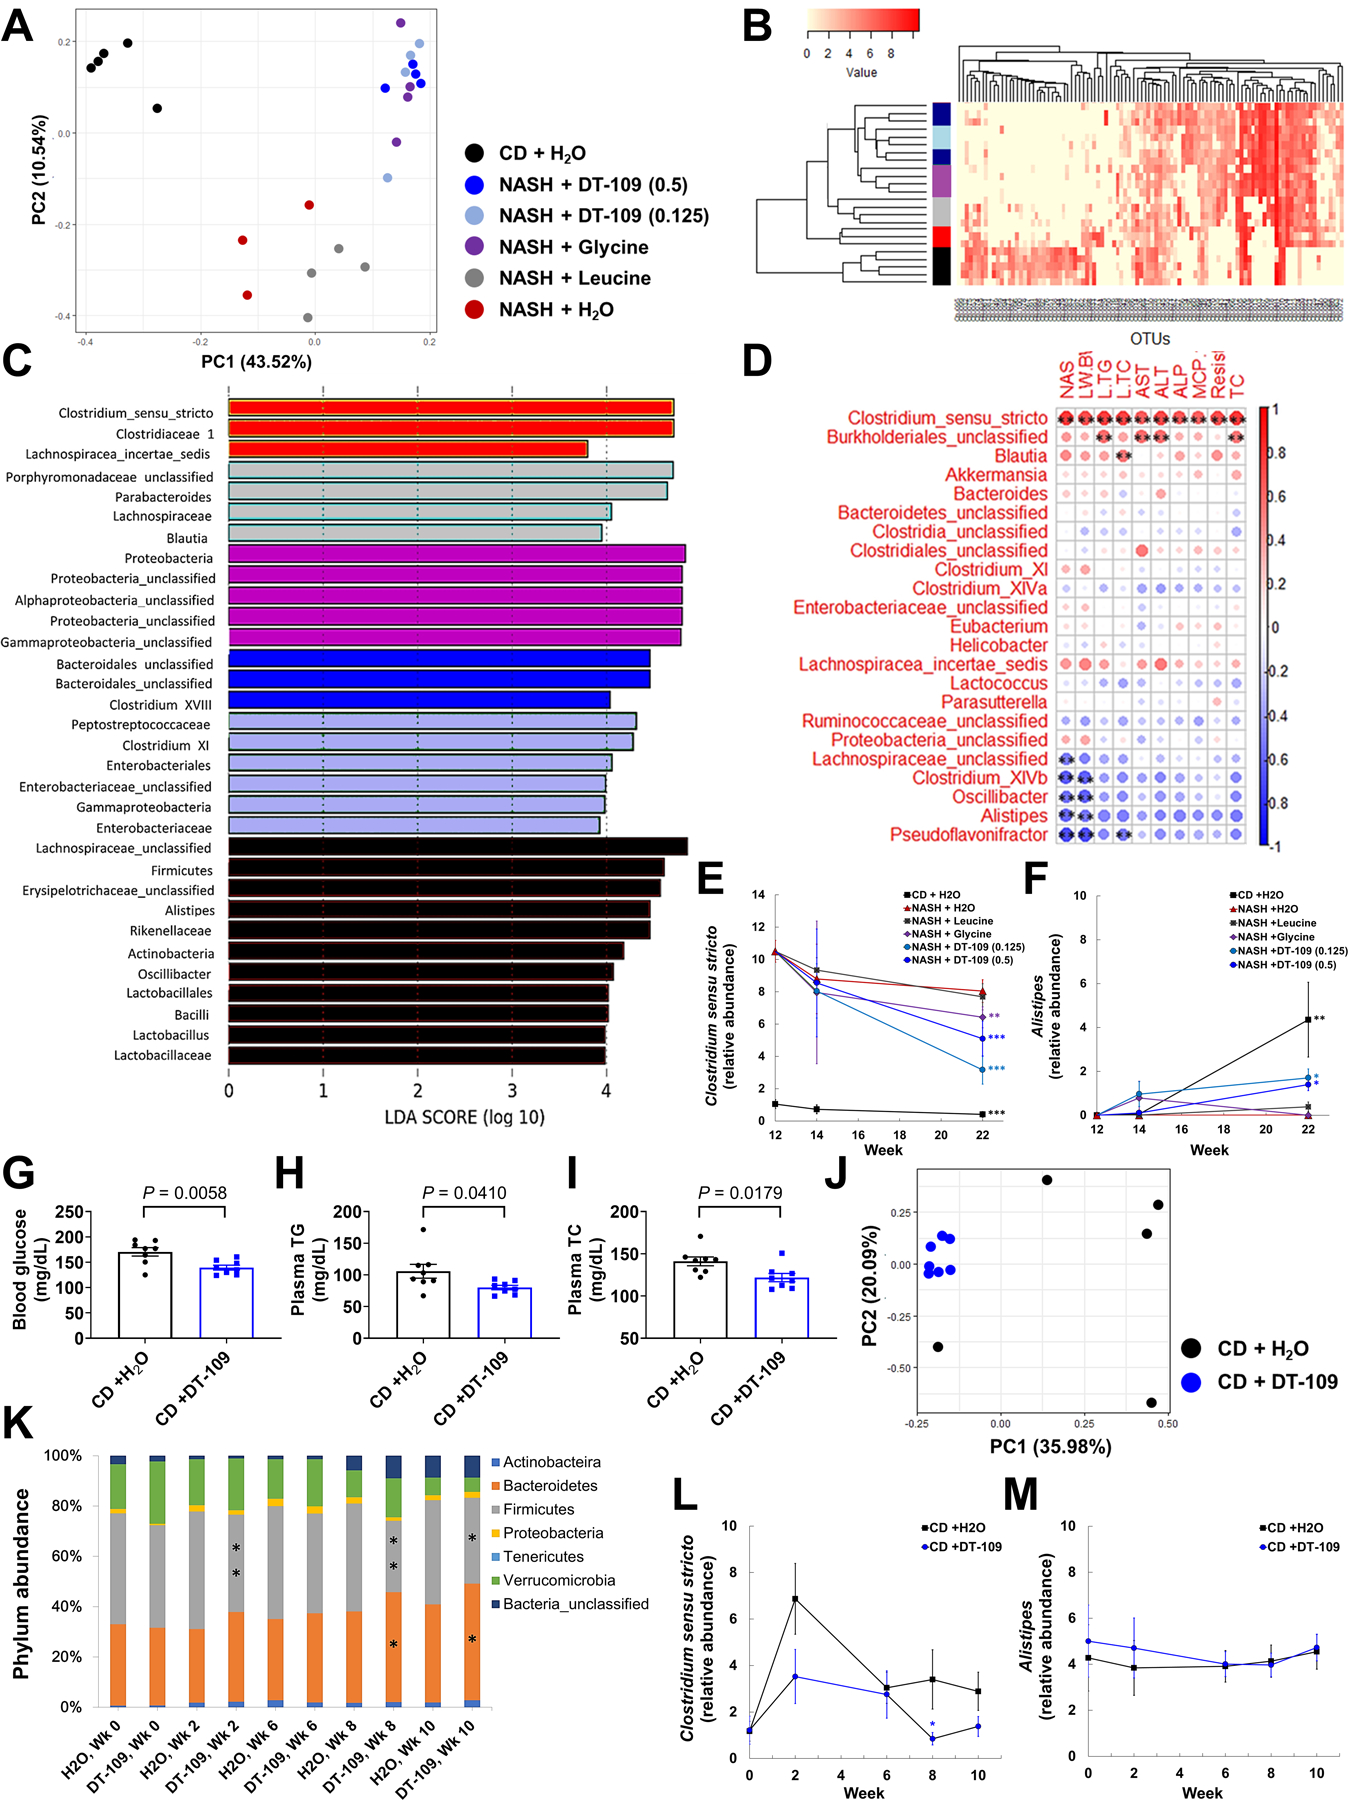
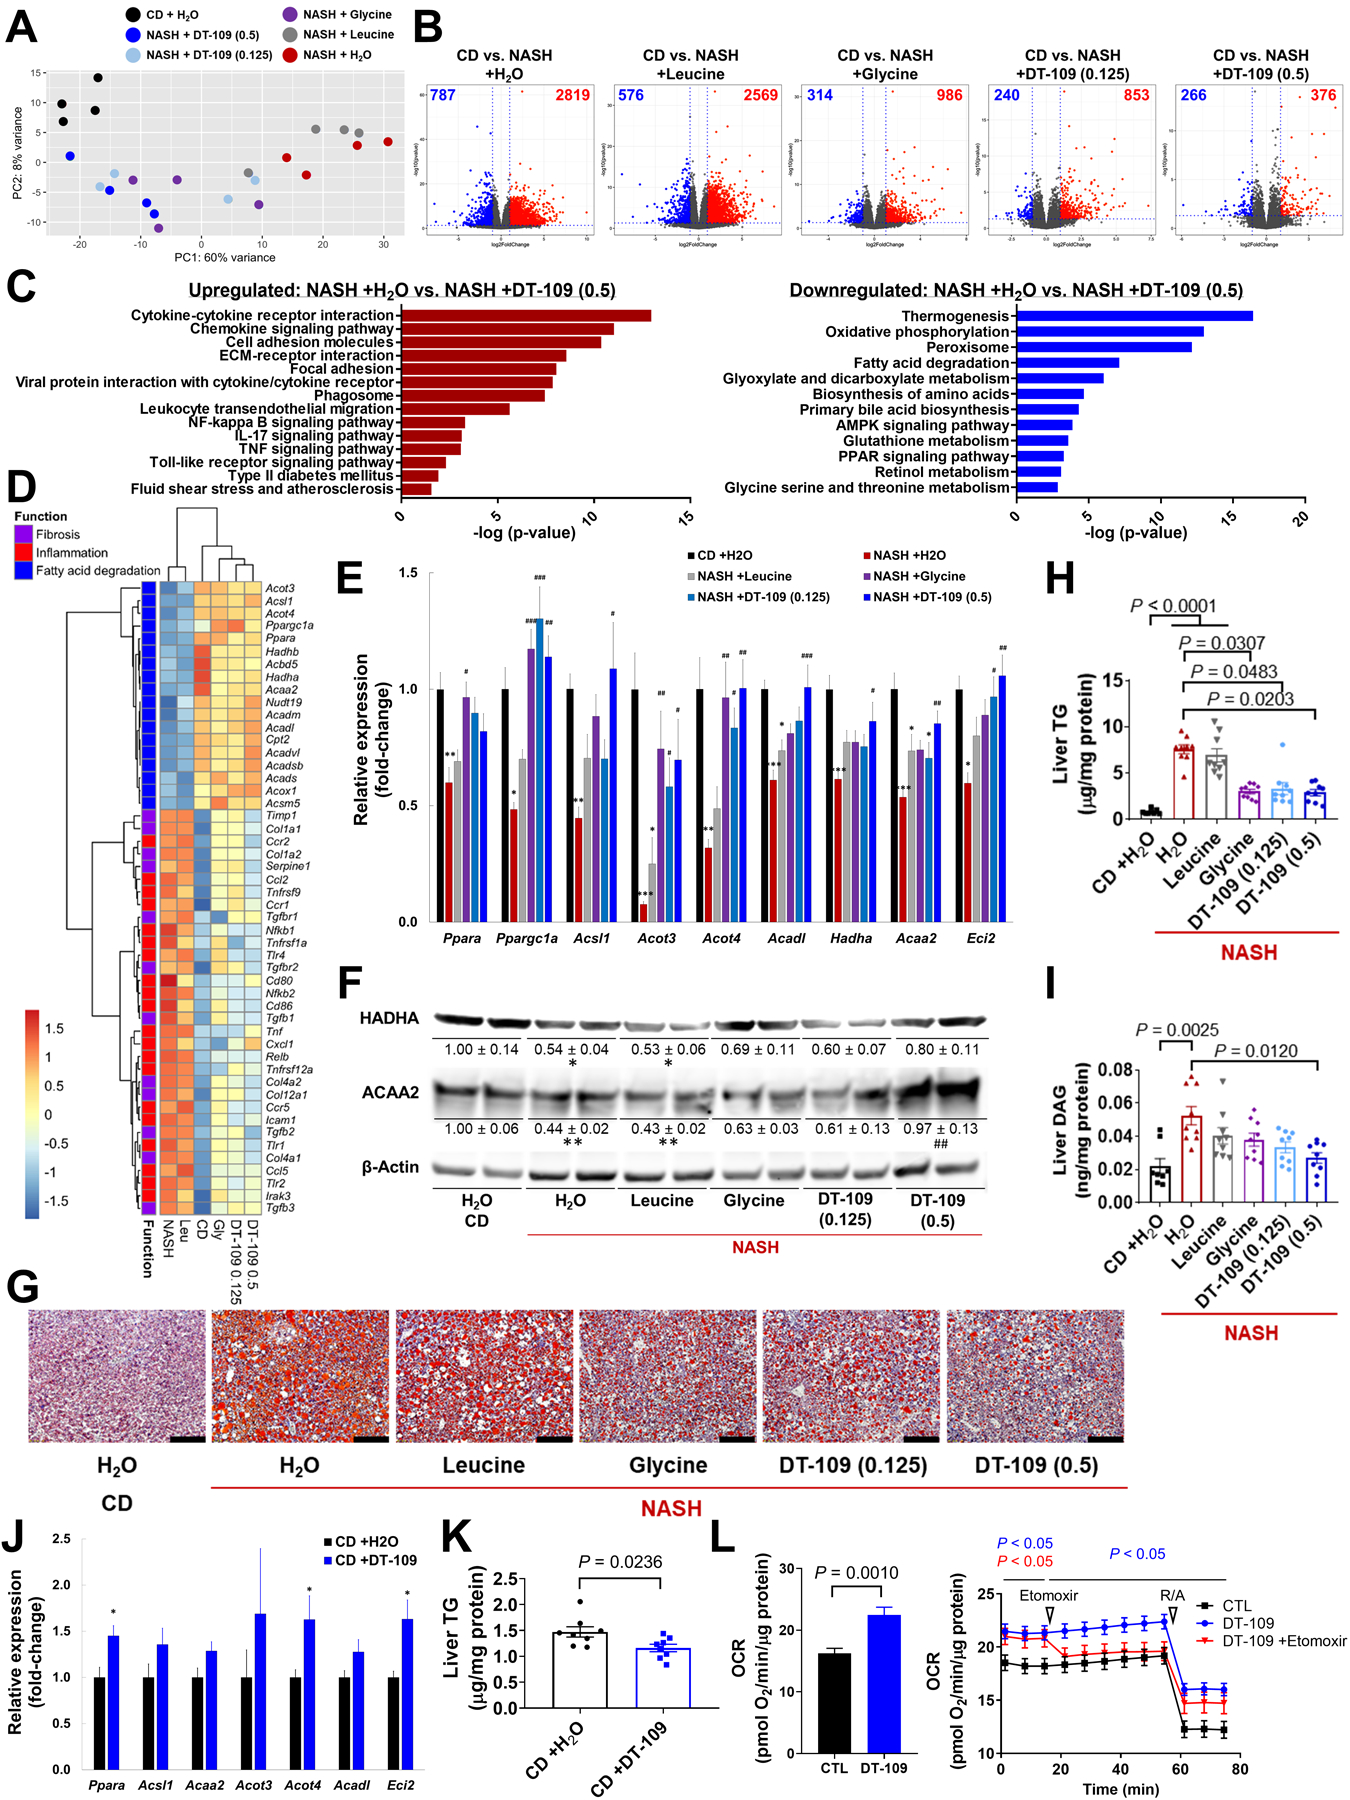
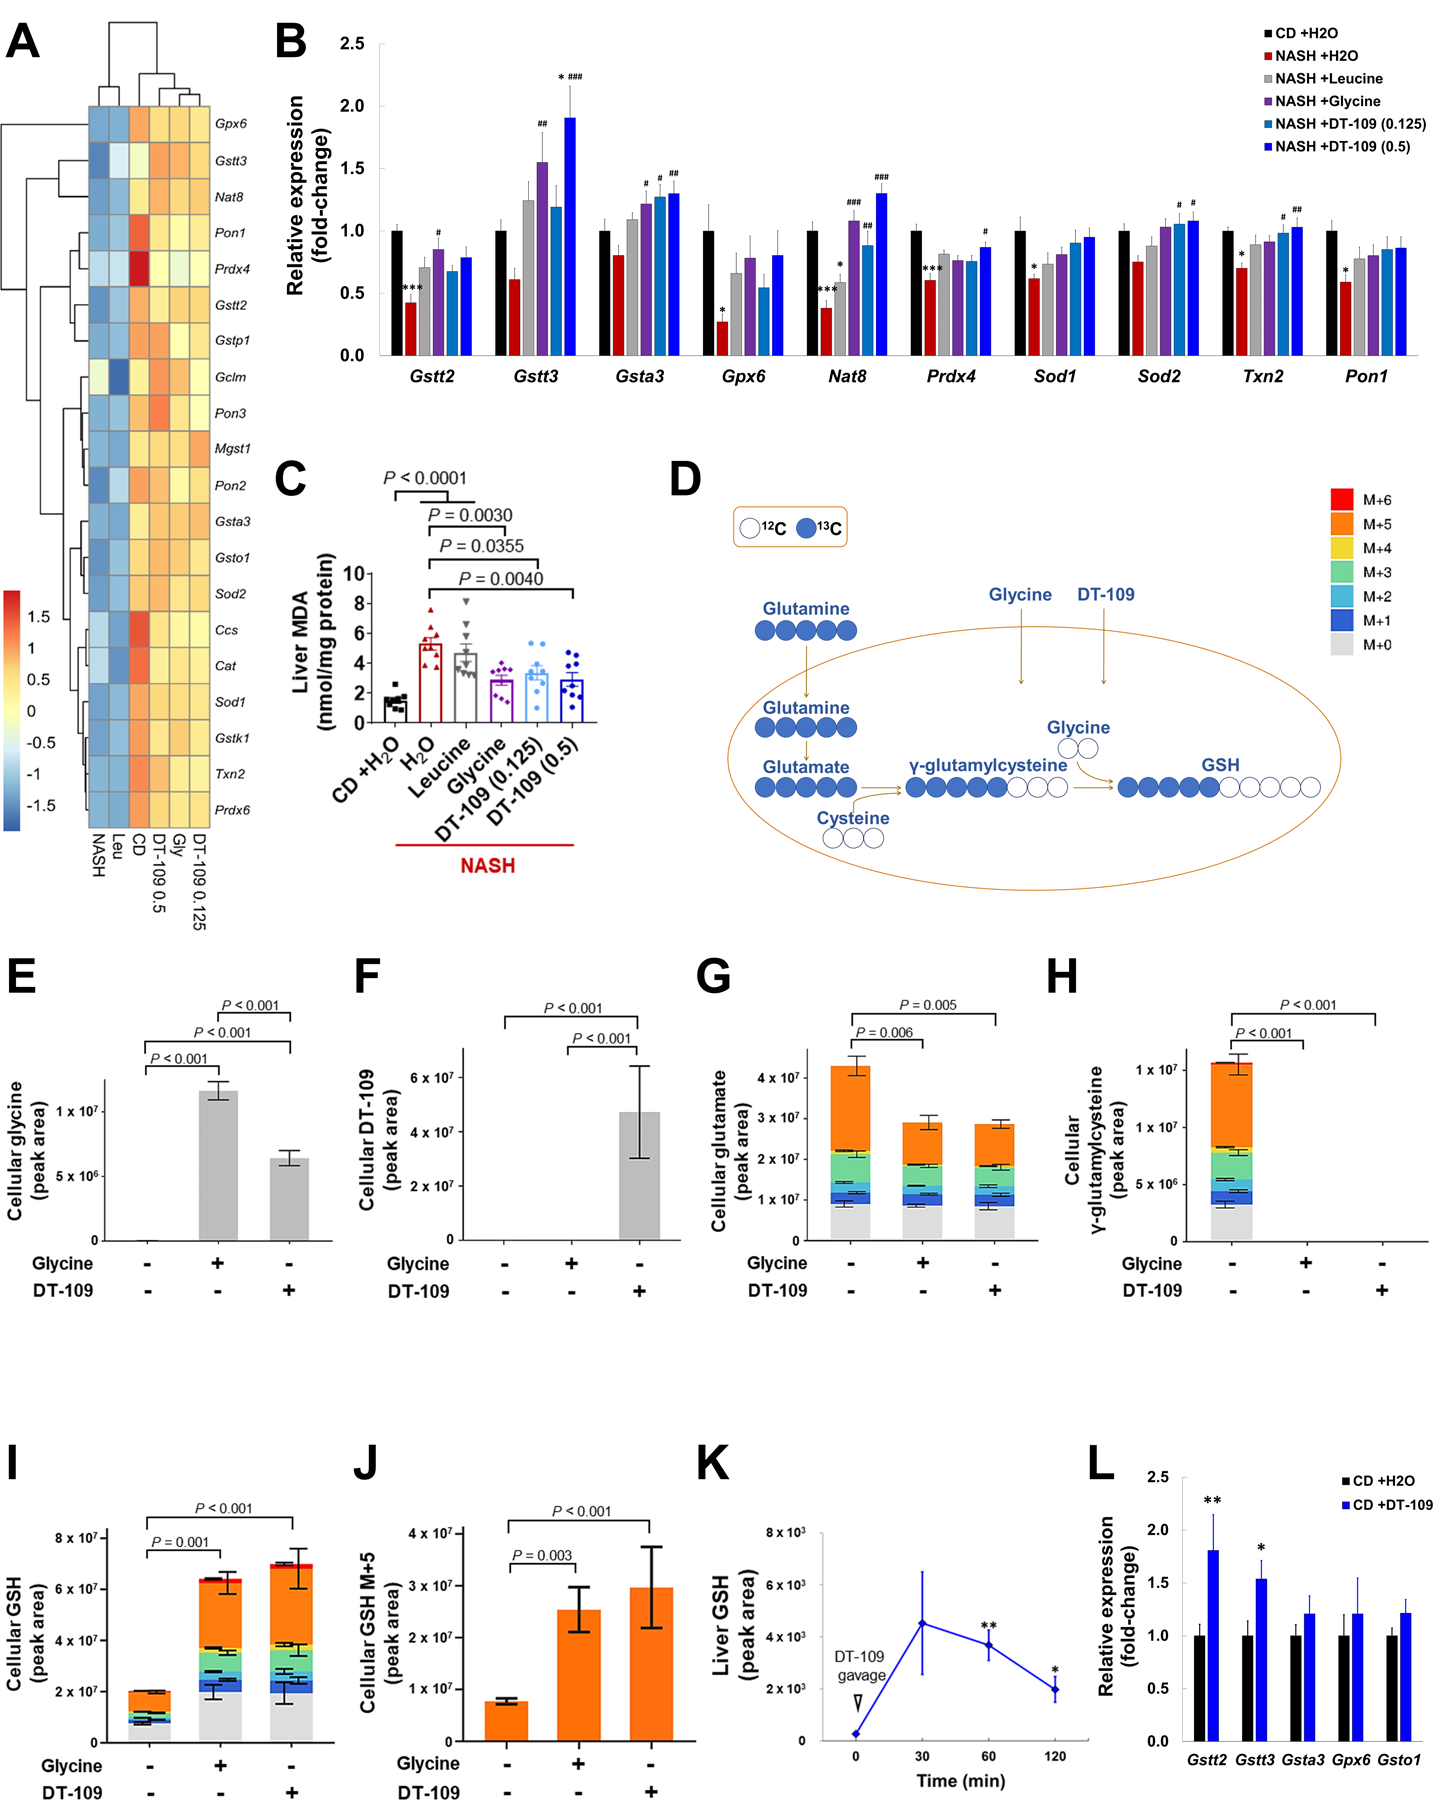
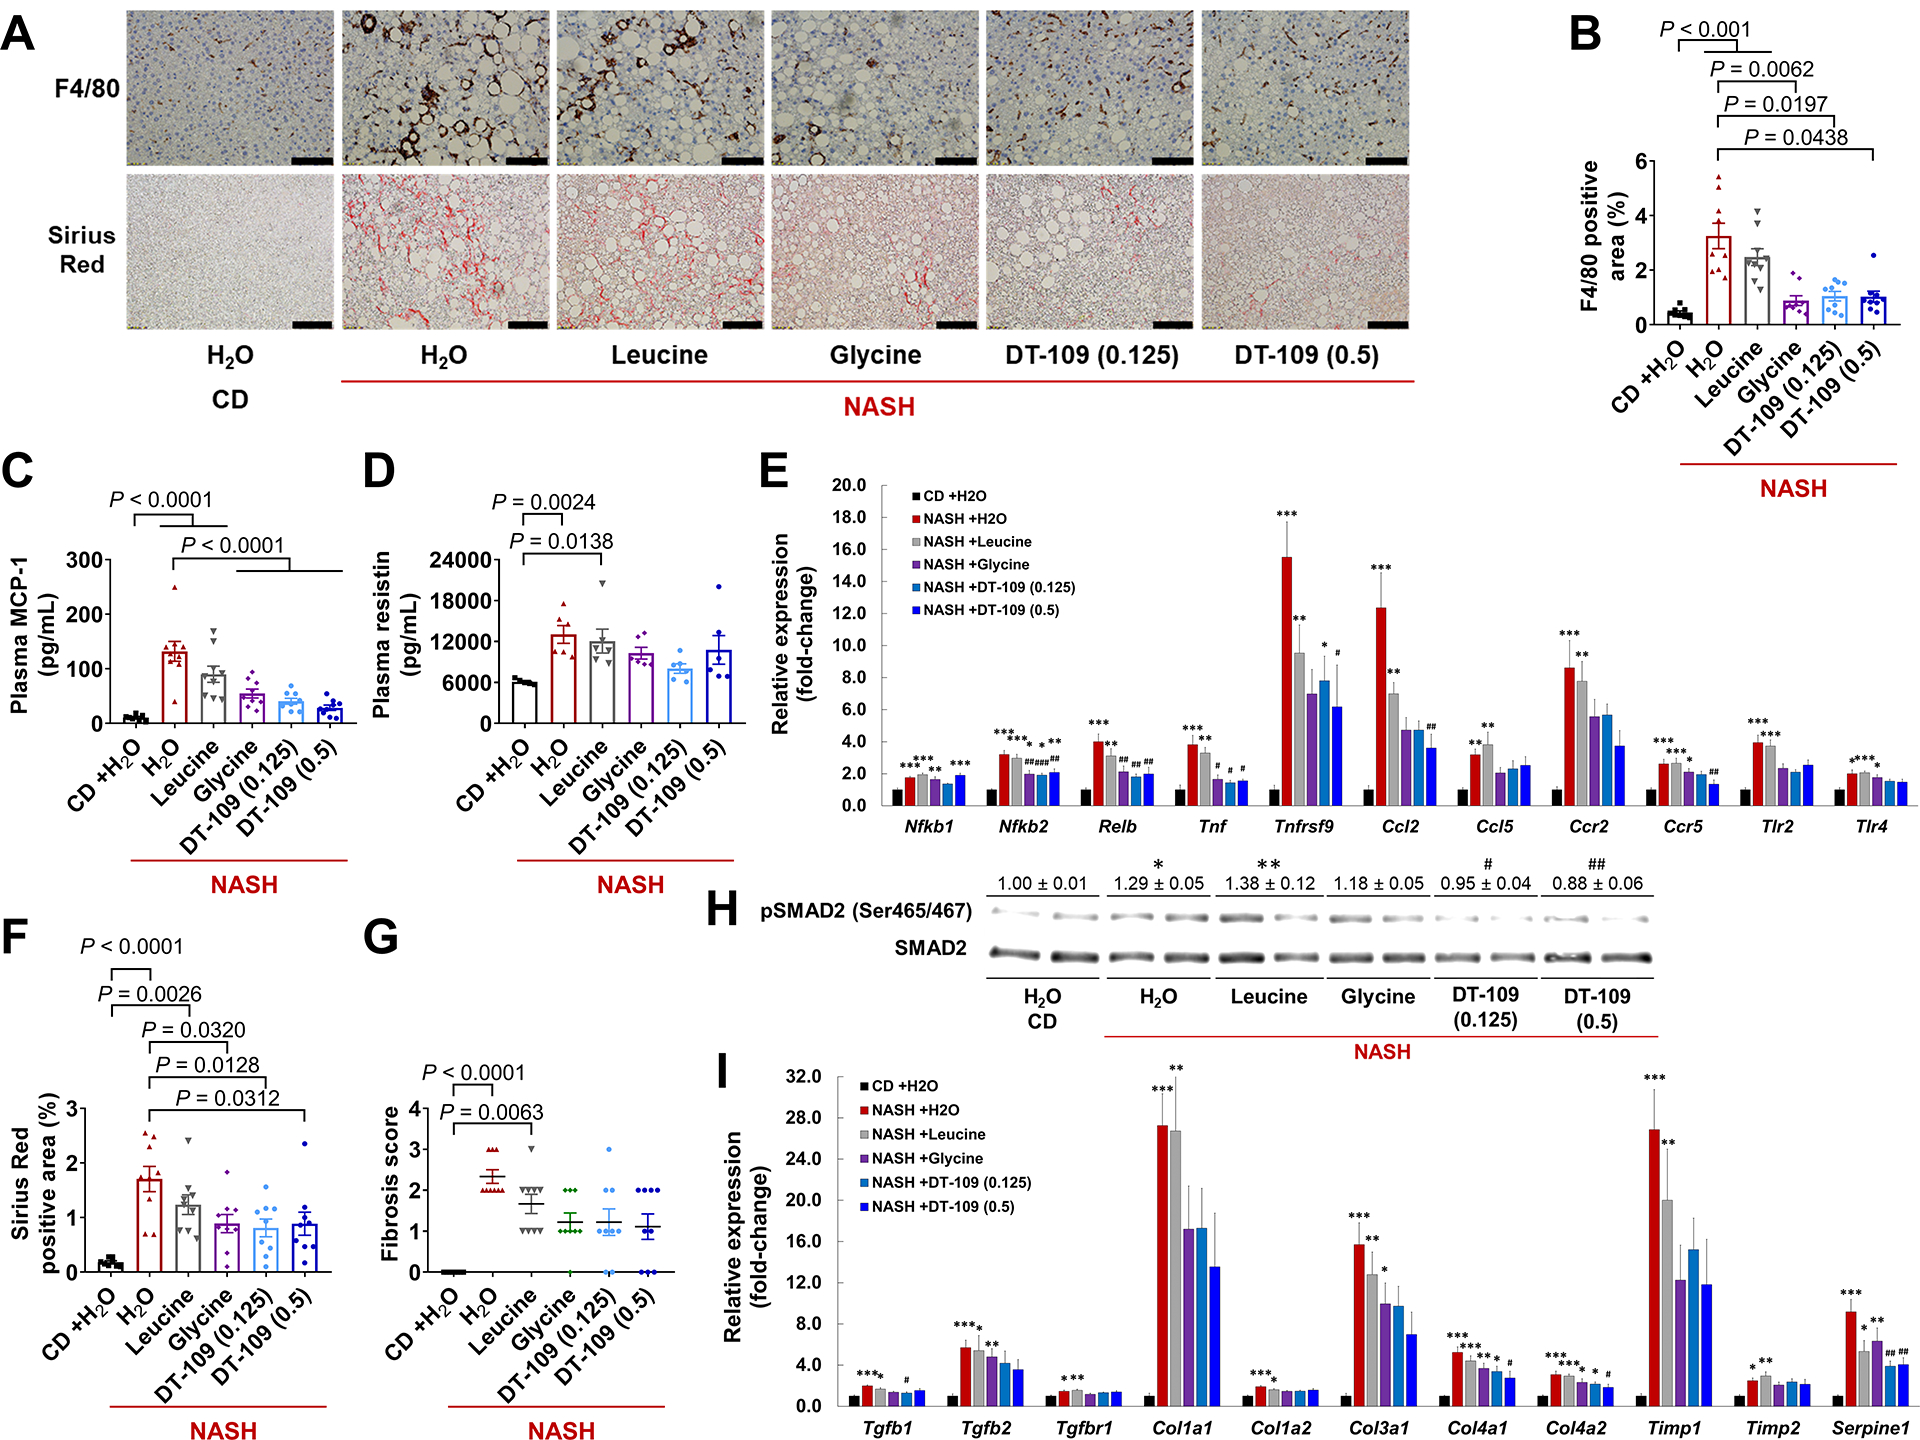
Nonalcoholic fatty liver disease (NAFLD) including nonalcoholic steatohepatitis (NASH) has reached epidemic proportions with no pharmacological therapy approved. Lower circulating glycine is consistently reported in patients with NAFLD, but the causes for reduced glycine, its role as a causative factor, and its therapeutic potential remain unclear. We performed transcriptomics in livers from humans and mice with NAFLD and found suppression of glycine biosynthetic genes, primarily alanine-glyoxylate aminotransferase 1 (AGXT1). Genetic (Agxt1 -/- mice) and dietary approaches to limit glycine availability resulted in exacerbated diet-induced hyperlipidemia and steatohepatitis, with suppressed mitochondrial/peroxisomal fatty acid β-oxidation (FAO) and enhanced inflammation as the underlying pathways. We explored glycine-based compounds with dual lipid/glucose-lowering properties as potential therapies for NAFLD and identified a tripeptide (Gly-Gly-L-Leu, DT-109) that improved body composition and lowered circulating glucose, lipids, transaminases, proinflammatory cytokines, and steatohepatitis in mice with established NASH induced by a high-fat, cholesterol, and fructose diet. We applied metagenomics, transcriptomics, and metabolomics to explore the underlying mechanisms. The bacterial genus Clostridium sensu stricto was markedly increased in mice with NASH and decreased after DT-109 treatment. DT-109 induced hepatic FAO pathways, lowered lipotoxicity, and stimulated de novo glutathione synthesis. In turn, inflammatory infiltration and hepatic fibrosis were attenuated via suppression of NF-κB target genes and TGFβ/SMAD signaling. Unlike its effects on the gut microbiome, DT-109 stimulated FAO and glutathione synthesis independent of NASH. In conclusion, impaired glycine metabolism may play a causative role in NAFLD. Glycine-based treatment attenuates experimental NAFLD by stimulating hepatic FAO and glutathione synthesis, thus warranting clinical evaluation.


Conflict of interest statement

Competing interests: O.R., Y.Z., J.Z. and Y.E.C. have filed a patent application based on this work (Tri-peptides and treatment of metabolic, cardiovascular and inflammatory disorders, PCT/US2019/046052). Y.E.C. is the founder of Diapin Therapeutics, which provided DT-109/110 for this study. All other authors declare that they have no competing interests.

Figures

Fig. 1.
Fig. 1.. Impaired glycine biosynthesis in NAFLD.
C57BL/6J mice were fed standard chow-diet (CD) or Western-diet (WD) for 12 weeks: (A) Plasma TC. (B) Liver histology (Scale bar: H&E 50μm, ORO 100μm), (C) TGs, (D) and TC. (E) Plasma amino acids relative to CD. (F) Hepatic expression of glycine biosynthetic genes relative to glyceraldehyde 3-phosphate dehydrogenase (Gapdh), *P<0.05, **P<0.01, ***P<0.001 vs. CD (n=4–5). (G) Cellular TGs and (H) AGXT1 expression in HepG2 cells loaded with 200 μM PA or ethanol for 24h (n=3–4). C57BL/6J mice were fed NASH-diet or CD for 24 weeks (n=10): (I) Liver morphology, H&E and Sirius Red histology (Scale bar: 50 μm), (J) significant downregulation (blue) of glycine biosynthetic genes/pathways by RNA-sequencing of livers from CD or NASH-diet fed mice (n=3, log2FC, log2fold-change), (K) Agxt1 expression relative to Gapdh in mice with diet-induced NASH (n=8). (L) Significant downregulation (blue) or upregulation (red) in glycine metabolism genes by meta-analysis of liver microarray data from healthy vs. NASH patients. (M) Spearman’s correlation between AGXT1 expression and hepatic fat in livers from transplantation donors (n=206). Data are means ± SEM. Statistical differences were compared using Student’s t test or Mann-Whitney U test. Benjamini-Hochberg and Cochran’s Q heterogeneity tests were used to determine the significance of glycine metabolism genes associated with NASH.
Fig. 2.
Fig. 2.. Plasma alterations in Agxt1−/− mice fed NASH-diet.
HepG2 cells were transfected with siRNA targeting AGXT1 (siAGXT1) or non-targeting siRNA control (siCTL): (A) AGXT1 mRNA relative to GAPDH (n=12), (B) Western blot and quantitative densitometry of AGXT1 relative to GAPDH (n=6), and (C) cellular TG, with or without PA loading (200 μM, n=12). HepG2 cells were transfected with a GFP-tagged AGXT1 plasmid or a GFP plasmid as control: (D) Western blot of AGXT1 relative to GAPDH (n=3), and (E) cellular TG, with or without PA loading (200 μM, n=10). (F) CRISPR/Cas9 strategy to generate Agxt1/− mice. The guide-RNA target site on exon 1 of Agxt1 is underlined. A deletion three bases from the protospacer adjacent motif (PAM) was confirmed by Sanger sequencing. (G) Absence of AGXT1 confirmed by Western blot (n=7). Agxt1+/+ and Agxt1−/− mice were fed NASH-diet for 12 weeks: Plasma (H) glycine/oxalate ratio (n=8), (I) TG, (J) TC, (K) AST and (L) ALT (n=12). Data are means ± SEM. Statistical differences were compared using Student’s t test or Mann-Whitney U test.
Fig. 3.
Fig. 3.. Accelerated diet-induced NASH in Agxt1−/− mice.
Agxt1+/+ and Agxt1−/− mice were fed NASH-diet for 12 weeks (n=12): (A) Gross appearance of the peritoneal cavities and liver histology (Scale bar: H&E and Sirius Red 50μm, ORO 100μm), (B) liver weight/body weight ratio (LW/BW %), (C) liver TG, (D) liver TC, (E) NAS and (F) fibrosis score. (G) Pathway analysis following RNA-sequencing of livers from Agxt1+/+ and Agxt1−/− mice (n=4). Pathways enriched in the up- or down-regulated DEG are plotted in red or blue, respectively. (H) Heatmap of NASH-related DEG. (I) FAO-related DEG confirmed by qPCR (n=10) and (J) Western blot (n=4). (K) Inflammation- and (L) fibrosis-related DEG confirmed by qPCR (n=10). *P<0.05, **P<0.01, ***P<0.001 vs. Agxt1+/+. Data are means ± SEM. Statistical differences were compared using Student’s t test or Mann-Whitney U test. The significance of the enriched pathways was determined by right-tailed Fisher’s exact test followed by Benjamini-Hochberg multiple testing adjustment.
Fig. 4.
Fig. 4.. DT-109 protects against diet-induced NASH.
(A) C57BL/6J mice were fed CD or NASH-diet for 12 weeks. After NASH confirmation, mice were randomized to receive 0.125 or 0.5 mg/g/day DT-109 or equivalent amounts of leucine, glycine (0.17, 0.33 mg/g/day) or H2O via oral gavage for an additional 12 weeks on NASH-diet. Mice fed CD and administered H2O served as control (n=8–9). NMR-based body composition analysis at weeks 22–23: (B) Body weight, (C) fat (%), and (D) lean mass (%). Endpoint plasma analysis: (E) AST, (F) ALT, (G) ALP, (H) TG and (I) TC. (J) Gross morphology and H&E histology (Scale bar: 50 μm). (K) LW/BW ratio. (L) NAS. Data are means ± SEM. Statistical differences were compared by one-way ANOVA followed by Bonferroni post-hoc test or by Kruskal-Wallis test followed by Dunn’s post-hoc test.
Fig. 5.
Fig. 5.. The effects of DT-109 on the gut microbiome on NASH-diet and CD.
Fecal samples were obtained after 10 weeks of treatment on NASH-diet or CD (Fig. 4A). (A) PCA, (B) hierarchical clustering of OTUs in each group (sidebar colors as in A), (C) LDA of overrepresented bacterial taxa in each group, (D) correlations between altered genera and NAFLD-related parameters. Spearman’s correlation coefficients are represented by color ranging from blue (1) to red (+1), **P<0.01. Relative abundance of (E) Clostridium sensu stricto and (F) Alistipes in fecal samples from each group before (week 12), after 2 and 10 weeks of treatments. (n=3–5 cages) **P<0.01, ***P<0.001 vs. NASH before treatments. C57BL/6J mice were fed CD and treated with 0.5 mg/g/day DT-109 for 10 weeks. (G) Endpoint non-fasting blood glucose, (H) plasma TG and (I) TC (n=8 mice). Fecal samples were obtained at baseline and after 2, 6, 8 and 10 weeks of DT-109 treatment: (J) PCA at endpoint, (K) phylum-level comparison, (L) Clostridium sensu stricto and (M) Alistipes in fecal samples from each group throughout the study (n=5–7 cages), *P<0.05, **P<0.01 vs. CD +H2O. Data are means ± SEM. Statistical differences were compared using Student’s t test or Mann-Whitney U test or using one-way ANOVA followed by Bonferroni post-hoc test or by Kruskal-Wallis test followed by Dunn’s post-hoc test.
Fig. 6.
Fig. 6.. Glycine-based treatment corrects impaired FAO, HS, and lipotoxicity induced by NASH-diet.
RNA-sequencing of livers collected at endpoint (n=4): (A) PCA, (B) volcano plots of DEG in each group compared to CD (blue: downregulated; Red: upregulated), (C) pathway analysis comparing NASH+H2O to NASH+0.5 mg/g/day DT-109. Pathways enriched in the up- or downregulated DEG are plotted in red or blue, respectively, (D) heatmap of NASH-related DEG across all experimental groups (log2fold-change vs. CD). (E) qPCR validation of FAO-related DEG in independent samples (n=8), *P<0.05, **P<0.01, ***P<0.001 vs. CD; #P<0.05, ##P<0.01, ###P<0.001 vs. NASH+H2O, and (F) Western blot (n=4). (G) ORO histology (Scale bar: 100μm), (H) liver TG and (I) DAG (n=8–9). C57BL/6J mice were fed CD and treated with 0.5 mg/g/day DT-109 for 10 weeks (n=8). (J) qPCR analysis of FAO-related genes relative to Gapdh. (K) Liver TG. (L) HepG2 cells were treated with or without 1 mM DT-109 for 24 h followed by Seahorse analysis of OCR in the absence or presence of 6 μM etomoxir (n=3). Data are means ± SEM. Statistical differences were compared using Student’s t test or Mann-Whitney U test or using one-way ANOVA followed by Bonferroni post-hoc test or by Kruskal-Wallis test followed by Dunn’s post-hoc test. Significance of the enriched pathways was determined by right-tailed Fisher’s exact test followed by Benjamini-Hochberg multiple testing adjustment.
Fig. 7.
Fig. 7.. Antioxidant effects of glycine-based treatment via de novo GSH synthesis.
(A) Heatmap of redox-related DEG across all experimental groups (log2fold-change vs. CD, n=4). (B) qPCR validation of related genes in independent samples (n=8). *P<0.05, ***P<0.001 vs. CD; #P<0.05, ##P<0.01, ###P<0.001 vs. NASH+H2O. (C) Liver MDA (n=8–9). (D) Schematic representation of labeling de novo synthesized GSH from 13C5-labeled glutamine, cysteine and glycine. AML-12 cells were cultured with 1 mM 13C5-labeled glutamine for 5 h in the presence or absence of glycine or DT-109 (1 mM). Isotopologue distribution (normalized peak area) of indicated cellular metabolites as determined by LC-MS (n=2–4): (E) Glycine, (F) DT-109, (G) glutamate, (H) γ-glutamylcysteine, (I) GSH and (J) M+5 istotopologue of GSH. (K) LC-MS analysis of liver GSH before and after 30, 60 and 120 min from oral administration of 0.5 mg/g DT-109 to C57BL/6J mice (n=3). (L) Mice were fed CD and treated with 0.5 mg/g/day DT-109 for 10 weeks. Liver expression of genes regulating GSH metabolism relative to Gapdh by qPCR (n=8). Statistical differences were compared using Student’s t test or Mann-Whitney U test or using one-way ANOVA followed by Bonferroni post-hoc test or by Kruskal-Wallis test followed by Dunn’s post-hoc test.
Fig. 8.
Fig. 8.. Glycine-based treatment reduces hepatic inflammation and fibrosis induced by NASH-diet.
(A) F4/80 immunohistochemistry and Sirius Red histology (Scale bar: 50 μm), (B) F4/80 positive area (n=8–9). (C) Plasma MCP-1 (n=8–9), and (D) resistin (n=5–6). (E) qPCR validation of inflammation-related genes in independent samples (n=8). (F) Sirius Red positive area. (G) Fibrosis score. (H) Western blot of phosphorylated-SMAD2 (Ser465/467) and total-SMAD2. (I) qPCR validation of fibrosis-related DEG. *P<0.05, **P<0.01, ***P<0.001 vs. CD; #P<0.05, ##P<0.01, ###P<0.001 vs. NASH+H2O. Data are means ± SEM. Statistical differences were compared by one-way ANOVA followed by Bonferroni post-hoc test or by Kruskal-Wallis test followed by Dunn’s post-hoc test.

References

    1. Younossi ZM, Koenig AB, Abdelatif D, Fazel Y, Henry L, Wymer M. Global epidemiology of nonalcoholic fatty liver disease-Meta-analytic assessment of prevalence, incidence, and outcomes. Hepatology. 64, 73–84 (2016). - PubMed
    1. Friedman SL, Neuschwander-Tetri BA, Rinella M, Sanyal AJ. Mechanisms of NAFLD development and therapeutic strategies. Nat. Med 24, 908–922 (2018). - PMC - PubMed
    1. Bedossa P, Poitou C, Veyrie N, Bouillot JL, Basdevant A, Paradis V, Tordjman J, Clement K. Histopathological algorithm and scoring system for evaluation of liver lesions in morbidly obese patients. Hepatology. 56, 1751–17599 (2012). - PubMed
    1. Sinn DH, Cho SJ, Gu S, Seong D, Kang D, Kim H, Yi BK, Paik SW, Guallar E, Cho J, Gwak GY. Persistent Nonalcoholic Fatty Liver Disease Increases Risk for Carotid Atherosclerosis. Gastroenterology. 151, 481–488.e1 (2016). - PubMed
    1. Younes R, Bugianesi E. A spotlight on pathogenesis, interactions and novel therapeutic options in NAFLD. Nat. Rev. Gastroenterol. Hepatol 16,80–82 (2019). - PubMed

Publication types