. 2020 Dec 2;12(572):eabb5817.
doi: 10.1126/scitranslmed.abb5817.

Reactivation of dormant tumor cells by modified lipids derived from stress-activated neutrophils

Affiliations

Reactivation of dormant tumor cells by modified lipids derived from stress-activated neutrophils

Michela Perego et al. Sci Transl Med. .

Abstract

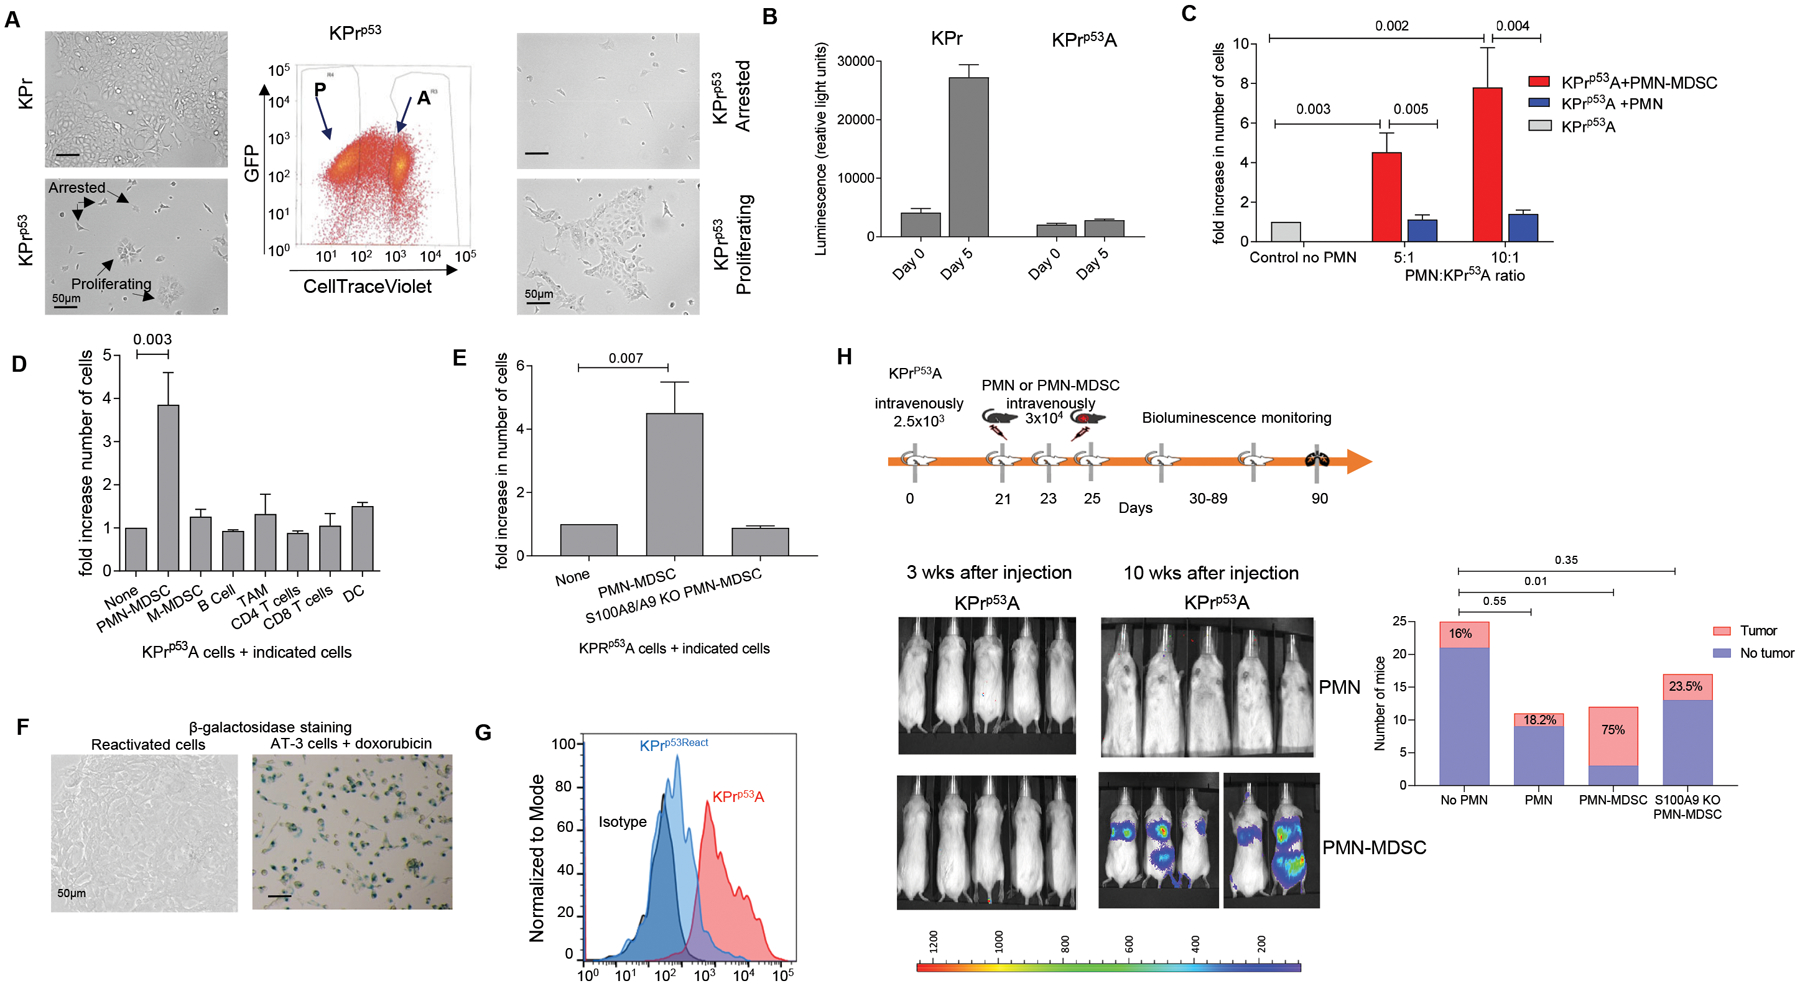
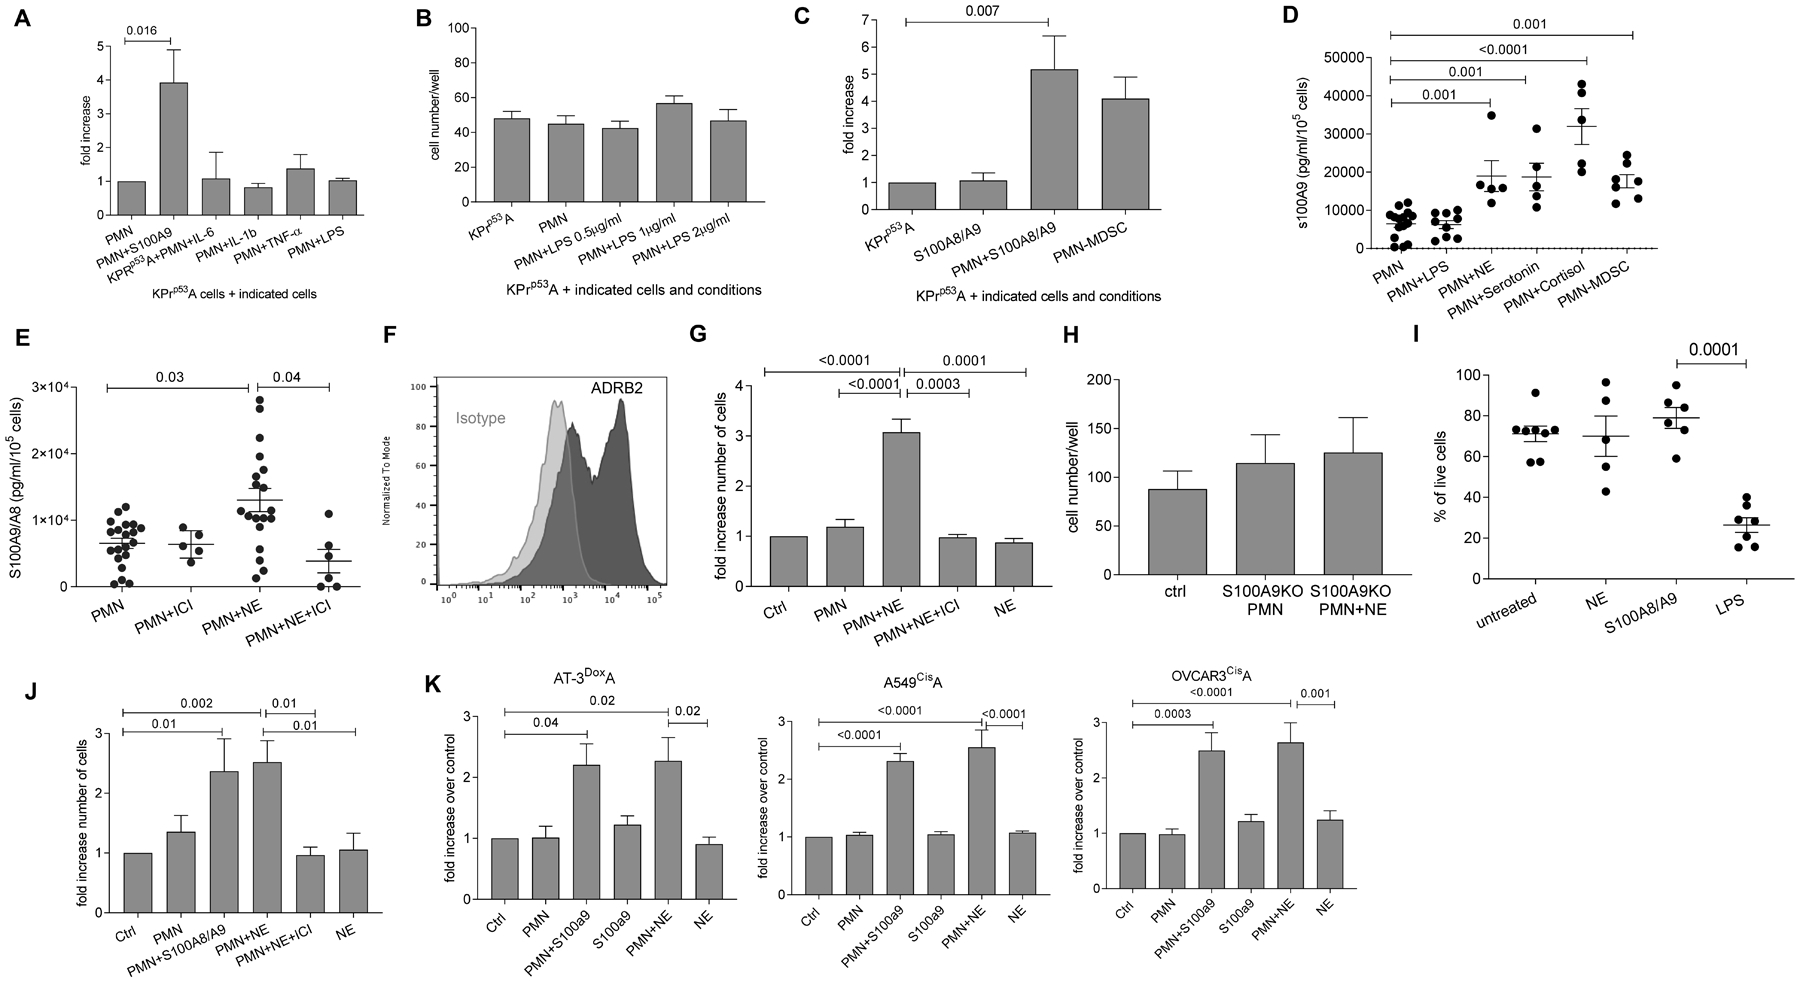
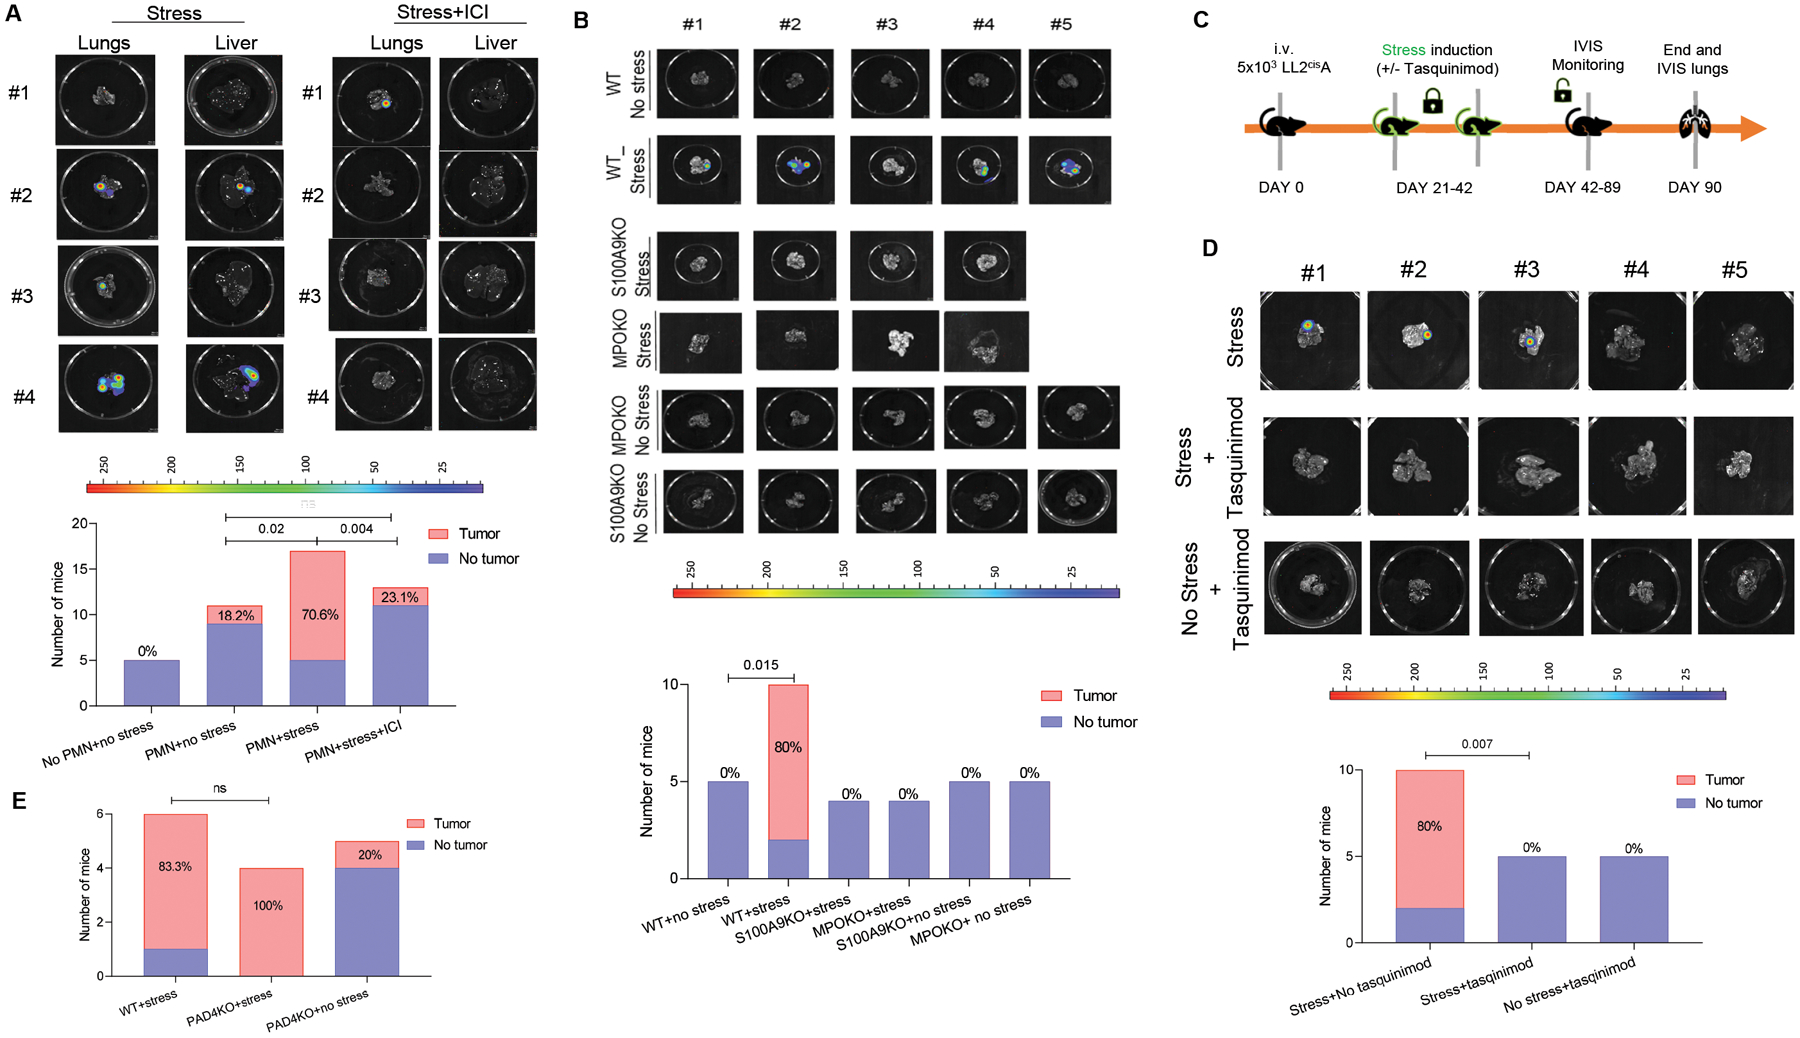
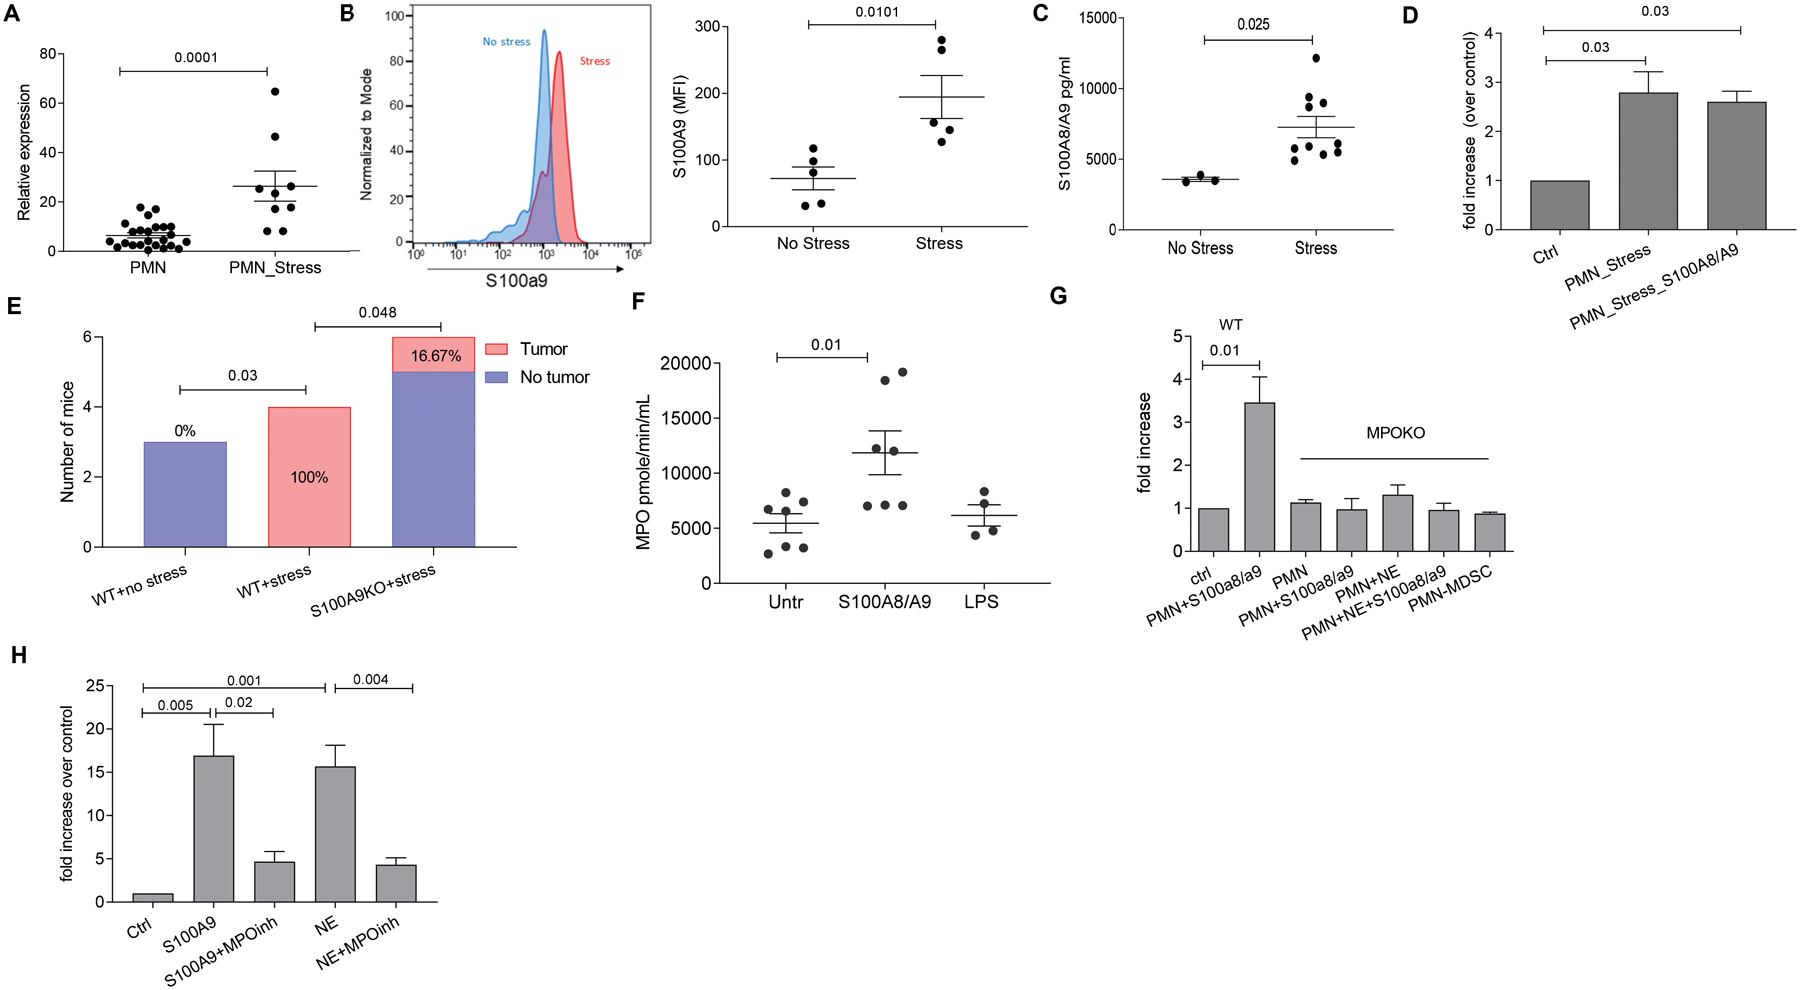
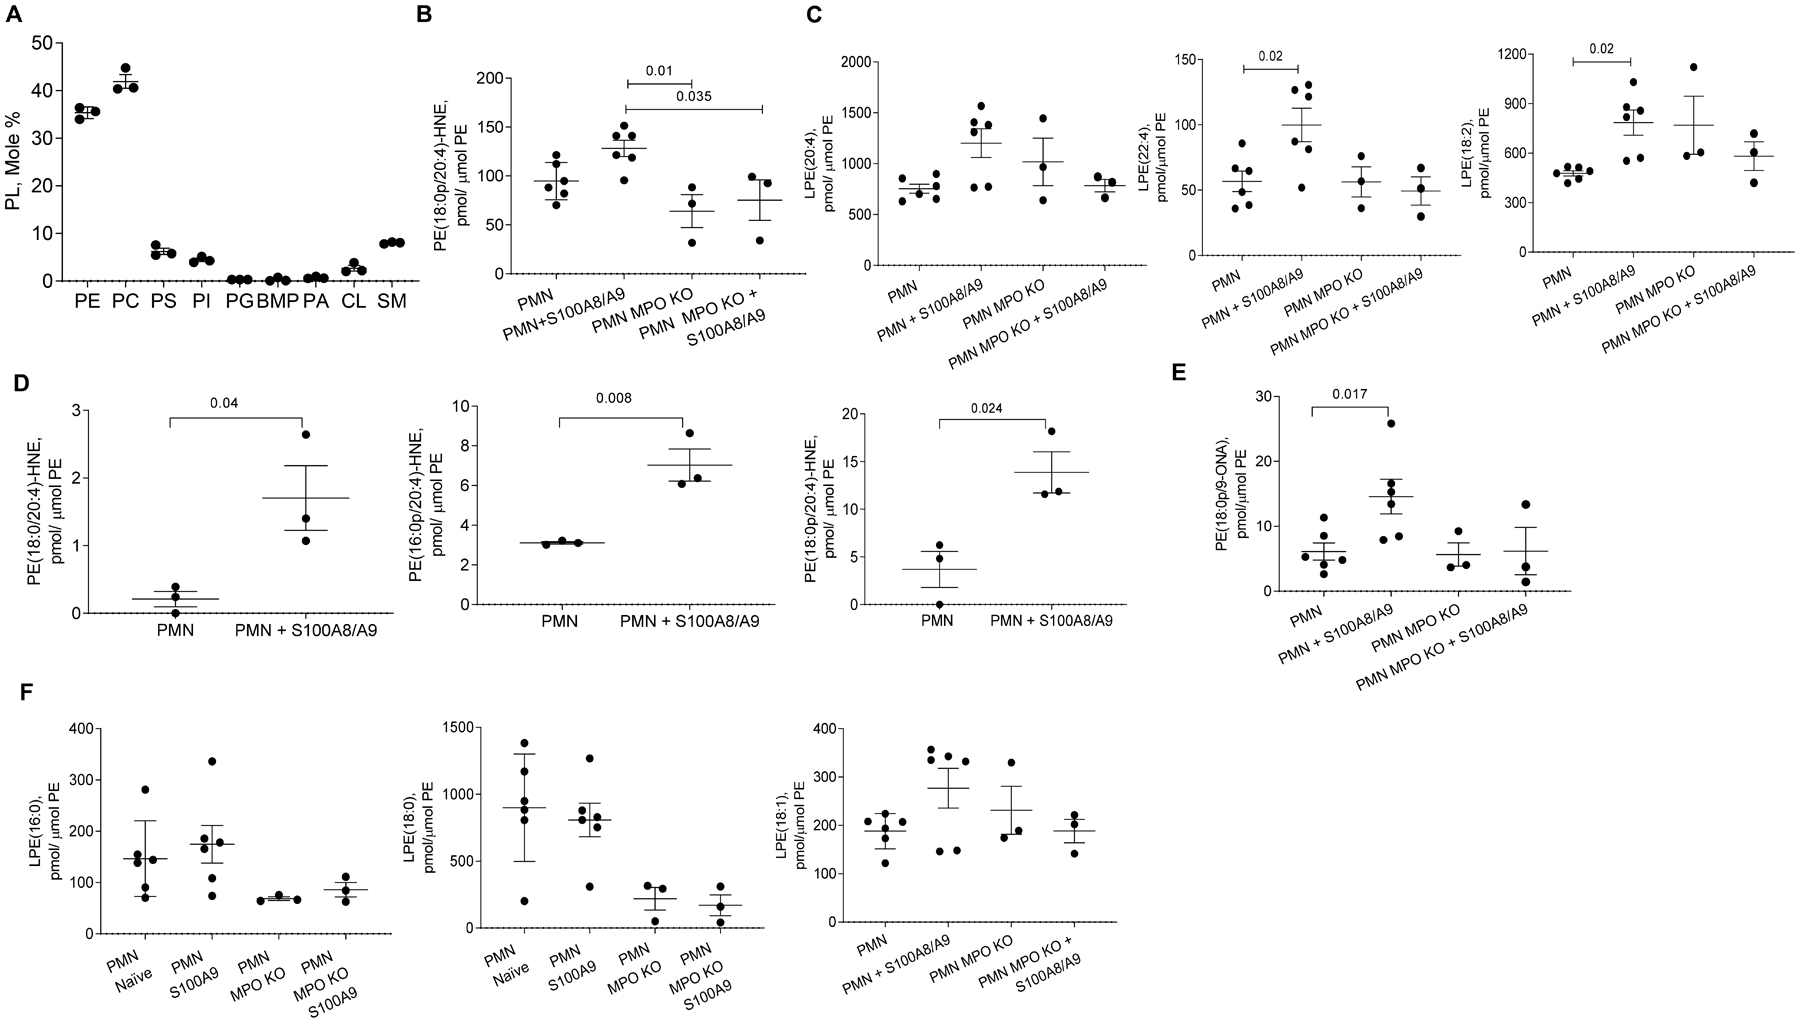
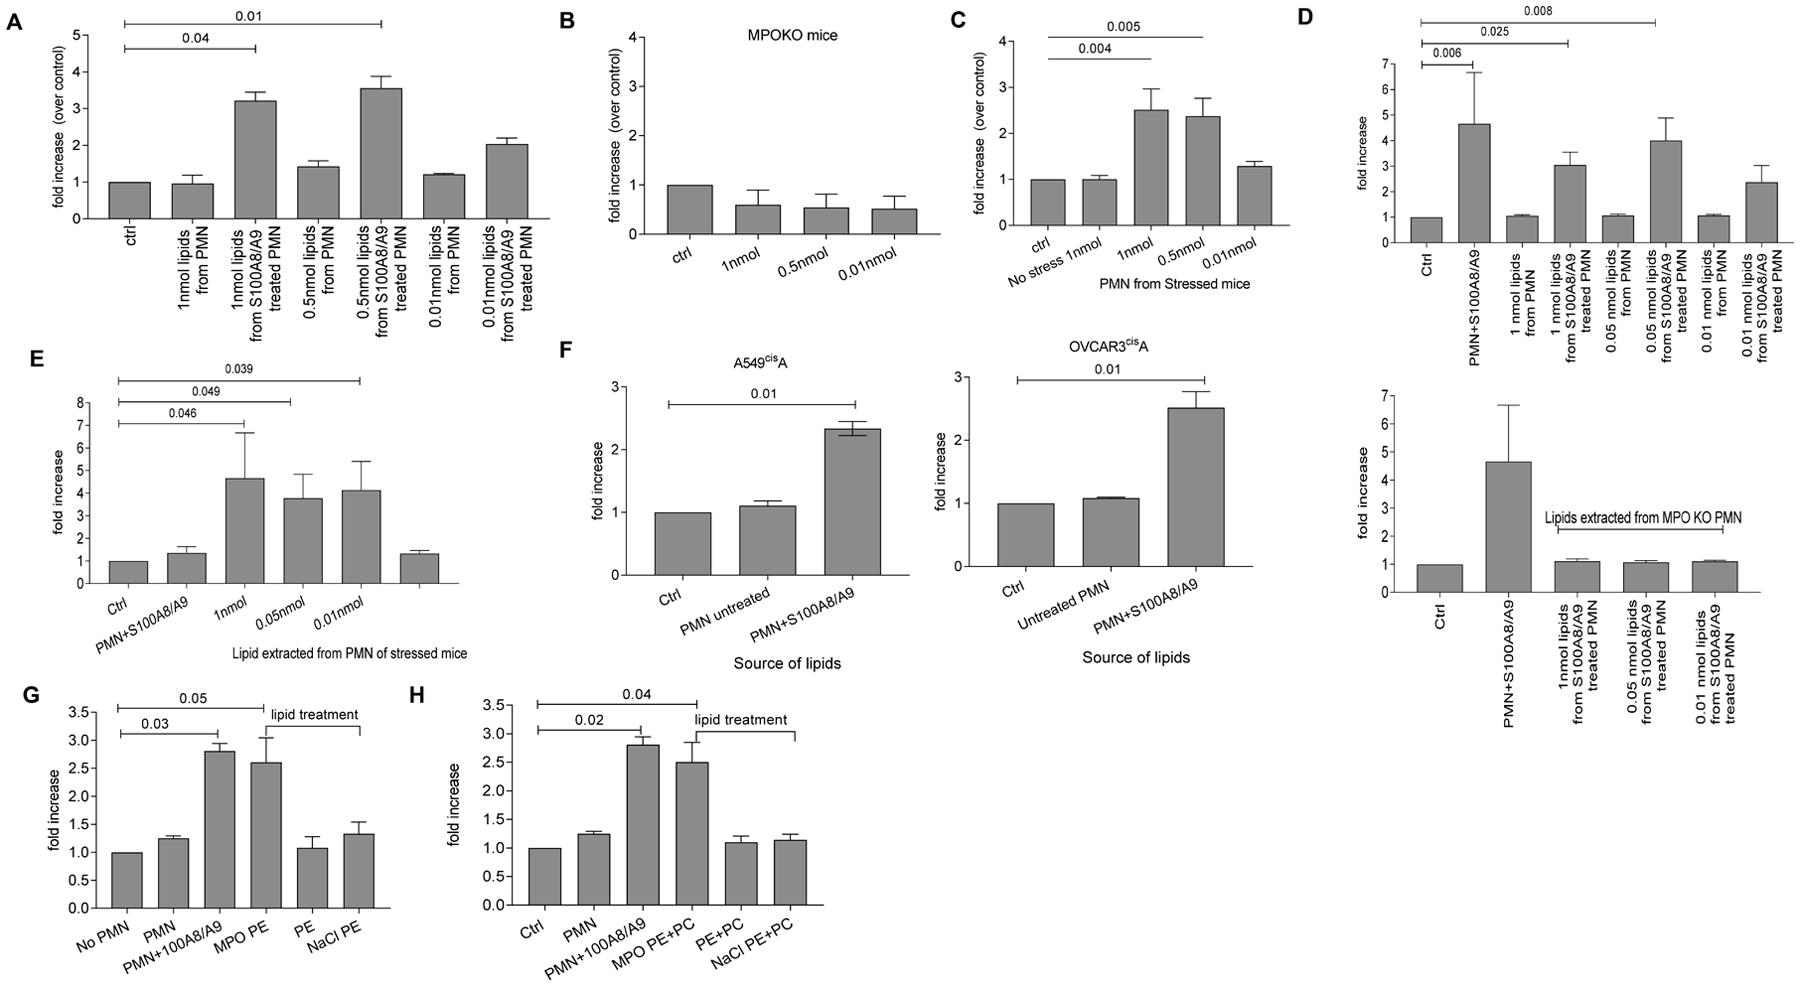
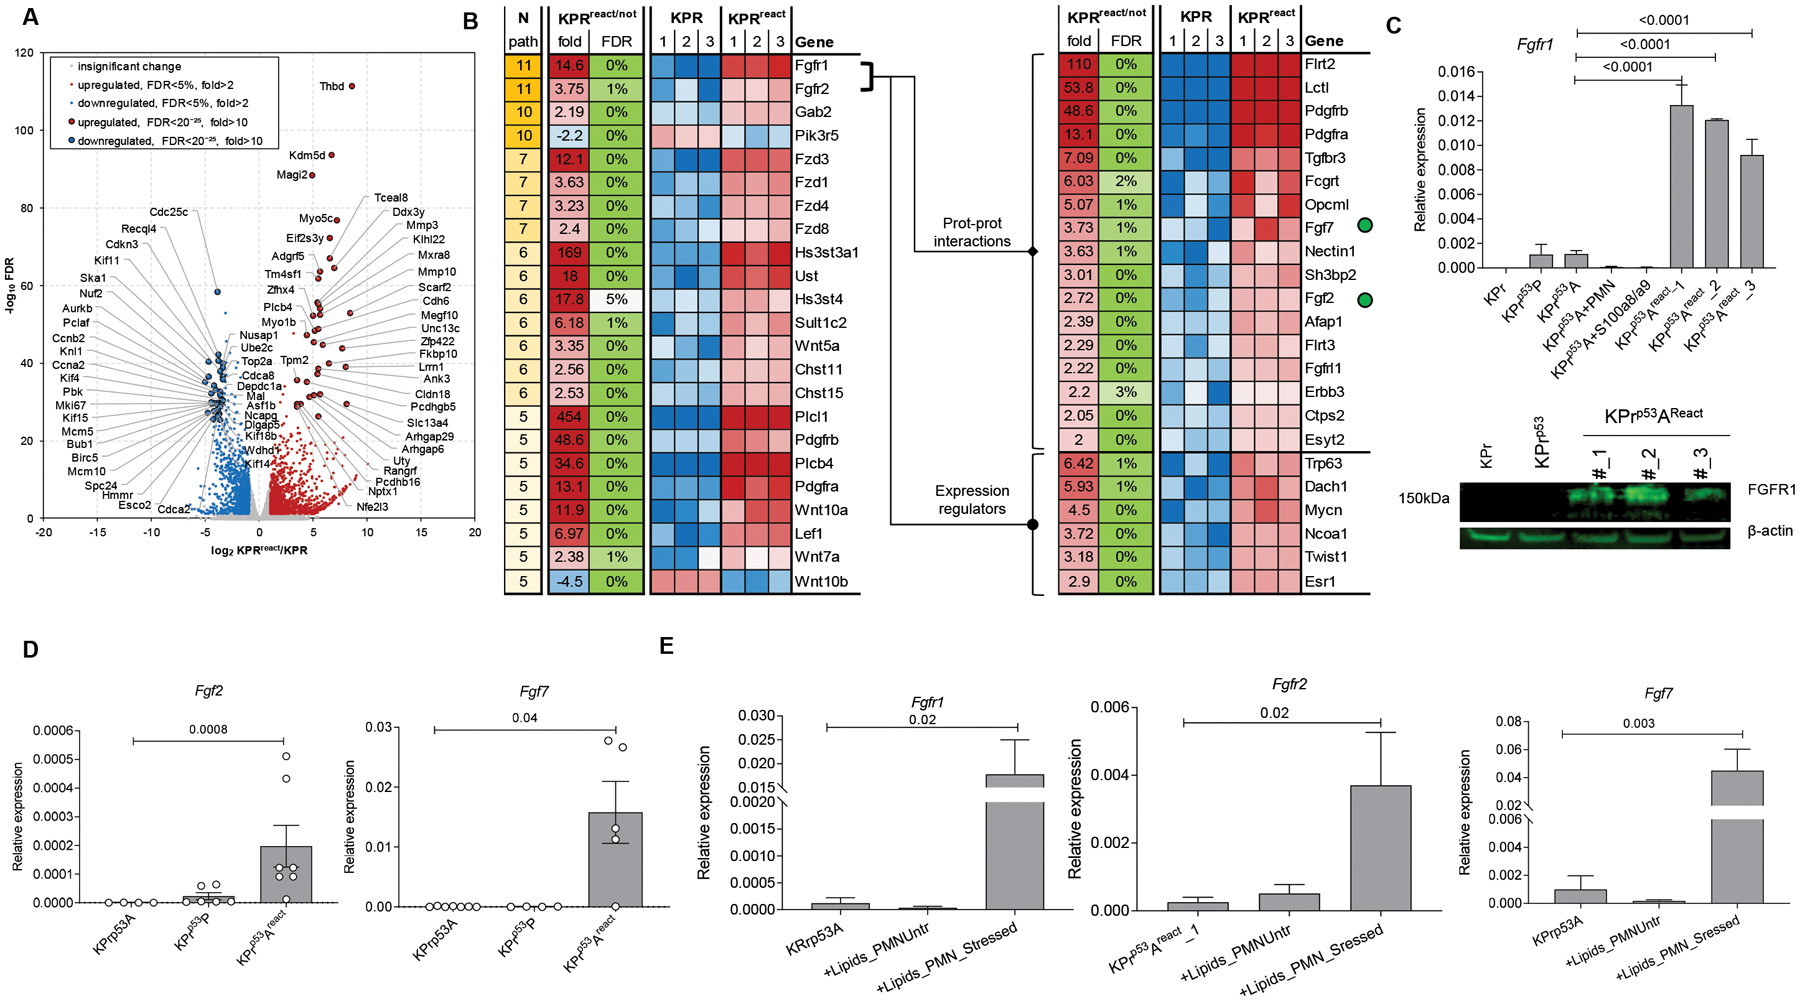
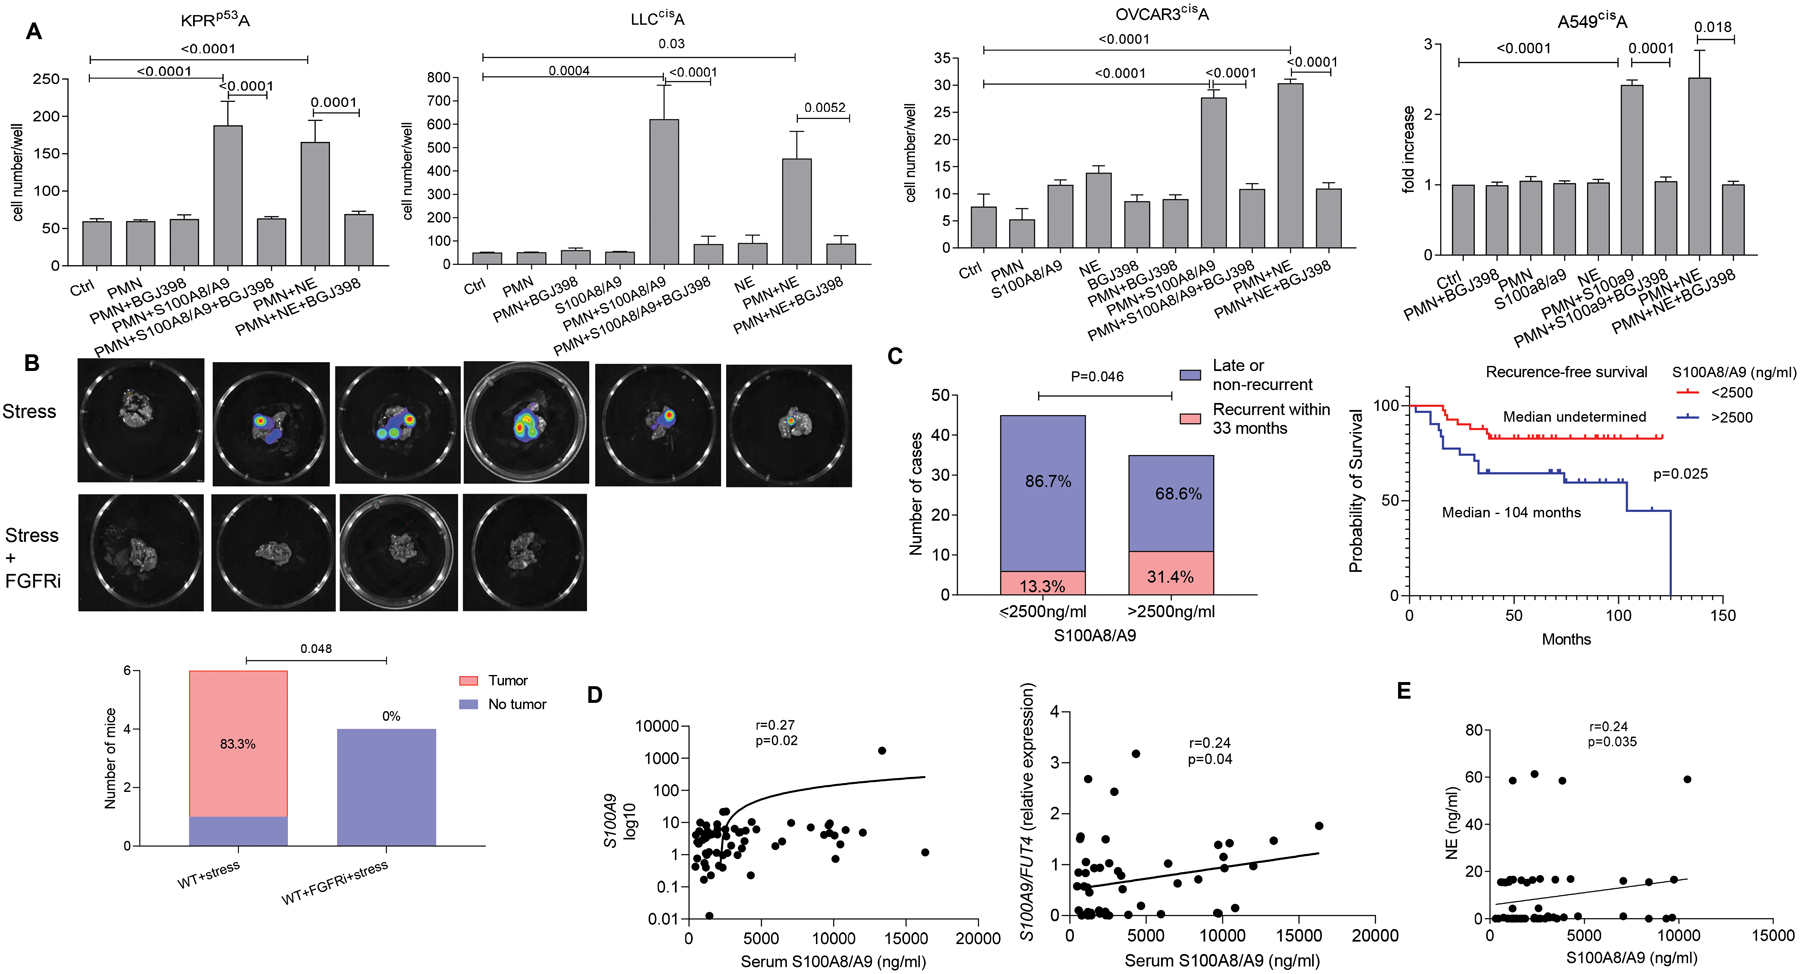
Tumor recurrence years after seemingly successful treatment of primary tumors is one of the major causes of mortality in patients with cancer. Reactivation of dormant tumor cells is largely responsible for this phenomenon. Using dormancy models of lung and ovarian cancer, we found a specific mechanism, mediated by stress and neutrophils, that may govern this process. Stress hormones cause rapid release of proinflammatory S100A8/A9 proteins by neutrophils. S100A8/A9 induce activation of myeloperoxidase, resulting in accumulation of oxidized lipids in these cells. Upon release from neutrophils, these lipids up-regulate the fibroblast growth factor pathway in tumor cells, causing tumor cell exit from the dormancy and formation of new tumor lesions. Higher serum concentrations of S100A8/A9 were associated with shorter time to recurrence in patients with lung cancer after complete tumor resection. Targeting of S100A8/A9 or β2-adrenergic receptors abrogated stress-induced reactivation of dormant tumor cells. These observations demonstrate a mechanism linking stress and specific neutrophil activation with early recurrence in cancer.


Conflict of interest statement

Competing interests:

D.I.G. is employee of AstraZeneca. All other authors declare that they have no competing interests.

Figures

Figure 1.
Figure 1.. Polymorphonuclear myeloid-derived suppressor cells but not neutrophils reactivate dormant tumor cells.
A. Representative image of KPr tumor cells in culture before (left) and after sorting (right). Center panel represents the gating strategy to sort arrested (A) and proliferating (P) cells. Scale bar = 50 μm. B. Example of proliferation measured by luciferase activity in KPr and KPrp53A cells after 5 days of culture. Mean ± SEM are shown, n=3. C. Fold increase in number of KPrp53A cells cultured in the presence of Ly6G+ PMN-MDSC (isolated from LLC tumor-bearing mice) or Ly6G+ PMN (from naïve mice) over KPrp53A cells cultured alone. Data represented as Mean ± SEM. 6 independent experiments with 16 replicates each were performed and one experiment is presented. D. Fold increase in number of KPrp53A cells cultured with indicated cells at 1:10 ratio over KPrp53A cells cultured alone. Data represent Mean ± SEM of 3 independent experiments with 16 replicates each are shown. E. Fold increase in the number of KPrp53A cells cultured at 1:10 ratio with PMN-MDSC isolated from spleens of WT or S100a9KO mice over KPrp53A cells cultured alone. Mean ±SEM of 4 independent experiments with 16 replicates each are shown. C-E. p values were calculated one way ANOVA with correction for multiple comparisons. F. Representative images of β-galactosidase staining in reactivated KPRp53AReact tumor cells. AT-3 cells treated with doxorubicin (20nM) were used as a positive control. G. Flow cytometry analysis of BrdU retention in KPrp53A cells (red) and KPrp53React cells (blue). H. Top panel, schema of the experiment. Bottom panel, representative images of NOD/SCID mice injected intravenously with KPrp53A cells and then with PMN or PMN-MDSC as indicated. Right panel – the number and proportion of mice in each group with detectable tumors. P-values were calculated by Fisher’s exact test.
Figure 2.
Figure 2.. Neutrophil-mediated reactivation of dormant cells is regulated by stressed-induced S100A8/A9.
A. Fold increase in the number of KPrp53A cells cultured in the presence of PMN and S100A8/A9 or indicated cytokines relative to KPrp53A cell cultured with PMN. Three independent experiments with 16 replicates were performed. Mean ± SEM of one experiment is shown. B. Fold increase in the number of KPrp53A cells cultured in the presence of PMN and LPS relative to KPrp53A cells cultured with PMN or alone. Mean ± SEM of 3 independent experiments with 16 replicates each are shown. C. Fold increase in the number of KPrp53A cells cultured in the presence of S100A8/A9 alone, PMN and S100A8/A9, or PMN-MDSC relative to KPrp53A cultured alone. Mean ± SEM of 10 independent experiments with 16 replicates each are shown. D. S100A8/A9 protein produced by PMN after treatment with indicated hormones or LPS was measured by ELISA. PMN-MDSC were isolated from spleens of Lewis Lung Carcinoma tumor-bearing mice. Mean ±SEM and results of each independent experiment with 3 replicates are shown. E. S100A8/A9 protein secreted in vitro from PMN and PMN treated with NE with or without ICI-118;553 as measured by ELISA. Mean ± SEM and results of independent experiment with 3 replicates are shown. F. Flow cytometry staining of ADRB2 receptor (dark gray) on PMN isolated from mouse spleen. Isotype control – light gray. Representative histogram of three experiments is shown. G. Fold increase in the number of KPrp53A cells cultured with PMN alone, NE alone, PMN and NE together, and PMN and NE plus ICI-118;553 relative to KPrp53A cells cultured alone (Ctrl). Ten independent experiments with 16 replicates for each experiment were performed. Mean ± SEM in representative experiment are shown. H. Number of KPrp53A cells cultured in the presence of PMN from S100a9KO mice alone or together with NE relative to KPrp53A cells cultured alone (ctrl). Mean ± SEM are reported for 16 replicates. I. Percentage of live PMN after overnight incubation with NE, S100A8/A9, or LPS. Each dot represents the average of 3 experimental replicates of one single experiments. Mean ±SEM are shown for each group. J. Fold increase in number of LL2CisA cells cultured with PMN alone or together with S100A8/A9 or NE relative to LL2CisA cultured alone (Ctrl). Mean ±SEM of 3 independent experiments with 16 replicates each are shown. K. Fold increase of cell counts of indicated mouse AT-3DoxoA and human A549CisA and OVCARCisA tumor cells cultured with PMN alone or together with S100A8/A9 or NE relative to tumor cells cultured alone (Ctrl). Mean ±SEM of 3 independent experiments with 16 replicates each. In all panels p values were calculated in ANOVA test with correction for multiple comparisons.
Figure 3.
Figure 3.. Systemic stress stimulates S100A8/A9 production from PMN and induces tumor reactivation.
A. Representative images of NOD/SCID mouse lungs and livers after injection of KPrp53A cells and PMN and subjected to stress (left panel) or stress in the presence of ICI-118,551 (right panel). Graph summarizes the number and proportion of mice with detectable tumors. P-values were calculated by Fisher’s exact test. B. Example of images of lungs injected with LL2CisA cells. The number and proportion of C57BL/6 mice with detectable tumors in the lungs are reported after injection of LL2CisA cells and subjected to stress. P values were calculated in Fisher test. C Schema of the experiment with tasquinimod treatment. D. Representative images of C57BL/6 mouse lungs after injection of LL2CisA cells and subjected to stress with or without treatment with tasquinimod. The number and proportion of mice with detectable tumors. P values were calculated in Fisher’s exact test. E. The number and proportion of WT and PAD4 KO mice with tumor lesions in lungs after injection of LL2CisA cells and subjected to stress.
Figure 4.
Figure 4.. Effect of stress on S100A8/A9 release by PMN.
A. Relative expression (to β-actin) of s100a9 gene expression in PMN from stressed or non-stressed mice. Results of individual mice and Mean ±SEM are shown. B. S100A9 protein as measured by flow cytometry in PMN from spleen of stressed and control mice. Left panel, a typical example of staining. Right panel, results of individual mice tested and Mean ± SEM are shown. C. S100A8/A9 protein concentration in plasma of C57BL/6 control or stressed mice as measured by ELISA. Results of individual mice and Mean ±SEM are shown. D. Fold increase in number of KPrp53A cells cultured in the presence of PMN from stressed mice and recombinant S100A8/A9 over KPrp53A cells cultured alone (ctrl). For A-D, p-values were calculated by a two-sided Student’s t-test. E. LL2 tumors were established subcutaneously in WT or S100A9 KO C57BL/6 mice. Tumors were resected when they became palpable, and 7 days later mice were treated with cisplatin (5 mg/kg single dose intravenously.). One week after cisplatin treatment, mice were exposed to stress. The number and proportion of mice with detectable tumors is reported. P values were calculated in Fisher’s exact test. F. MPO enzymatic activity in PMN stimulated with 5 μg/ml of S100A8/A9 or 2 μg/ml LPS. Results of individual mice (n=4 for LPS group; n=7 for two other groups) and Mean ± SEM are shown. G. Fold increase in number of KPrp53A cells cultured in the presence of PMN from MPO KO mice alone or together with S100A8/A9 or NE relative to KPrp53A cells cultured alone (ctrl). Mean ± SEM of 3 independent experiments with 16 replicates for each. H. Fold increase in the number of KPrp53A cells cultured in the presence of PMN and S100A8/A9 or PMN and NE over control (KPrp53A cell cultured with PMN alone) in the presence or absence of MPO inhibitor (4-ABAH) at 2 μM concentration. Mean ± SEM of 3 independent experiments with 16 replicates each are shown. P values were calculated in ANOVA test with correction for multiple comparisons.
Figure 5.
Figure 5.. Effect of S100a9 on PMN lipid content.
A. LC-ESI-MS/MS mass spectrometry of PMN. Results of individual mice (n=3) and Mean ±SEM are shown. B. PE-4-HNE Michael adduct of shown molecular species of PE in mouse WT and MPO KO PMN untreated or treated overnight with S100A8/A9. C. Lyso-PE (LPE) species in mouse PMN treated with S100A8/A9. Mean ± SEM are shown; n=6 in untreated and S100A8/A9-treated PMN groups and n=3 in other groups. D. PE-4-HNE Michael adduct molecular species of different PE in human PMN untreated or treated overnight with human recombinant S100A8/A9. E. Oxidatively truncated PE in WT and MPO KO PMN untreated or treated overnight with S100A8/A9. F. Lyso-PE containing saturated and monoenic acyl chains fatty acids in mouse PMN treated overnight with S100A8/A9 protein. In panels results of individual experiments (n=3–6) and Mean ± SEM are shown. In D p-values were calculated by a two-sided Student’s t-test. In all other panels by ANOVA test with multiple comparison analysis. PE-phosphatidylethanolamine; PC-phosphatidylcholine; PS-phosphatidylserine; PI- phosphatidylinositol; PG-phosphatidylglycerol; BMP-bis(monoacylglycero)phosphate; PA-phosphatidic acid; CL-cardiolipin; SM- sphingomyelin.
Figure 6.
Figure 6.. Lipids from PMN treated with S100A8/A9 reactivate dormant tumor cells.
A. Fold increase in the number of KPrp53A cells cultured with lipids (at the indicated concentrations) extracted from untreated PMN (untr) or PMN treated with S100A8/A9 (S100) relative to KPrp53A cells cultured alone (ctrl). Mean ± SEM results of 3 independent experiments with 16 replicates for each are shown. B. Increase in the number of KPrp53A cells cultured with lipids extracted from MPO KO PMN treated with S100A8/A9 relative to KPrp53A cells alone (ctrl). Mean ±SEM of 3 independent experiments with 16 replicates for each condition are shown. C. Increase in the number of KPRp53A cells cultured with lipids extracted from PMN isolated from control or stressed mice. Mean ±SEM of 3 independent experiments with 16 replicates for each condition are shown. D. Increase in the number of LL2CisA cells cultured with lipids extracted from untreated PMN (untr) or PMN treated with S100A8/A9 (S100) at the indicated concentrations over LL2CisA cells cultured alone (ctrl). Top panel – PMN from wild-type mice, bottom panel – PMN from MPO KO mice. Mean ±SEM of 3 independent experiments with 16 replicates for each are shown. E. Increase in the number of LL2CisA cells cultured with lipids extracted from PMN from stressed C57BL/6 mice relative to the number of LL2CisA cells cultured alone (ctrl). Mean ±SEM of 3 independent experiments with 16 replicates for each. F. Increase in number of human A549cisA or OVCAR3cisA cells treated with lipids extracted from human healthy donor PMN over tumor cells cultured alone (ctrl). Mean ±SEM of 3 independent experiments with 16 replicates for each condition are shown. G. Increase in the number of KPrp53A cells cultured with PE treated with MPO/H2O2/NaCl (MPO PE) over untreated KPrp53A. Untreated (PE) or treated only with NaCl (NaCl PE) were used as control. PMN with S100A8/A9 were used as positive control. Mean ± SEM of 3 independent experiments with 8 replicates for each condition are shown. H. Increase in the number of KPrp53A cells cultured with mixture of PE and PC treated with MPO/H2O2/NaCl over untreated KPrp53A. Mean ±SEM of 3 independent experiments with 8 replicates for each condition are shown. In all experiments p values were calculated using ANOVA test with correction for multiple comparisons.
Figure 7.
Figure 7.. Dormant cells reactivation and FGFR1 signaling in tumor cells.
A. Volcano plot with the log2 and fold changes in gene expression between KPr and KPrp53AReact on the x-axis and the log10 FDR on the y-axis reveals genes with significant changes of expression in KPrp53AReact over KPr cells as measured by RNA sequencing. B. Heat map of gene expression data showing the top pathways that were differentially expressed between KPr and KPrp53AReact (left) and showing the different expression of genes associated to FGFR pathway (right). Fgf2 and Fgf7 are denoted by green dots. C. qRT-PCR of relative Fgfr1 expression (top) and WB of FGFR1 protein (bottom) in KPrp53AReact cells compared to KPr and KPrp53P cells. Three experiments were performed. D. qRT-PCR of Fgfr2 (left) and Fgf7 (right) expression. Mean ± SEM, n=4 in KPr53A group, 6 in KPrp53P group, and 7 in KPrp53Areact group. E. qRT-PCR expression of indicated genes in KPrp53A cells untreated or treated overnight with lipids from PMN from stressed mice. Mean±SEM, n=3. In all panels, p-values were calculated using ANOVA test with correction for multiple comparisons.
Figure 8.
Figure 8.. Functional role of FGF signaling in PMN mediated tumor cell reactivation from dormancy.
A. Number of tumor cells cultured in the presence of PMN and S100A8/A9 with or without BGJ398 FGFR inhibitor relative to tumor cells cultured alone. Mean ±SEM of 3 independent experiments with 16 replicates for each condition are shown. P-values were calculated using ANOVA test with correction for multiple comparisons. B. Representative images of C57BL/6 mouse lungs after injection of LL2CisA cells and subjected to stress with and without treatment with BGJ398. Graph summarizes the number and proportion of mice with detectable tumors. P-values were calculated using Fisher’s exact test. C. Left panel - Proportion of patients with early recurrence of NSCLC among patients grouped based on serum concentrations of S100A8/A9. P-values were calculated using Boschloo’s Test. Right panel – recurrence-free survival of patients grouped based on serum concentration of S100A8/A9. P values were calculated in Log-Rank (Mantel-Cox) test. D. Correlation between serum concentrations of S100A8/A9 and expression of S100A9 or the ratio of S100A9/FUT4 in frozen buffy coat cells (qRT-PCR). E. Correlation between serum concentrations of S100A8/A9 and NE. In D and E Spearman correlation coefficient and one-sided p-values were calculated.

Similar articles

Cited by

References

    1. Gong J, Salgia R, Managing Patients With Relapsed Small-Cell Lung Cancer. J Oncol Pract 14, 359–366 (2018). - PMC - PubMed
    1. Collaud S et al., Long-term outcome after en bloc resection of non-small-cell lung cancer invading the pulmonary sulcus and spine. J Thorac Oncol 8, 1538–1544 (2013). - PubMed
    1. Rhim AD et al., EMT and dissemination precede pancreatic tumor formation. Cell 148, 349–361 (2012). - PMC - PubMed
    1. Perego M et al., A slow-cycling subpopulation of melanoma cells with highly invasive properties. Oncogene 37, 302–312 (2018). - PMC - PubMed
    1. Goss PE, Chambers AF, Does tumour dormancy offer a therapeutic target? Nat Rev Cancer 10, 871–877 (2010). - PubMed

Publication types