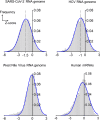
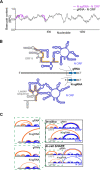
The global and local distribution of RNA structure throughout the SARS-CoV-2 genome
- PMID: 33268519
- PMCID: PMC8092842
- DOI: 10.1128/JVI.02190-20
The global and local distribution of RNA structure throughout the SARS-CoV-2 genome
Abstract
SARS-CoV-2 is the causative viral agent of COVID-19, the disease at the center of the current global pandemic. While knowledge of highly structured regions is integral for mechanistic insights into the viral infection cycle, very little is known about the location and folding stability of functional elements within the massive, ∼30kb SARS-CoV-2 RNA genome. In this study, we analyze the folding stability of this RNA genome relative to the structural landscape of other well-known viral RNAs. We present an in-silico pipeline to predict regions of high base pair content across long genomes and to pinpoint hotspots of well-defined RNA structures, a method that allows for direct comparisons of RNA structural complexity within the several domains in SARS-CoV-2 genome. We report that the SARS-CoV-2 genomic propensity for stable RNA folding is exceptional among RNA viruses, superseding even that of HCV, one of the most structured viral RNAs in nature. Furthermore, our analysis suggests varying levels of RNA structure across genomic functional regions, with accessory and structural ORFs containing the highest structural density in the viral genome. Finally, we take a step further to examine how individual RNA structures formed by these ORFs are affected by the differences in genomic and subgenomic contexts, which given the technical difficulty of experimentally separating cellular mixtures of sgRNA from gRNA, is a unique advantage of our in-silico pipeline. The resulting findings provide a useful roadmap for planning focused empirical studies of SARS-CoV-2 RNA biology, and a preliminary guide for exploring potential SARS-CoV-2 RNA drug targets.Importance The RNA genome of SARS-CoV-2 is among the largest and most complex viral genomes, and yet its RNA structural features remain relatively unexplored. Since RNA elements guide function in most RNA viruses, and they represent potential drug targets, it is essential to chart the architectural features of SARS-CoV-2 and pinpoint regions that merit focused study. Here we show that RNA folding stability of SARS-CoV-2 genome is exceptional among viral genomes and we develop a method to directly compare levels of predicted secondary structure across SARS-CoV-2 domains. Remarkably, we find that coding regions display the highest structural propensity in the genome, forming motifs that differ between the genomic and subgenomic contexts. Our approach provides an attractive strategy to rapidly screen for candidate structured regions based on base pairing potential and provides a readily interpretable roadmap to guide functional studies of RNA viruses and other pharmacologically relevant RNA transcripts.
Copyright © 2020 Tavares et al.
Figures


Similar articles
-
Comprehensive in-vivo secondary structure of the SARS-CoV-2 genome reveals novel regulatory motifs and mechanisms.bioRxiv [Preprint]. 2020 Jul 10:2020.07.10.197079. doi: 10.1101/2020.07.10.197079. bioRxiv. 2020. Update in: Mol Cell. 2021 Feb 4;81(3):584-598.e5. doi: 10.1016/j.molcel.2020.12.041. PMID: 32676598 Free PMC article. Updated. Preprint.
-
Comprehensive in vivo secondary structure of the SARS-CoV-2 genome reveals novel regulatory motifs and mechanisms.Mol Cell. 2021 Feb 4;81(3):584-598.e5. doi: 10.1016/j.molcel.2020.12.041. Epub 2021 Jan 1. Mol Cell. 2021. PMID: 33444546 Free PMC article.
-
Secondary Structure of Subgenomic RNA M of SARS-CoV-2.Viruses. 2022 Feb 4;14(2):322. doi: 10.3390/v14020322. Viruses. 2022. PMID: 35215915 Free PMC article.
-
SARS-CoV-2: from its discovery to genome structure, transcription, and replication.Cell Biosci. 2021 Jul 19;11(1):136. doi: 10.1186/s13578-021-00643-z. Cell Biosci. 2021. PMID: 34281608 Free PMC article. Review.
-
Current status of antivirals and druggable targets of SARS CoV-2 and other human pathogenic coronaviruses.Drug Resist Updat. 2020 Dec;53:100721. doi: 10.1016/j.drup.2020.100721. Epub 2020 Aug 26. Drug Resist Updat. 2020. PMID: 33132205 Free PMC article. Review.
Cited by
-
Alterations in the nasopharyngeal microbiome associated with SARS-CoV-2 infection status and disease severity.PLoS One. 2022 Oct 14;17(10):e0275815. doi: 10.1371/journal.pone.0275815. eCollection 2022. PLoS One. 2022. PMID: 36240246 Free PMC article.
-
Prediction of two novel overlapping ORFs in the genome of SARS-CoV-2.Virology. 2021 Oct;562:149-157. doi: 10.1016/j.virol.2021.07.011. Epub 2021 Jul 28. Virology. 2021. PMID: 34339929 Free PMC article.
-
Neurological Involvement in COVID-19 and Potential Mechanisms: A Review.Neurocrit Care. 2021 Jun;34(3):1062-1071. doi: 10.1007/s12028-020-01049-4. Neurocrit Care. 2021. PMID: 32661794 Free PMC article. Review.
-
Evaluation of Antibacterial and Antiviral Drug Effectiveness in COVID-19 Therapy: A Data-Driven Retrospective Approach.Pathophysiology. 2022 Mar 7;29(1):92-105. doi: 10.3390/pathophysiology29010009. Pathophysiology. 2022. PMID: 35366292 Free PMC article.
-
Structural impact of synonymous mutations in six SARS-CoV-2 Variants of Concern.PLoS One. 2025 Jul 1;20(7):e0325858. doi: 10.1371/journal.pone.0325858. eCollection 2025. PLoS One. 2025. PMID: 40591691 Free PMC article.
References
-
- Wu F, Zhao S, Yu B, Chen YM, Wang W, Song ZG, Hu Y, Tao ZW, Tian JH, Pei YY, Yuan ML, Zhang YL, Dai FH, Liu Y, Wang QM, Zheng JJ, Xu L, Holmes EC, Zhang YZ. 2020. A new coronavirus associated with human respiratory disease in China. Nature 579:265–269. doi:10.1038/s41586-020-2008-3. - DOI - PMC - PubMed
Grants and funding
LinkOut - more resources
Full Text Sources
Other Literature Sources
Miscellaneous

