. 2021 Mar 1;95(5):e01027-20.
doi: 10.1128/JVI.01027-20. Epub 2020 Dec 2.

Matrix Protein 2 Extracellular Domain-Specific Monoclonal Antibodies Are an Effective and Potentially Universal Treatment for Influenza A

Affiliations

Matrix Protein 2 Extracellular Domain-Specific Monoclonal Antibodies Are an Effective and Potentially Universal Treatment for Influenza A

Lynn Bimler et al. J Virol. .

Erratum in

Abstract

Influenza virus infection causes significant morbidity and mortality worldwide. Humans fail to make a universally protective memory immune response to influenza A. Hemagglutinin and Neuraminidase undergo antigenic drift and shift, resulting in new influenza A strains to which humans are naive. Seasonal vaccines are often ineffective and escape mutants have been reported to all treatments for influenza A. In the absence of a universal influenza A vaccine or treatment, influenza A will remain a significant threat to human health. The extracellular domain of the M2-ion channel (M2e) is an ideal antigenic target for a universal therapeutic agent, as it is highly conserved across influenza A serotypes, has a low mutation rate, and is essential for viral entry and replication. Previous M2e-specific monoclonal antibodies (M2e-MAbs) show protective potential against influenza A, however, they are either strain specific or have limited efficacy. We generated seven murine M2e-MAbs and utilized in vitro and in vivo assays to validate the specificity of our novel M2e-MAbs and to explore the universality of their protective potential. Our data shows our M2e-MAbs bind to M2e peptide, HEK cells expressing the M2 channel, as well as, influenza virions and MDCK-ATL cells infected with influenza viruses of multiple serotypes. Our antibodies significantly protect highly influenza A virus susceptible BALB/c mice from lethal challenge with H1N1 A/PR/8/34, pH1N1 A/CA/07/2009, H5N1 A/Vietnam/1203/2004, and H7N9 A/Anhui/1/2013 by improving survival rates and weight loss. Based on these results, at least four of our seven M2e-MAbs show strong potential as universal influenza A treatments.IMPORTANCE Despite a seasonal vaccine and multiple therapeutic treatments, Influenza A remains a significant threat to human health. The biggest obstacle is producing a vaccine or treatment for influenza A is their universality or efficacy against not only seasonal variances in the influenza virus, but also against all human, avian, and swine serotypes and, therefore, potential pandemic strains. M2e has huge potential as a target for a vaccine or treatment against influenza A. It is the most conserved external protein on the virus. Antibodies against M2e have made it to clinical trials, but not succeeded. Here, we describe novel M2e antibodies produced in mice that are not only protective at low doses, but that we extensively test to determine their universality and found to be cross protective against all strains tested. Additionally, our work begins to elucidate the critical role of isotype for an influenza A monoclonal antibody therapeutic.


Figures

FIG 1
FIG 1
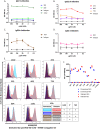
The production of monoclonal antibodies. (A) Diagram containing all time points for vaccination and spleen harvest for hybridoma production. (B) M2e peptide was used as the coating antigen for ELISAs. Serum from specified mice and time point was added. Positive-control mouse serum was taken 21 days postvaccination, and negative-control serum is from a naive BALB/c mouse. M2e-specific titer was detected by a total IgG or subclass-specific secondary antibody. OD490, optical density at 490 nm. n = 18 to 19; two-way ANOVA with Dunnett’s multiple-comparison test.
FIG 2
FIG 2
Seven generated monoclonal antibodies are M2e specific. (A to D) Coating antigen for ELISAs was the vaccine sequence M2e peptide. Antibodies were added at specified concentrations. M2e-specific binding was detected by a total IgG secondary antibody. OD490, optical density at490 nm. n = 1 to 3 (seven 14C2 wells were beyond detection). (E and F) M2 expression was induced in 293 cells with tetracycline. 14C2 or the indicated MAb clone binding was confirmed by flow cytometry detecting secondary staining with Alexa Fluor 488-conjugated goat anti-mouse IgG antibody. Binding of M2e-MAb to M2-expressing 293 cells graphed as population histograms (E) or mean fluorescent intensity (MFI) of AF488 (F). Sequence of M2 is specified in the figure legend (consensus or Vietnam).
FIG 3
FIG 3
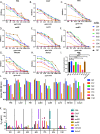
M2e-MAbs bind to influenza A-infected cells. (A to H) MDCK-ATL cells, infected with the indicated virus at an MOI of 0.5 for 12 hours, were used as the coating antigen for ELISAs, and the indicated MAb clone was tested for virion reactivity. MAb H16-L10, specific for theinternal nucleoprotein (NP), was used as a control demonstrating cells were intact and not permeabilized. Background staining of uninfected MDCK-ATL cells was subtracted. OD450, optical density at 450 nm. (I and J) Bmax and Kd values were calculated in GraphPad Prism 7.02 using a nonlinear best fit regression for one-site specific binding.
FIG 4
FIG 4
M2e-MAbs bind to influenza virions. (A to H) Specified influenza A virions were used as the coating antigen for ELISAs, and the indicated MAb clone was tested for virion reactivity. MAb H16-L10 was used as a control demonstrating virions were intact. Background was subtracted.OD450; optical density at 450 nm. (I) Plaque assay with PR8 using virus preincubated with 25/ml of specified M2e-MAb or adamantane. n = 3, one-way ANOVA with Dunnett’s multiple-comparison test. (J and K) Bmax and Kd values were calculated in GraphPad Prism 7.02 using a nonlinear best fit regression for one-site specific binding.
FIG 5
FIG 5
M2e-MAbs protect from lethal PR8 challenge. (A to G) BALB/c mice were passively immunized with indicated dose of M2e-MAb clone 1 day prior to infection with 5× LD50 H1N1 A/PR/8/34. n is indicated for each graph. Experiments wereperformed at BCM, and endpoint was considered weight loss cut off at 30%. ****, P < 0.0001; ***, P < 0.001; **, P < 0.01; *, P < 0.05; log-rank analysis. *, indicates significance compared with PBS control; #, indicates significance compared with isotype control. Percent weight loss data for survival analysis are shown to the right of each graph. Weight loss was analyzed by a 2-way ANOVA with a Dunnett’s multiple-comparison test to compare weights between groups on individual days. Heatmap below each weight loss curve is indicative of significantly different weight loss from control group. ****, P < 0.0001; ***, P < 0.001; **, P < 0.01; *, P < 0.05; log-rank analysis. *, indicates significance compared with PBS control, unless all PBS controls died in which case treatment groups were compared with isotype control. Black indicates a group is no longer included in comparisons; either all mice in that group were dead at time point of comparison (B) or in the case of the isotype control, if all PBS animals have died, this became the control group (A, E, F, and G). Results for curve mean comparisons of days 0 to 14 postinfection by a 2-way ANOVA with a Dunnett’s comparison are shown to the left of the heatmap; *, indicates significance compared with PBS control; and #, indicates significance compared with isotype controls with (L) or if necessary to indicate low or high isotype control dose (H). If entire control group died before day 14, the comparison includes only days with weights for the control group.
FIG 6
FIG 6
M2e-MAbs protect from lethal influenza A infection. (A to G) BALB/c mice were passively immunized with indicated dose of M2e-MAb clone 1 day prior to infection with CA07 (A and B), VN1203 (C to E), or Anhui1 (F and G). Experiments performed at UGA were monitoredhumane endpoints based on comprehensive point system evaluating weight and clinical signs. (A, B, D, E, F, and G) n = 10. (C and H) n = 5. ****, P < 0.0001; ***, P < 0.001; **, P < 0.01; *, P < 0.05; log-rank analysis. *, indicates significance compared with PBS control; #, indicates significance compared with isotype control. Percent weight loss data for survival analysis are shown to the right of each graph. Weight loss was analyzed by a 2-way ANOVA with a Dunnett’s multiple-comparison test to compare weights between groups on individual days. Heatmap below each subfigure is indicative of significantly different weight loss from control group. ****, P < 0.0001; ***, P < 0.001; **, P < 0.01; *, P < 0.05; log-rank analysis. *, indicates significance compared with PBS control, unless all PBS controls died in which case treatment groups were compared with isotype control (indicated by black squares; C, D, F, and G). Results for curve mean comparisons of days 0 to 14 postinfection by a 2-way ANOVA with a Dunnett’s comparison are shown to the left of the heatmap; *, indicates significance compared with PBS controls; #, indicates significance compared with isotype controls. If entire control group died before day 14, comparison only includes days with weights for control group.
FIG 7
FIG 7
M2e-MAbs viral titers at day 3 after lethal influenza A infection. (A to C) BALB/c mice were passively immunized with indicated dose of M2e-MAb clone 1 day prior to infection with CA07 (A), VN1203 (B), or Anhui1 (C). Lungs for viral titers were removed on 3 dpi. Viral titers were determined through a TCID50. **, P < 0.01; *, P < 0.05; log-rank analysis.
FIG 8
FIG 8
Cross-protective analysis of M2e-MAb protection from lethal influenza A infection. (A to G) BALB/c mice were passively immunized with the indicated dose of M2e-MAb clone 1 day prior to infection with 5× LD50 H1N1 A/PR/8/34, 10× LD50 CA07,10× LD50 VN1203, or 10× LD50 Anhui1. Each graph represents the combined data from Fig. 5 and 6, as well as additional experiments divided by antibody. The number of experiments included in each data set and the R squared values of each line of best fit are included in Table 2. PBS groups were considered the baseline 0-µg dose for both treatment and isotype groups within the same experiment. All experiments, n = 8 to 10. H1N1 A/PR/8/34 experiments performed at BCM, and endpoint was considered weight loss cut off of 30%. A/CA/07/2009, VN1203, and Anhui1 experiments performed at UGA monitored humane endpoints based on comprehensive point system evaluating clinical signs and weight loss. Trend lines were determined analyzed by both linear and nonlinear regression and the appropriate trendline, and the most appropriate trend line was determined by the R squared value. If only data points were 100% survival, the line connecting data points is displayed rather than a nonlinear curve with an R2 of 1. If R squared value is below 0.4, average means were connected by a line. (H and I) Heatmap created using the absorbance of each antibody at 100 μg/ml when binding to infected cells (H) or virions (I) via ELISA for comparison between antibodies. Raw data are in Fig. 3 and 4.

Similar articles

Cited by

References

    1. Sridhar S, Brokstad KA, Cox RJ. 2015. Influenza vaccination strategies: comparing inactivated and live attenuated influenza vaccines. Vaccines (Basel) 3:373–389. doi:10.3390/vaccines3020373. - DOI - PMC - PubMed
    1. Taubenberger JK, Morens DM. 2008. The pathology of influenza virus infections. Annu Rev Pathol 3:499–522. doi:10.1146/annurev.pathmechdis.3.121806.154316. - DOI - PMC - PubMed
    1. Webster RG, Govorkova EA. 2014. Continuing challenges in influenza. Ann N Y Acad Sci 1323:115–139. doi:10.1111/nyas.12462. - DOI - PMC - PubMed
    1. Doherty PC, Turner SJ, Webby RG, Thomas PG. 2006. Influenza and the challenge for immunology. Nat Immunol 7:449–455. doi:10.1038/ni1343. - DOI - PubMed
    1. Hamilton BS, Whittaker GR, Daniel S. 2012. Influenza virus-mediated membrane fusion: determinants of hemagglutinin fusogenic activity and experimental approaches for assessing virus fusion. Viruses 4:1144–1168. doi:10.3390/v4071144. - DOI - PMC - PubMed

LinkOut - more resources