. 2021 Feb 3;41(5):991-1004.
doi: 10.1523/JNEUROSCI.2455-20.2020. Epub 2020 Dec 2.

Mossy Cells in the Dorsal and Ventral Dentate Gyrus Differ in Their Patterns of Axonal Projections

Affiliations

Mossy Cells in the Dorsal and Ventral Dentate Gyrus Differ in Their Patterns of Axonal Projections

Carolyn R Houser et al. J Neurosci. .

Abstract

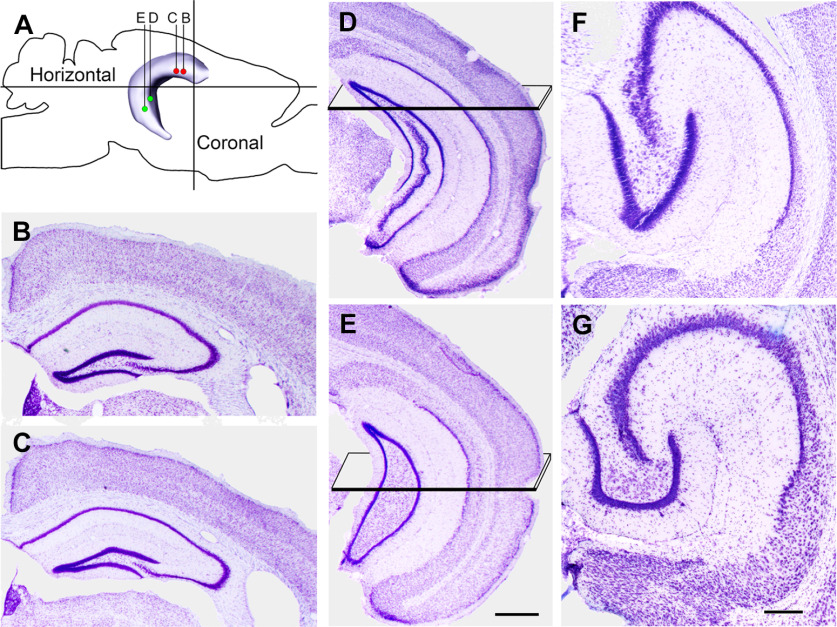
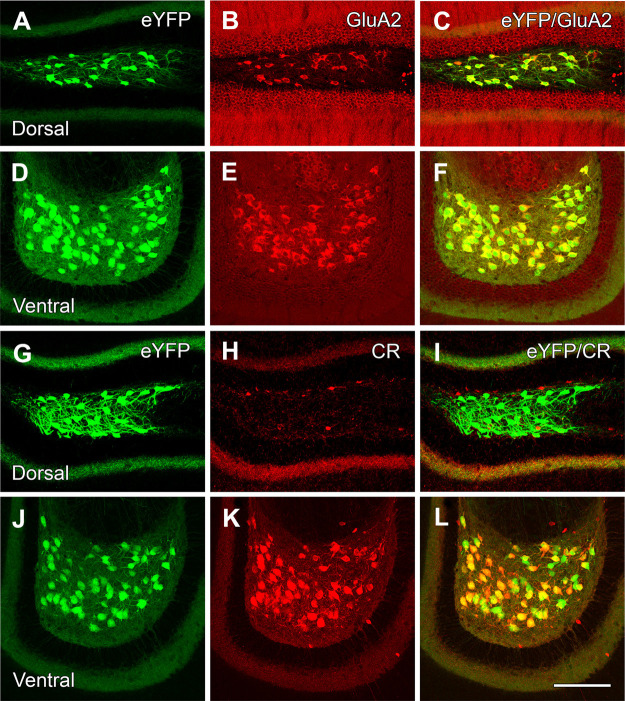
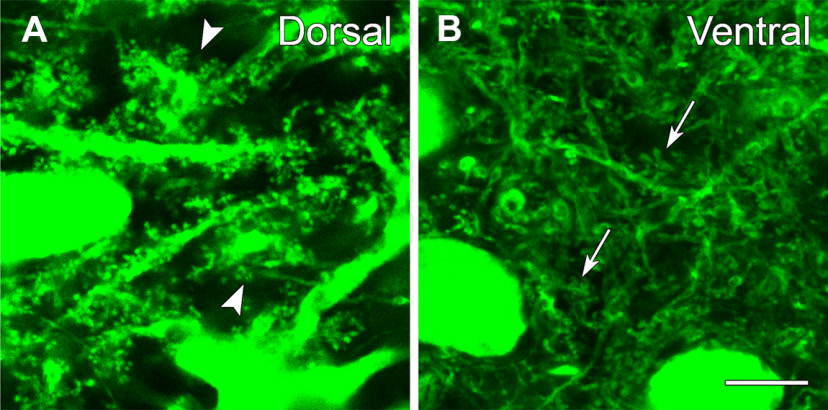
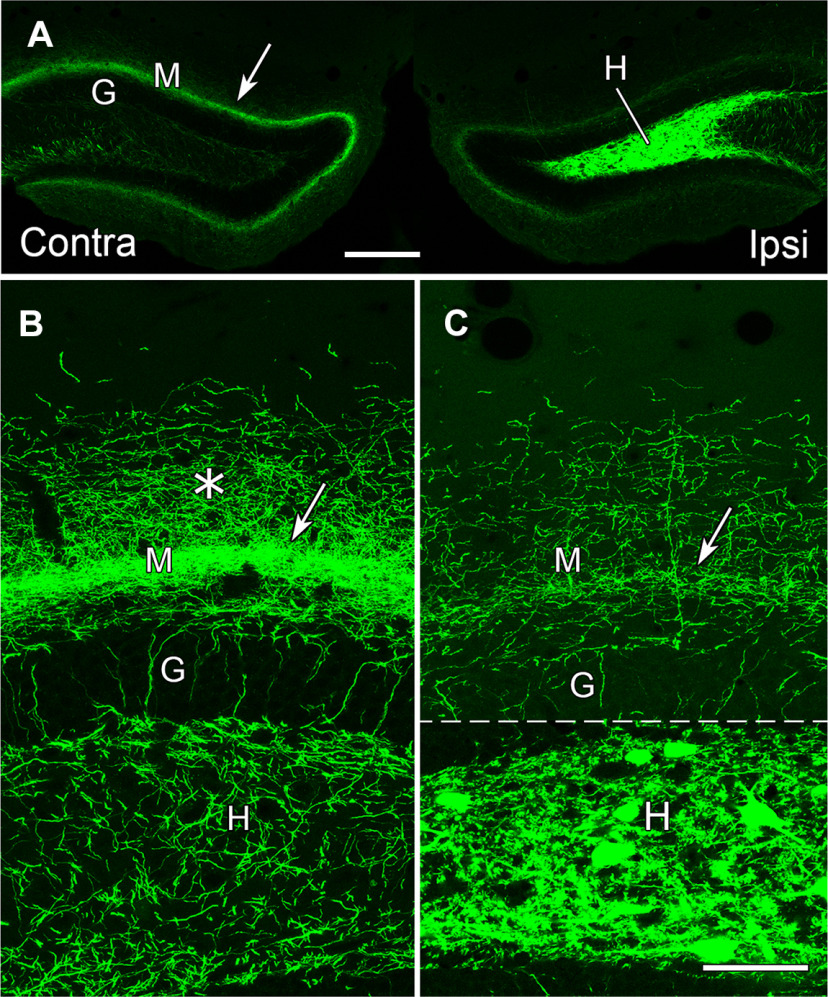
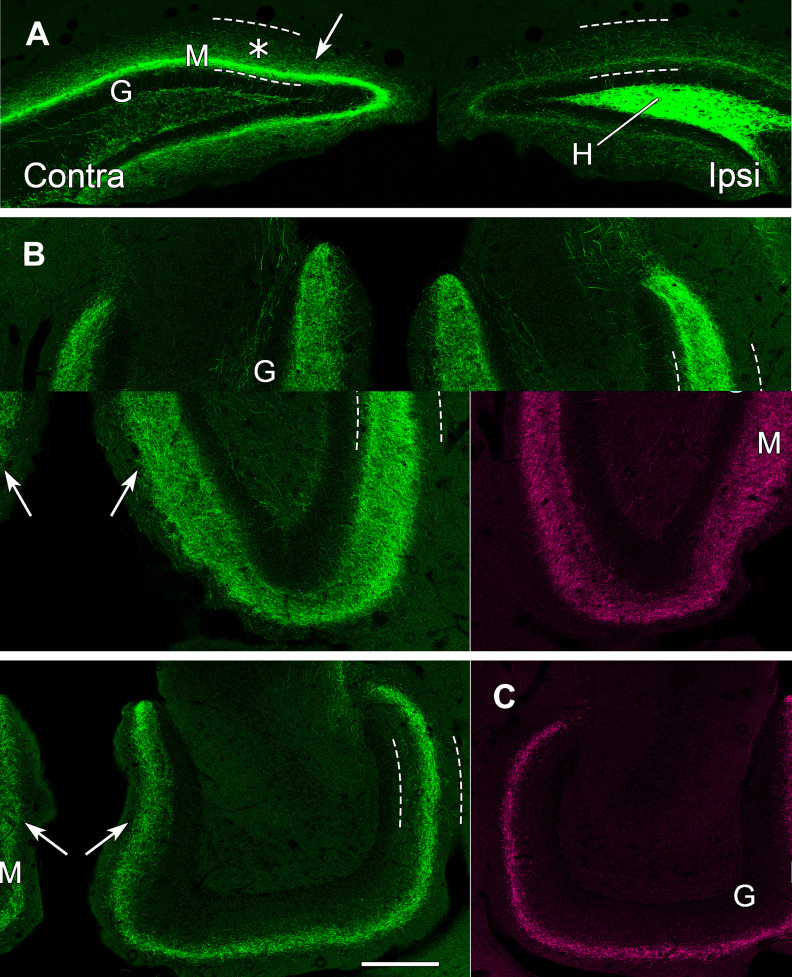
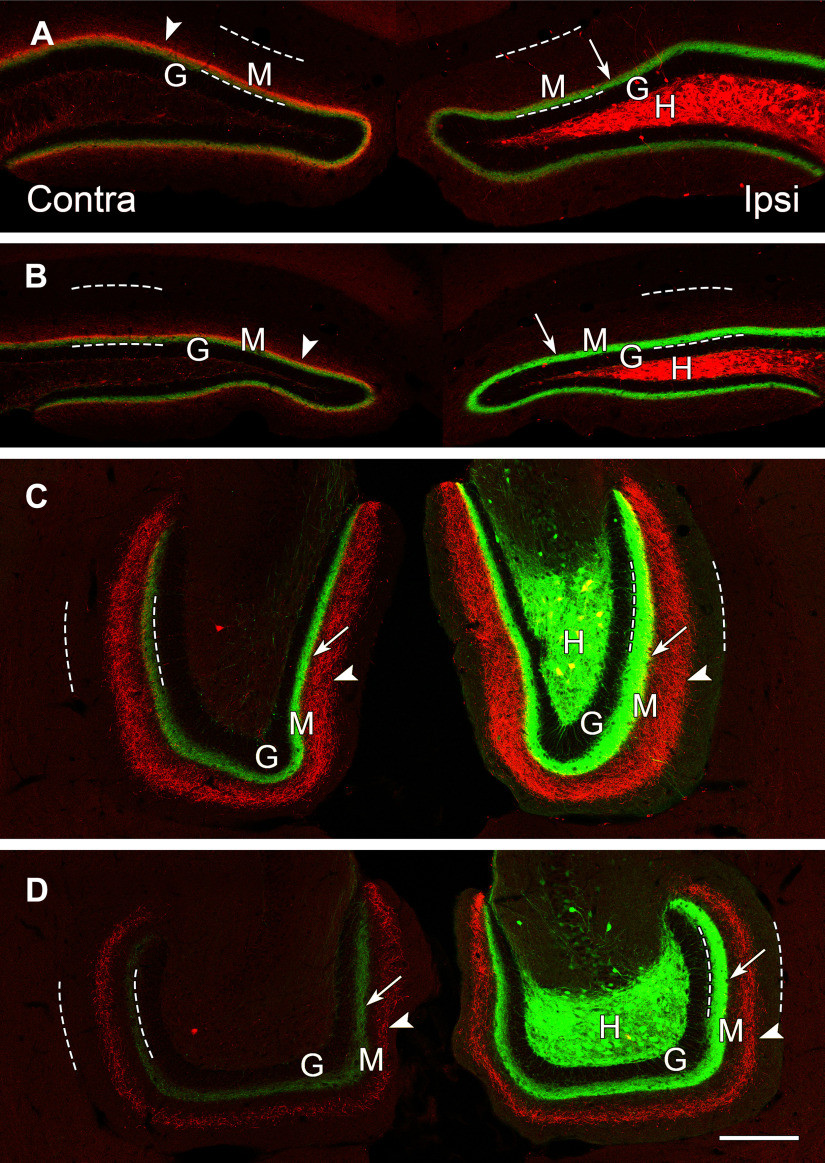
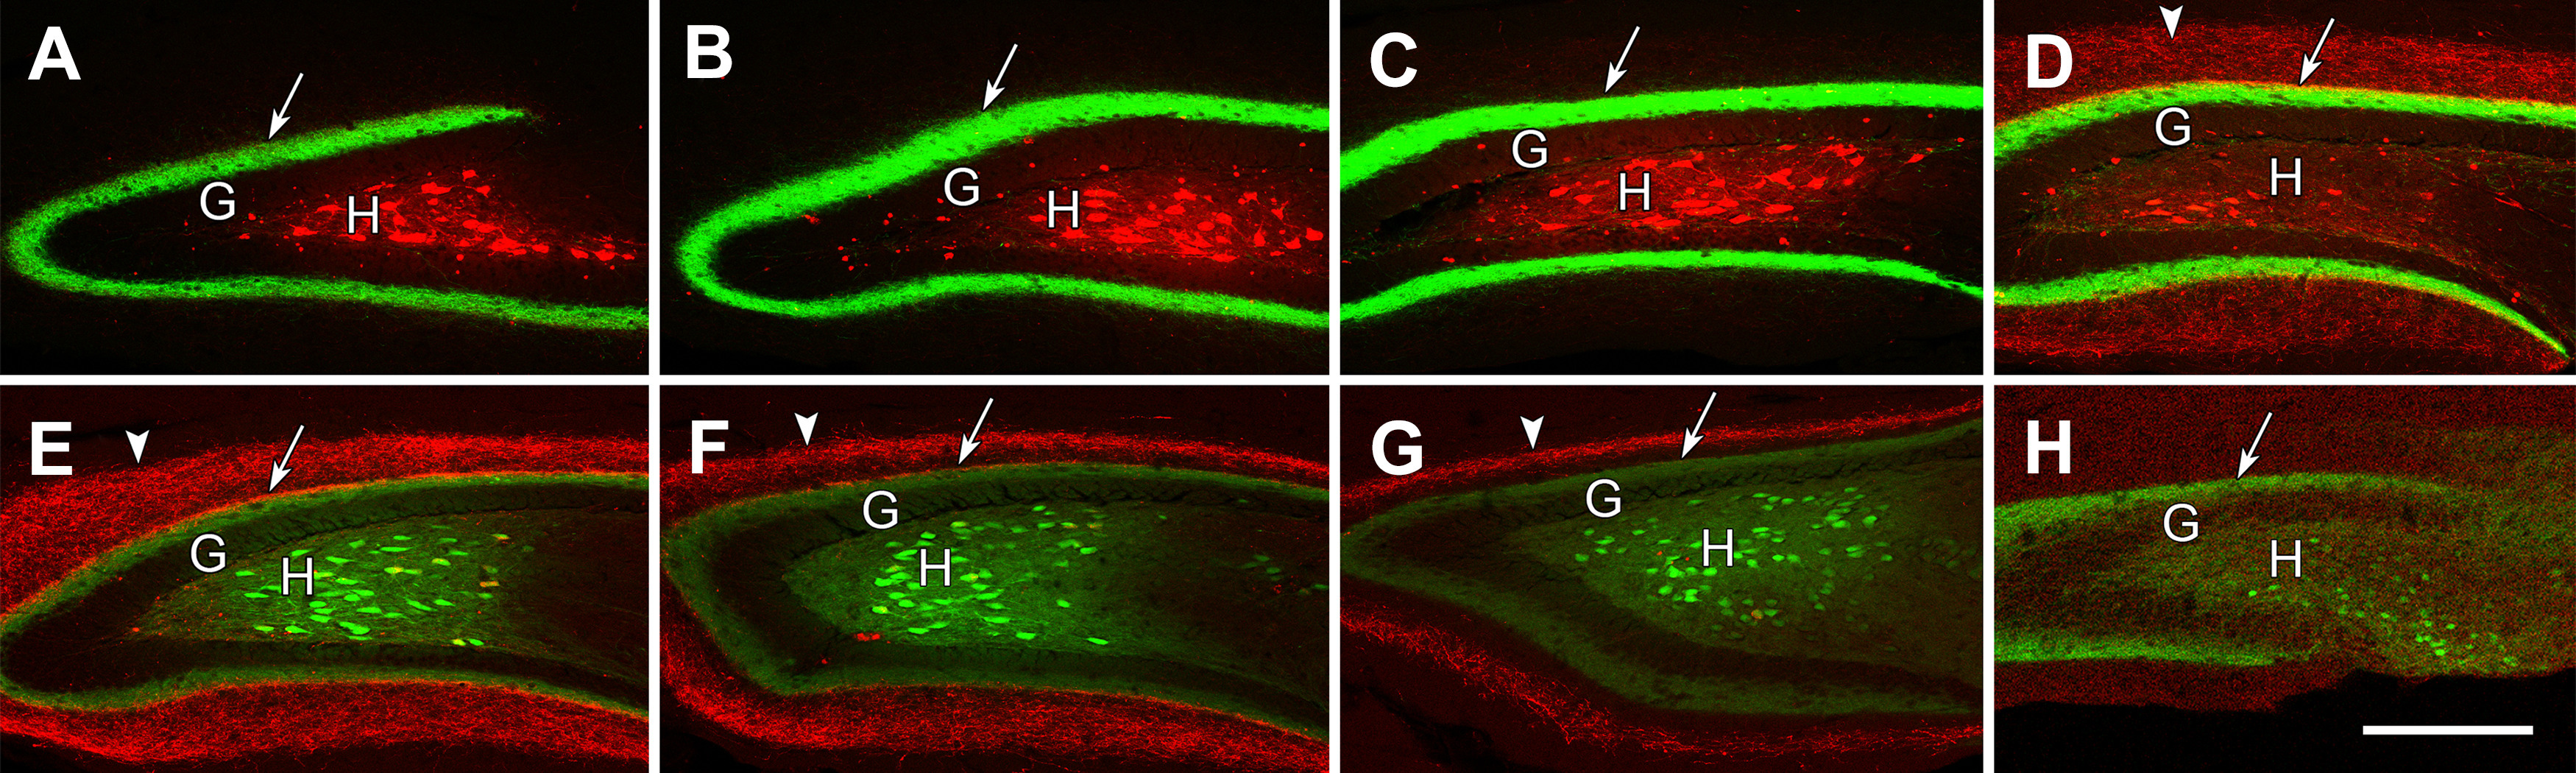
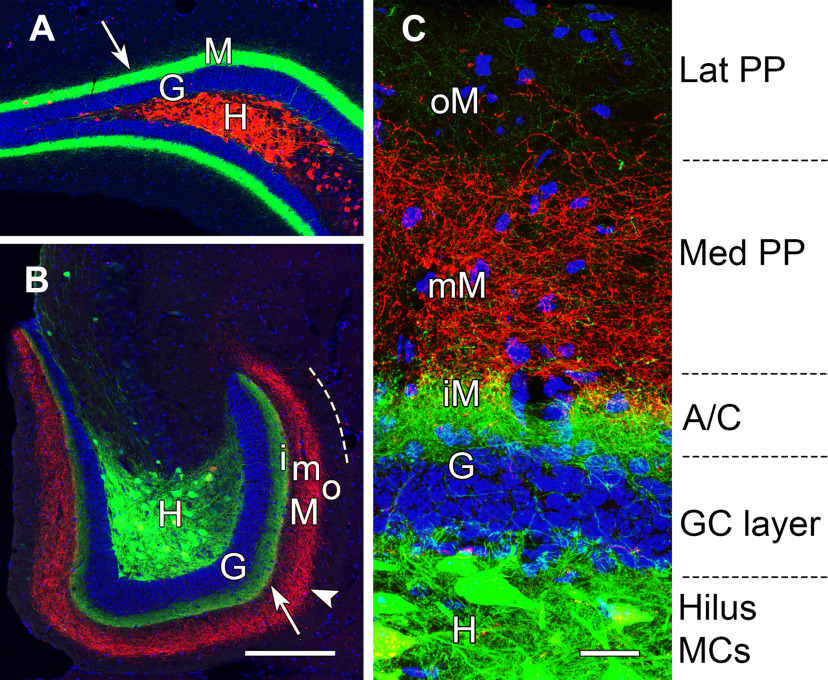
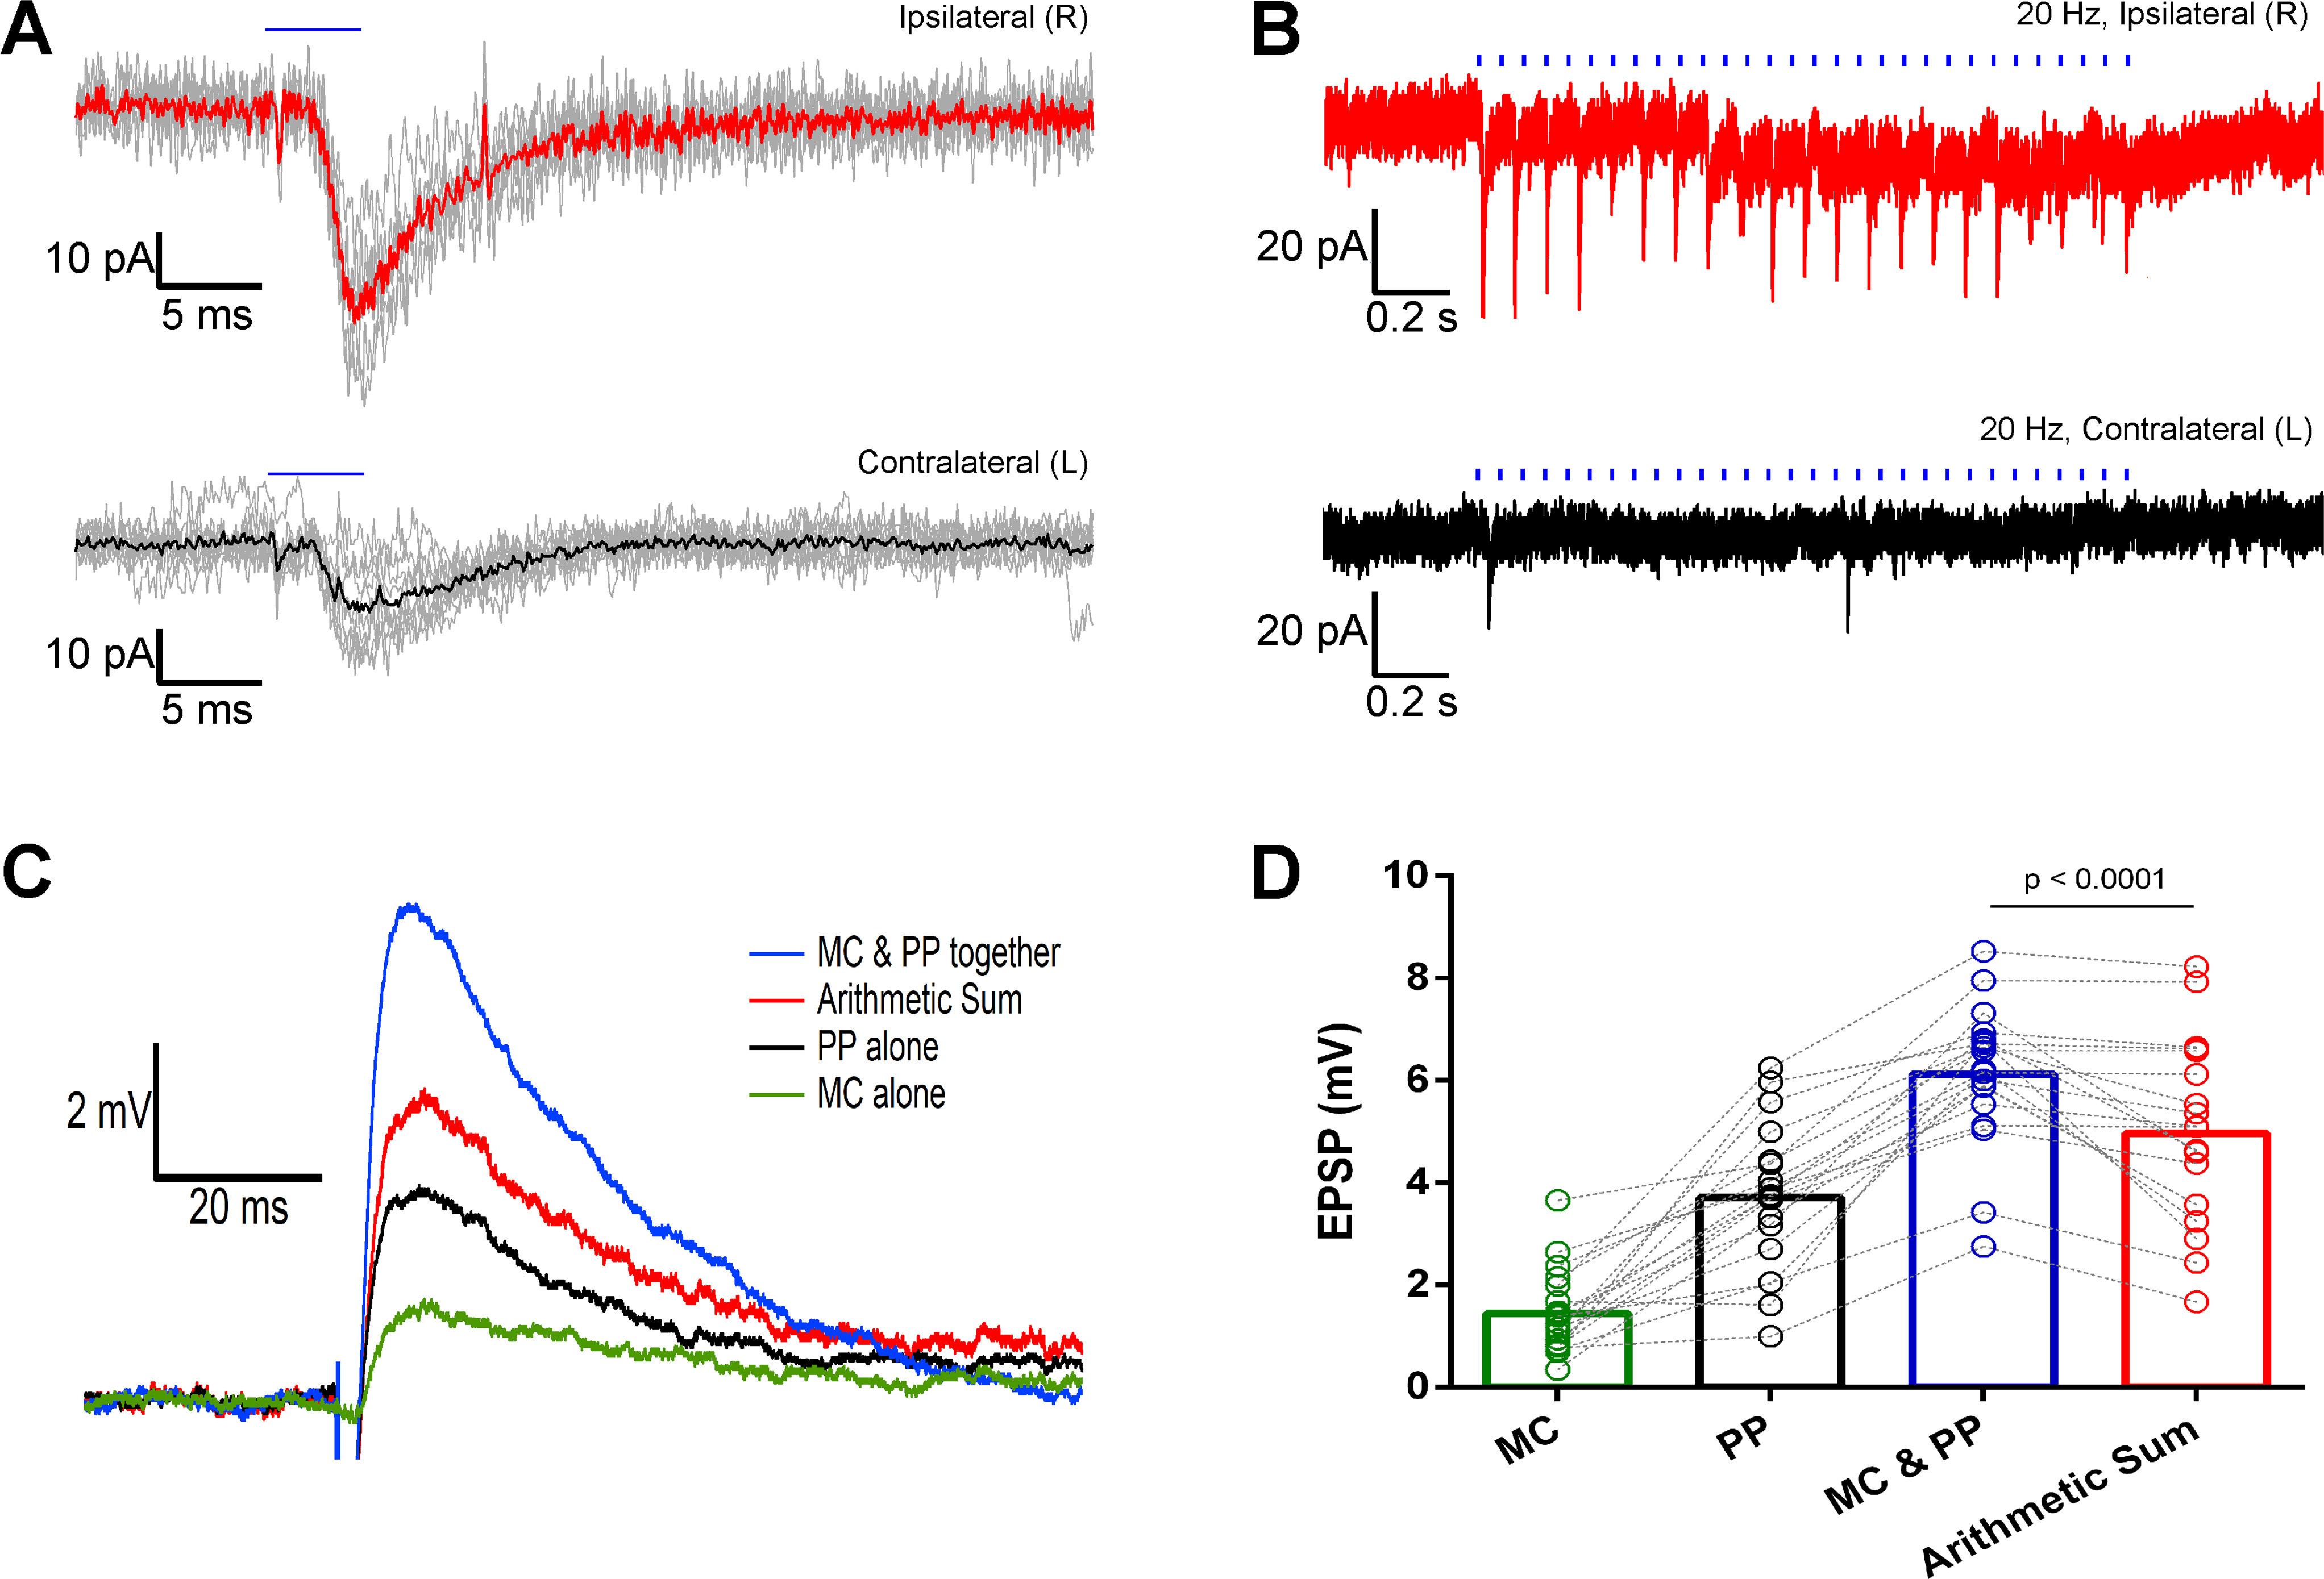
Mossy cells (MCs) of the dentate gyrus (DG) are a major group of excitatory hilar neurons that are important for regulating activity of dentate granule cells. MCs are particularly intriguing because of their extensive longitudinal connections within the DG. It has generally been assumed that MCs in the dorsal and ventral DG have similar patterns of termination in the inner one-third of the dentate molecular layer. Here, we demonstrate that axonal projections of MCs in these two regions are considerably different. MCs in dorsal and ventral regions were labeled selectively with Cre-dependent eYFP or mCherry, using two transgenic mouse lines (including both sexes) that express Cre-recombinase in MCs. At four to six weeks following unilateral labeling of MCs in the ventral DG, a dense band of fibers was present in the inner one-fourth of the molecular layer and extended bilaterally throughout the rostral-caudal extent of the DG, replicating the expected distribution of MC axons. In contrast, following labeling of MCs in the dorsal DG, the projections were more diffusely distributed. At the level of transfection, fibers were present in the inner molecular layer, but they progressively expanded into the middle molecular layer and, most ventrally, formed a distinct band in this region. Optical stimulation of these caudal fibers expressing ChR2 demonstrated robust EPSCs in ipsilateral granule cells and enhanced the effects of perforant path stimulation in the ventral DG. These findings suggest that MCs in the dorsal and ventral DG differ in the distribution of their axonal projections and possibly their function.SIGNIFICANCE STATEMENT Mossy cells (MCs), a major cell type in the hilus of the dentate gyrus (DG), are unique in providing extensive longitudinal and commissural projections throughout the DG. Although it has been assumed that all MCs have similar patterns of termination in the inner molecular layer of the DG, we discovered that the axonal projections of dorsal and ventral MCs differ. While ventral MC projections exhibit the classical pattern, with dense innervation in the inner molecular layer, dorsal MCs have a more diffuse distribution and expand into the middle molecular layer where they overlap and interact with innervation from the perforant path. These distinct locations and patterns of axonal projections suggest that dorsal and ventral MCs may have different functional roles.

Keywords: associational pathway; commissural pathway; dentate granule cells; hilus; hippocampus; mossy cells.


Figures

Figure 1.
Figure 1.
Locations of the transfections and planes of section used for histologic analysis are illustrated diagrammatically and in Nissl-stained sections of the hippocampus. A, Transfections were made at two sites in the rostral (dorsal) and two sites in the caudal (ventral) DG. In double-labeled experiments, transfections for mCherry (red dots) were made rostrally, and those for eYFP (green dots) were made caudally. B–E, AP levels of the transfections are illustrated in coronal sections, progressing from the most rostral (B) to most caudal (E), and correspond to coordinates described in the text. Planes in D, E indicate the locations of the horizontal sections. F, G, For histologic analysis, the ventral hippocampus was sectioned in the horizontal plane, with the section in F corresponding to the region transected by the plane in D, and the section in G corresponding to the region transected by the plane in E. When sectioned in the horizontal plane, the rostral (anterior) region of the ventral DG has an elongated shape (F), and the more caudal region assumes a C-shape (G). The image of the hippocampus (A) and planes of section for the horizontal images (F, G) are based on data from the Allen Brain Atlas, Explorer 2. Scale bars: 500 µm (B–E) and 200 µm (F, G).
Figure 2.
Figure 2.
eYFP-labeled hilar neurons express GluA2 in both the dorsal and ventral DG but express calretinin (CR) in only the ventral region. A–F, Numerous hilar neurons in the dorsal and ventral DG express eYFP (A, D), are labeled for GluA2 (B, E), and are virtually all double labeled (C, F). G–L, Presumed MCs in the dorsal and ventral hilus are labeled for eYFP (G, J) but lack CR labeling in the dorsal hilus (H, I) where only a small number of interneurons or immature granule cells are labeled for CR. In contrast, essentially all eYFP-labeled neurons in the ventral hilus (J) express CR (K, L). Scale bars: 100 µm (A–L).
Figure 3.
Figure 3.
eYFP-labeled neurons exhibit numerous dendritic spines throughout the dentate hilus, but the spine morphology differs at dorsal and ventral levels. A, In the dorsal hilus, numerous complex spines are evident along the dendrites, and many resemble the thorny excrescences (arrowheads) that characterize some MCs. B, In the ventral hilus, labeled spines are abundant (arrows) but are generally less complex than those of labeled neurons in the dorsal hilus. Scale bars: 10 µm (A, B).
Figure 4.
Figure 4.
eYFP-labeled MCs in the dorsal DG provide a direct commissural projection to the contralateral molecular layer and hilus at the level of the transfected neurons. A, Labeled neurons fill the dentate hilus (H) on the ipsilateral (transfected) side, and their axons form a distinct band (arrow) in the dentate molecular layer (M) of the contralateral side, adjacent to the unlabeled granule cell layer (G). B, In the contralateral DG, a narrow, dense band of labeled fibers (arrow) is evident at a slight distance from the granule cell layer (G) and a more diffuse plexus extends further into the molecular layer (*). Labeled fibers are also present in the contralateral hilus (H), and a few labeled fibers extend perpendicularly through the granule cell layer. C, On the ipsilateral side, numerous labeled cell bodies and processes are evident in the hilus. While labeled fibers are present in the inner molecular layer (arrow), their density is substantially lower than that on the contralateral side. This panel is a montage, with the regions above and below the dashed line imaged at different intensities, to avoid complete saturation of the strongly labeled cell bodies in the hilus when imaging the less intensely labeled plexus in the molecular layer. The region above the dashed line was imaged with the same parameters as those used for imaging the contralateral side, to allow comparison of the axonal plexuses. Scale bars: 200 µm (A) and 50 µm (B, C).
Figure 5.
Figure 5.
eYFP-labeled MCs in the hilus of the dorsal DG provide strong commissural projections to the contralateral dentate, but the projections shift positions and become more diffusely organized as they extend ventrally as commissural and associational fibers. A, In a coronal section at 600 µm further caudal than the section in Figure 4, commissural projections from dorsal MCs in the hilus (H) remain stronger on the contralateral side (arrow), near the unlabeled granule cell layer (G), than on the transfected side, and increased diffuse labeling (*) is evident in the molecular layer (M). Dashed lines delineate the borders of the molecular layer in all panels. B, In a horizontal section at an anterior ventral level, beyond the level of labeled cell bodies, the axonal projections (arrows) expand and become more diffuse bilaterally. C, In a horizontal section at a more ventral level, the MC projections (arrows) form a narrower but distinct band in the molecular layer on each side. Scale bars: 200 µm (A–C).
Figure 6.
Figure 6.
The patterns of axonal projections of dorsal (mCherry-labeled) and ventral (eYFP-labeled) MCs differ as the fibers extend through the DG. A, B, In dorsal, coronal sections, projections from the dorsal and ventral MCs largely overlap in the molecular layer (M), adjacent to the granule cell layer (G). Dashed lines delineate the borders of the molecular layer in all panels. C, D, At ventral levels, the projections from dorsal and ventral MCs diverge and no longer overlap. A dense projection from the ventral MCs (eYFP) is present bilaterally (arrows), adjacent to the unlabeled granule cell layer (G), while a wider band of more diffuse fibers (arrowheads) from the dorsal MCs is evident in the middle molecular layer. Both projections are strongest on the ipsilateral side. At anterior ventral levels (C) a few double-labeled cell bodies (yellow) are evident in the hilus, suggesting some overlap of the dorsal and ventral transfections at this level. Scale bars: 200 µm (A–D).
Figure 7.
Figure 7.
Labeling of dorsal MCs with mCherry and ventral MCs with eYFP demonstrate the progressive changes in their axonal projections throughout the DG in a series of transverse sections through an elongated hippocampus at 600-µm intervals. A–H, At rostral levels (A–D), mCherry-labeled MCs are abundant in the dentate hilus (H), deep to the granule cell layer (G). At more caudal levels (E–H), eYFP-labeled MCs predominate, and there is little overlap of the two labels in this animal. The dense axonal projections from caudal MCs (arrows) are strong and predominate at rostral levels (A–D), but are weaker at the level of their labeled cell bodies (E–H). The axonal projections from rostral MCs are occluded at rostral levels (A–C) where the ipsilateral projections of these neurons are weak, but the projections expand into the molecular layer at more caudal levels (D–H), forming a wider diffuse band (arrowheads) at anterior ventral levels (D, E) and a narrower band (arrowheads) at more caudal levels (F, G). At ventral levels, the innervation from rostral and caudal MCs form non-overlapping laminar distributions in the molecular layer (D–H). Scale bars: 200 µm (A–H).
Figure 8.
Figure 8.
MCs in the dorsal and ventral DG form distinct laminar projections to the molecular layer. A, B, Axonal projections from ventral MCs (eYFP) in the hilus (H) form dense projections (arrows) to the inner molecular layer (M), adjacent to the DAPI-labeled nuclei of granule cells (G), throughout the longitudinal extent of the DG. These projections are strongest at dorsal levels (A), distant from their cell bodies of origin. In contrast, dorsal MCs (mCherry) form projections that differ in their locations at dorsal and ventral locations. While these projections overlap with those of ventral MCs at dorsal levels, they assume non-overlapping laminar distributions (arrowhead) at caudal levels (B) and are located in the middle molecular layer (mM), between the axonal projection of ventral MCs in the inner molecular layer (iM) and the unlabeled outer molecular layer (oM). Dashed line in B indicates the outer border of the molecular layer. C, At higher magnification, the laminar pattern can be related to the expected innervation from associational/commissural (A/C) fibers of MCs, medial perforant path (PP), and lateral PP. Scale bars: 200 µm (A, B) and 25 µm (C).
Figure 9.
Figure 9.
Optically evoked EPSCs and EPSPs in ventral DG granule cells through stimulation of dorsal MC projections in the DG molecular layer. A, Single light pulse stimulation (5 ms) evoked EPSCs (gray) and their averages (thick red or black lines) in granule cells from mice with ChR2-eYFP unilaterally transfected dorsal MCs. B, EPSCs evoked in ventral granule cells by a 20-Hz train optical stimulation of the ChR2-eYFP-expressing dorsal MC axons. Recordings from ipsilateral (red) and contralateral (black) granule cells. Blue horizontal bars indicate the duration of the optical stimulation. C, EPSPs evoked by optical stimulation of the MC projections (MC) in the dentate molecular layer (green), electrical stimulation of the medial perforant path (PP) outside the hippocampal fissure (black), and simultaneous stimulation of the two pathways (MC and PP; blue). The red trace is the digital arithmetic sum of the green trace (evoked by MC) and black trace (evoked by PP). D, Bar graph showing the summary and statistics of all the evoked EPSPs and the arithmetic sum traces. The MC and PP evoked EPSPs are significantly larger than those evoked by PP stimulation only (p < 0.0001, paired Wilcoxon test).

Similar articles

Cited by

References

    1. Amaral DG (1978) A Golgi study of cell types in the hilar region of the hippocampus in the rat. J Comp Neurol 182:851–914. 10.1002/cne.901820508 - DOI - PubMed
    1. Amaral DG, Witter MP (1989) The three-dimensional organization of the hippocampal formation: a review of anatomical data. Neuroscience 31:571–591. 10.1016/0306-4522(89)90424-7 - DOI - PubMed
    1. Bannerman DM, Rawlins JN, McHugh SB, Deacon RM, Yee BK, Bast T, Zhang WN, Pothuizen HH, Feldon J (2004) Regional dissociations within the hippocampus–memory and anxiety. Neurosci Biobehav Rev 28:273–283. 10.1016/j.neubiorev.2004.03.004 - DOI - PubMed
    1. Bienkowski MS, Bowman I, Song MY, Gou L, Ard T, Cotter K, Zhu M, Benavidez NL, Yamashita S, Abu-Jaber J, Azam S, Lo D, Foster NN, Hintiryan H, Dong HW (2018) Integration of gene expression and brain-wide connectivity reveals the multiscale organization of mouse hippocampal networks. Nat Neurosci 21:1628–1643. 10.1038/s41593-018-0241-y - DOI - PMC - PubMed
    1. Blasco-Ibáñez JM, Freund TF (1997) Distribution, ultrastructure, and connectivity of calretinin-immunoreactive mossy cells of the mouse dentate gyrus. Hippocampus 7:307–320. 10.1002/(SICI)1098-1063(1997)7:3<307::AID-HIPO6>3.0.CO;2-H - DOI - PubMed

Publication types

LinkOut - more resources