. 2020 Dec 2;5(6):e01044-20.
doi: 10.1128/mSphere.01044-20.

Gut Bacteria Shared by Children and Their Mothers Associate with Developmental Level and Social Deficits in Autism Spectrum Disorder

Affiliations

Gut Bacteria Shared by Children and Their Mothers Associate with Developmental Level and Social Deficits in Autism Spectrum Disorder

Yu Chen et al. mSphere. .

Abstract

The gut microbiota of autism spectrum disorder (ASD) children differs from that of children without ASD. The maternal gut microbiota impacts offspring gut microbiota. However, the relationship between the development of ASD and gut bacteria shared between children and their mothers remains elusive. Our study recruited 76 children with ASD and 47 age- and gender-matched children with typical development (TD), as well as the mothers of both groups, and investigated their gut microbiota using amplicon sequence variants (ASVs). The gut microbiota of ASD children was altered compared with that of children with TD, while no significant alterations were found in their mothers. We established 30 gut bacterial coabundance groups (CAGs) and found the relative abundances of CAG15 and CAG16 significantly decreased in ASD children. CAG15 showed a positive correlation with developmental level. The proportion of ASD children who shared either one of the two Lachnospiraceae ASVs from CAG15 with their mothers was significantly lower than that of children with TD. Moreover, we found that CAG12, CAG13, and CAG18 negatively correlated with the severity of social deficits in ASD children. ASD children who shared any one of the four (two Ruminococcaceae, one Lachnospiraceae, and one Collinsella) ASVs in CAG13 and CAG18 with their mothers showed a lower level of social deficits than ASD children that did not share those with their mothers. These data demonstrate that these shared gut bacteria in ASD children are associated with their developmental level and social deficits. This work provides a new direction toward understanding the role of the gut microbiota in the pathogenesis and development of ASD. (This study has been registered in the Chinese Clinical Trial Registry under number ChiCTR-RPC-16008139.)IMPORTANCE Gut microbiota may contribute to the pathogenesis and development of autism spectrum disorder. The maternal gut microbiota influences offspring gut microbial structure and composition. However, the relationship between the clinical symptoms of autism spectrum disorder and the gut bacteria shared between children and their mothers is not yet known. In our study, the gut microbiota of children with autism spectrum disorder differed from that of children with typical development, but there were no differences in the gut microbiota of their mothers. More importantly, gut bacteria shared between children with autism spectrum disorder and their mothers were related to developmental disabilities and social deficits. Thus, our study suggests that these shared gut bacteria may play an important role in the development of autism spectrum disorder. This provides a new direction for future studies aiming to explore the role of the gut microbiota in autism spectrum disorder.

Keywords: autism spectrum disorder; developmental level; gut microbiota; mother-child pair; social deficits.


Figures

FIG 1
FIG 1
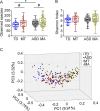
The gut microbial diversity, richness, and structures in ASD children and their mothers and in children with TD and their mothers. Observed species (A) and Shannon indexes (B) among the ASD, TD, MA, and MT groups. The boxes represent the interquartile ranges, lines inside the boxes stand for medians, and whiskers represent the minimum and maximum values. Student’s t tests were used to analyze the variations in ASD versus TD and MA versus MT, while paired t tests were used in ASD versus MA and TD versus MT. *, P < 0.05 for comparison in ASD versus TD and MA versus MT; #, P < 0.05 for comparison in ASD versus MA and TD versus MT. (C) Principal-coordinate analysis plot of the gut microbiota in the TD, ASD, MT, and MA groups based on Bray-Curtis distance. Data in panel C were processed by log(10) transformation. TD, children with typical development (n = 47); ASD, autism spectrum disorder children (n = 76); MT, mothers of children with TD (n = 47). MA, mothers of ASD children (n = 76).
FIG 2
FIG 2
Gut bacterial coabundance groups (CAGs) of 261 ASVs shared by >10% of children in the ASD and TD groups. (A) Amplicon sequence variant (ASV)-level network diagram of the 261 ASVs. Node size stands for the mean abundance of each ASV, with line width indicating correlation magnitude. Red lines or blue lines between nodes represent positive or negative correlations between the nodes they connect, respectively. Only lines corresponding to correlations with a magnitude greater than 0.35 are drawn. The 261 ASVs are clustered into 30 gut bacterial CAGs using the WGCNA package in R. Compared with those in the TD group, the relative abundances of CAG15 (B) and CAG16 (C) in the ASD group were significantly decreased. Boxes and whiskers are denoted as for Fig. 1. Mann-Whitney test was used to analyze the variations. *, P < 0.05, ***, P < 0.001. TD, children with typical development (n = 47); ASD, autism spectrum disorder children (n = 76).
FIG 3
FIG 3
Heat maps of correlations between gut bacterial CAGs and clinical parameters of ASD. (A) GI severity index and GDS in the ASD and TD groups. (B) CARS, ADI-R, and ADOS in the ASD group. The color of the cells represents Spearman’s correlation coefficient between each CAG and clinical parameter. *, P < 0.05; **, P < 0.01; ***, P < 0.001 (adjusted according to Benjamini and Hochberg [53]). GI severity index, n = 112; GDS, Gesell developmental scale, n = 122; CARS, childhood autism rating scale, n = 76; VC, verbal communication, n = 47; NVC, nonverbal communication, n = 29. Reciprocal social interaction (RSI) and repetitive behavior and stereotyped patterns (RBSP) in ADI-R (autism diagnostic interview-revised) and ADOS (autism diagnostic observation schedule), n = 76; CAG, coabundance group; TD, children with typical development; ASD, autism spectrum disorder children.
FIG 4
FIG 4
Alterations in children’s gut bacteria shared with their mothers with the severity of social deficits. The ASD group who shared ASV1617 (A), ASV2314 (B), or ASV330 (C) with their mothers showed significantly decreased scores of communication in the autism diagnostic interview (ADI-R). (D) The ASD group who shared ASV485 with their mothers showed significantly decreased scores of VC. Boxes and whiskers are denoted as for Fig. 1. Student’s t test was used to analyze the variations. *, P < 0.05; **, P < 0.01. NS1678, children who do not share ASV1678 with their mothers in the ASD group, n = 45; S1678, children who share ASV1678 with their mothers in the ASD group, n = 31; NS2314, children who do not share ASV2314 with their mothers in the ASD group, n = 71; S2314, children who share ASV2314 with their mothers in the ASD group, n = 5; NS330, children who do not share ASV330 with their mothers in the ASD group, n = 66; S330, children who share ASV330 with their mothers in the ASD group, n = 10; NS485, children who do not share ASV485 with their mothers in the ASD group, n = 32; S485, children who share ASV485 with their mothers in the ASD group, n = 15; VC, verbal communication; TD, children with typical development; ASD: autism spectrum disorder children.

Similar articles

Cited by

References

    1. Lai M-C, Lombardo MV, Baron-Cohen S. 2014. Autism. Lancet 383:896–910. doi:10.1016/S0140-6736(13)61539-1. - DOI - PubMed
    1. Lord C, Elsabbagh M, Baird G, Veenstra-Vanderweele J. 2018. Autism spectrum disorder. Lancet 392:508–520. doi:10.1016/S0140-6736(18)31129-2. - DOI - PMC - PubMed
    1. Lyall K, Croen L, Daniels J, Fallin MD, Ladd-Acosta C, Lee BK, Park BY, Snyder NW, Schendel D, Volk H, Windham GC, Newschaffer C. 2017. The changing epidemiology of autism spectrum disorders. Annu Rev Public Health 38:81–102. doi:10.1146/annurev-publhealth-031816-044318. - DOI - PMC - PubMed
    1. Baxter AJ, Brugha TS, Erskine HE, Scheurer RW, Vos T, Scott JG. 2015. The epidemiology and global burden of autism spectrum disorders. Psychol Med 45:601–613. doi:10.1017/S003329171400172X. - DOI - PubMed
    1. Maenner MJ, Shaw KA, Baio J, Washington A, Patrick M, DiRienzo M, Christensen DL, Wiggins LD, Pettygrove S, Andrews JG, Lopez M, Hudson A, Baroud T, Schwenk Y, White T, Rosenberg CR, Lee L-C, Harrington RA, Huston M, Hewitt A, Esler A, Hall-Lande J, Poynter JN, Hallas-Muchow L, Constantino JN, Fitzgerald RT, Zahorodny W, Shenouda J, Daniels JL, Warren Z, Vehorn A, Salinas A, Durkin MS, Dietz PM, PhD-7. 2020. Prevalence of autism spectrum disorder among children aged 8 years - Autism and Developmental Disabilities Monitoring Network, 11 sites, United States, 2016. MMWR Surveill Summ 69:1–12. doi:10.15585/mmwr.ss6904a1. - DOI - PMC - PubMed

Publication types

Substances