. 2020 Dec 2;6(1):59.
doi: 10.1038/s41522-020-00170-8.

Artificial consortium demonstrates emergent properties of enhanced cellulosic-sugar degradation and biofuel synthesis

Affiliations

Artificial consortium demonstrates emergent properties of enhanced cellulosic-sugar degradation and biofuel synthesis

Heejoon Park et al. NPJ Biofilms Microbiomes. .

Abstract

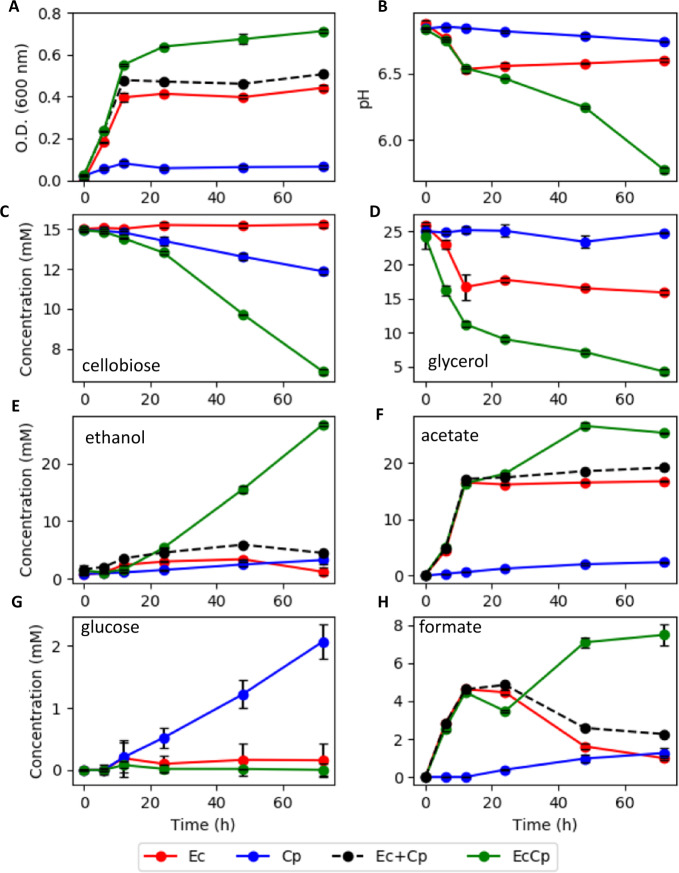
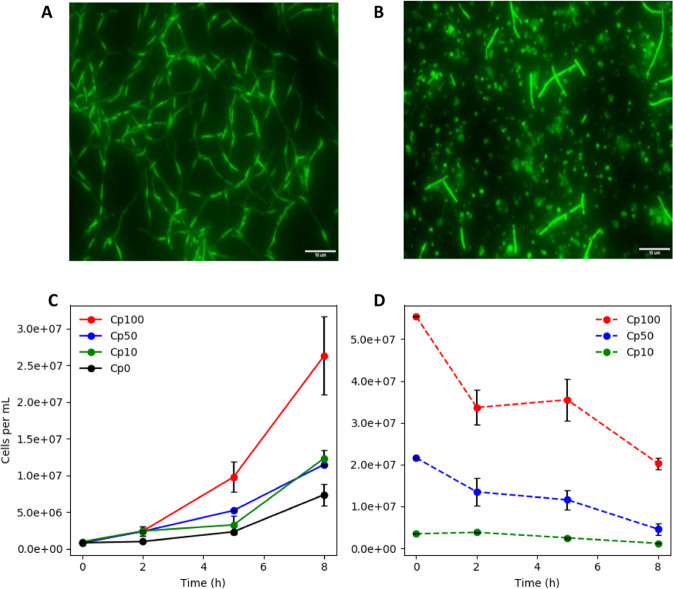
Planktonic cultures, of a rationally designed consortium, demonstrated emergent properties that exceeded the sums of monoculture properties, including a >200% increase in cellobiose catabolism, a >100% increase in glycerol catabolism, a >800% increase in ethanol production, and a >120% increase in biomass productivity. The consortium was designed to have a primary and secondary-resource specialist that used crossfeeding with a positive feedback mechanism, division of labor, and nutrient and energy transfer via necromass catabolism. The primary resource specialist was Clostridium phytofermentans (a.k.a. Lachnoclostridium phytofermentans), a cellulolytic, obligate anaerobe. The secondary-resource specialist was Escherichia coli, a versatile, facultative anaerobe, which can ferment glycerol and byproducts of cellobiose catabolism. The consortium also demonstrated emergent properties of enhanced biomass accumulation when grown as biofilms, which created high cell density communities with gradients of species along the vertical axis. Consortium biofilms were robust to oxic perturbations with E. coli consuming O2, creating an anoxic environment for C. phytofermentans. Anoxic/oxic cycling further enhanced biomass productivity of the biofilm consortium, increasing biomass accumulation ~250% over the sum of the monoculture biofilms. Consortium emergent properties were credited to several synergistic mechanisms. E. coli consumed inhibitory byproducts from cellobiose catabolism, driving higher C. phytofermentans growth and higher cellulolytic enzyme production, which in turn provided more substrate for E. coli. E. coli necromass enhanced C. phytofermentans growth while C. phytofermentans necromass aided E. coli growth via the release of peptides and amino acids, respectively. In aggregate, temporal cycling of necromass constituents increased flux of cellulose-derived resources through the consortium. The study establishes a consortia-based, bioprocessing strategy built on naturally occurring interactions for improved conversion of cellulose-derived sugars into bioproducts.


Conflict of interest statement

The authors declare no competing interests.

Figures

Fig. 1
Fig. 1. Planktonic growth properties for E. coli (Ec) and C. phytofermentans (Cp) monocultures and a binary consortium (EcCp) under anoxic conditions.
a Optical density (OD600), b pH, c cellobiose concentration, d glycerol concentration, e ethanol concentration, f acetate concentration, g glucose concentration, and h formate concentration. Ec + Cp indicates the sum of E. coli and C. phytofermentans monoculture properties. Trends are only shown where relevant. All experiments were performed using mGS-2 medium. Error bars represent the standard deviation from three biological replicates.
Fig. 2
Fig. 2. Biofilm biomass productivity for E. coli (Ec) and C. phytofermentans (Cp) monocultures and binary consortium (Bi) grown under three different cultivation conditions.
OX: 10 days of oxic only conditions, AN: 10 days of anoxic only conditions, and AOS: 6 days anoxic and 4 days oxic growth (denoted with gray shading). a C. phytofermentans cell number per monoculture biofilm, b E. coli cell number per monoculture biofilm, c C. phytofermentans cell number per consortium biofilm, d E. coli cell number per consortium biofilm, e Total biofilm mass (biomass + extracellular material) for monoculture and consortium biofilm cultures. Black hashed area represents sum of monoculture data for AOS condition. Data in e collected after 10 days of cultivation. Error bars represent the standard deviation from three biological replicates. Statistical significance at **p < 0.01, T-test.
Fig. 3
Fig. 3. Spatially resolved, in situ, O2 concentration in E. coli and C. phytofermentans consortium biofilms grown using three different cultivation strategies.
OX: grown for 10 days oxically, AN: grown for 10 days anoxically, AOS: grown for 6 days anoxically followed by 4 days of oxic growth. The O2 concentrations within biofilm were measured using 25 µm diameter microelectrode O2 probes. A depth of 0 μm is the top surface of the biofilm. Error bars represent the standard deviation from three biological replicates.
Fig. 4
Fig. 4. Spatially-resolved, species distributions in E. coli (Ec) and C. phytofermentans (Cp) consortium biofilms.
ac Consortium biofilms grown anoxically (AN) for 10 days and df consortium biofilms grown anoxically for 6 days followed by 4 days of oxic growth (AOX). Species distributions were measured using laser microdissection and qPCR analysis of 16S gene copy number. Biomass percentage was calculated from cell number data converted to mass using conversion factors listed in the “Materials and methods”. Cell data based on biofilm samples taken from three vertical positions (top, middle, bottom) and four to six radial positions from a single biofilm. Error bars represent the standard deviation of samples. Micrograph scale bars = 100 μm.
Fig. 5
Fig. 5. E. coli (Ec) and C. phytofermentans (Cp) cell number and biomass concentration as a function of spatial locations in consortium biofilms.
a, c Consortium biofilms grown for 10 days anoxically (AN) and b, d consortium biofilms grown anoxically for 6 days followed by 4 days of oxic growth (AOS). Data are from day 10. Cryosectioned biofilms had cells samples excised using laser microdissection from three vertical positions (top, middle, bottom) from four to six radial positions. Cell number was calculated using qPCR. Biomass concentrations were calculated using conversion factors listed in “Materials and methods”. Error bars represent the standard deviation of samples.
Fig. 6
Fig. 6. Cellobiase activity (cellobiose hydrolysis to glucose) in spent medium from C. phytofermentans (Cp) cultures grown on various carbon sources (5 g L−1 of glucose, cellobiose, or CMC) and C. phytofermentans growth (OD600) with different carbon sources.
a Volumetric cellobiase activity represented as liberated glucose concentration plotted as a function of time, b specific cellobiase activity represented as liberated glucose concentration normalized to culture OD600 plotted as a function of time, c C. phytofermentans growth (OD600) on cellobiose (5 g L−1), glucose (5 g L−1), and a mixture of sugars (5 g L−1 each), d Cellobiose consumption in C. phytofermentans monocultures with and without the presence of glucose (5 g L−1). Error bars represent the standard deviation from three biological replicates.
Fig. 7
Fig. 7. E. coli growth on C. phytofermentans (Cp) necromass.
a Epifluorescence micrograph of C. phytofermentans cultured anoxically. b Epifluorescence image of lysed C. phytofermentans after 24 h of ambient air exposure. c Aerobic E. coli growth on different amounts of C. phytofermentans necromass, see main text for details. d C. phytofermentans necromass abundance, expressed as qPCR-based cell number, during aerobic E. coli growth on lysed C. phytofermentans biomass. Cp100, Cp50, Cp10, and Cp0 refer the percentage of medium comprised of C. phytofermentans necromass solution, see text for more details. Error bars represent the standard deviation from three biological replicates. Micrograph scale bars = 10 μm.
Fig. 8
Fig. 8. C. phytofermentans (Cp) growth on E. coli (Ec) necromass.
a C. phytofermentans cell concentration during monoculture and binary consortium growth, based on qPCR analysis. b C. phytofermentans growth as a monoculture or binary consortia. Consortia growth tested both with and without E. coli necromass. c E. coli growth as an anoxic, monoculture and binary consortium based on qPCR analysis. Cell death occurred after 10–12 h of growth likely releasing necromass. d C. phytofermentans monoculture growth on different amino acid sources. No growth was observed from casamino acid-based medium nor on a nutritionally complete, chemically defined medium CSP which contained only free amino acids. Yeast extract (YE) contained peptides in addition to free amino acids. e C. phytofermentans monoculture growth on different concentrations of peptide-containing YE. f C. phytofermentans growth on different concentrations (High and Low) of E. coli necromass produced via sonication-induced lysis. Error bars represent the standard deviation from three biological replicates. See text for more details.
Fig. 9
Fig. 9. Proposed model of monoculture and consortia interactions and experimental distribution of reduced carbon products.
a C. phytofermentans monoculture, b E. coli monoculture, c C. phytofermentans, and E. coli binary consortia with necromass catabolism. d Experimental distribution of carbon products for C. phytofermentans monoculture after 72 h of cultivation. Areas represent percent of measured carbon moles. e Experimental distribution of carbon products for anoxic E. coli monoculture after 72 h of cultivation. Areas represent percent of measured carbon moles. d Experimental distribution of carbon products for anoxic consortium after 72 h of cultivation. Areas represent percent of measured carbon moles.

References

    1. Yang B, Wyman CE. Pretreatment: the key to unlocking low-cost cellulosic ethanol. Biofuels Bioprod. Bioref. 2008;2:26–40. doi: 10.1002/bbb.49. - DOI
    1. Ko JK, Lee S-M. Advances in cellulosic conversion to fuels: engineering yeasts for cellulosic bioethanol and biodiesel production. Curr. Opin. Biotechnol. 2018;50:72–80. doi: 10.1016/j.copbio.2017.11.007. - DOI - PubMed
    1. Lynd LR, Weimer PJ, van Zyl WH, Pretorius IS. Microbial cellulose utilization: fundamentals and biotechnology. Microbiol. Mol. Biol. Rev. 2002;66:506–577. doi: 10.1128/MMBR.66.3.506-577.2002. - DOI - PMC - PubMed
    1. Lynd LR, van Zyl WH, McBride JE, Laser M. Consolidated bioprocessing of cellulosic biomass: an update. Curr. Opin. Biotechnol. 2005;16:577–583. doi: 10.1016/j.copbio.2005.08.009. - DOI - PubMed
    1. Mohite, B. V. & Patil, S. V. in New and Future Developments in Microbial Biotechnology and Bioengineering (ed. Gupta, V. K.) Ch. 4, 31–40 (Elsevier, 2016).

Publication types

Supplementary concepts

LinkOut - more resources