. 2020 Dec 2;11(1):6161.
doi: 10.1038/s41467-020-20001-w.

A human tissue map of 5-hydroxymethylcytosines exhibits tissue specificity through gene and enhancer modulation

Affiliations

A human tissue map of 5-hydroxymethylcytosines exhibits tissue specificity through gene and enhancer modulation

Xiao-Long Cui et al. Nat Commun. .

Abstract

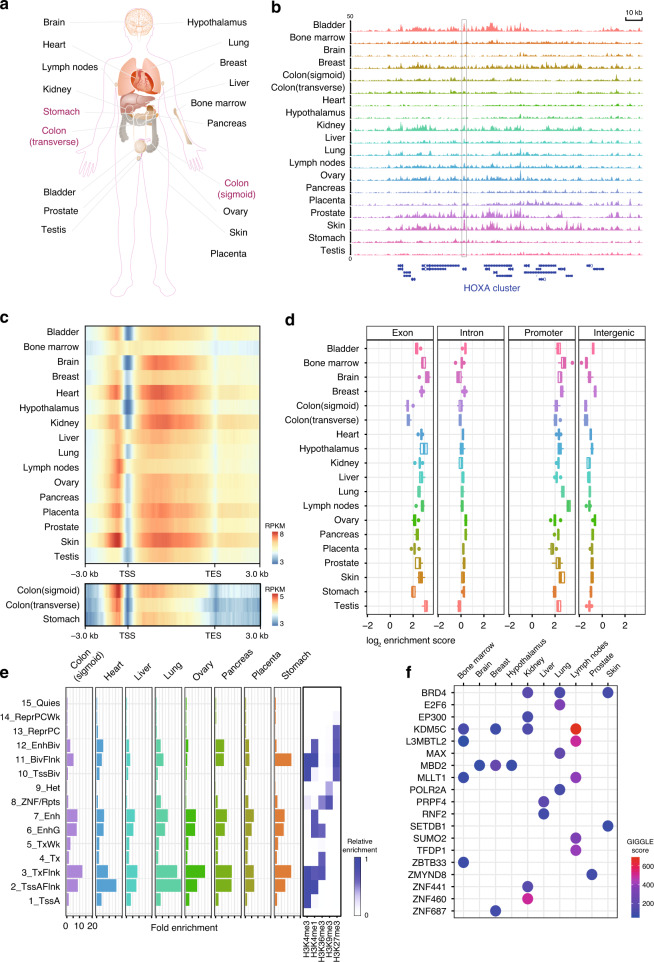
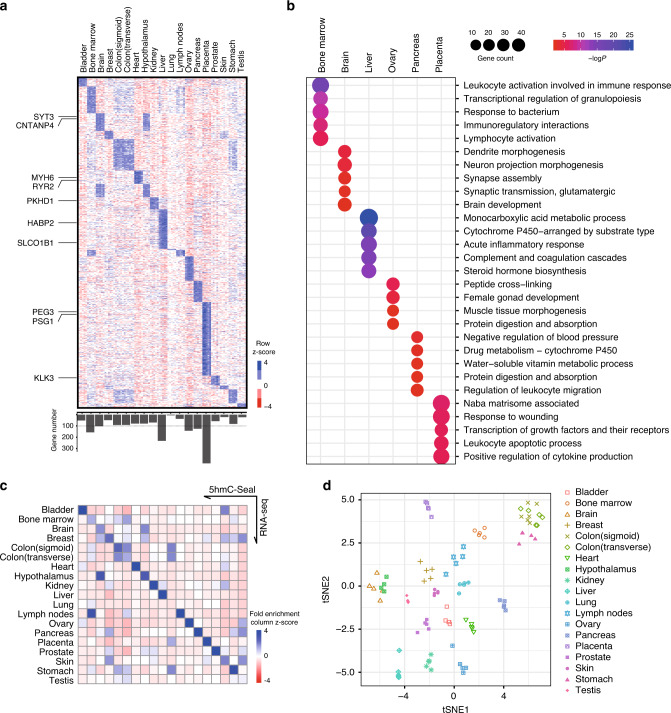
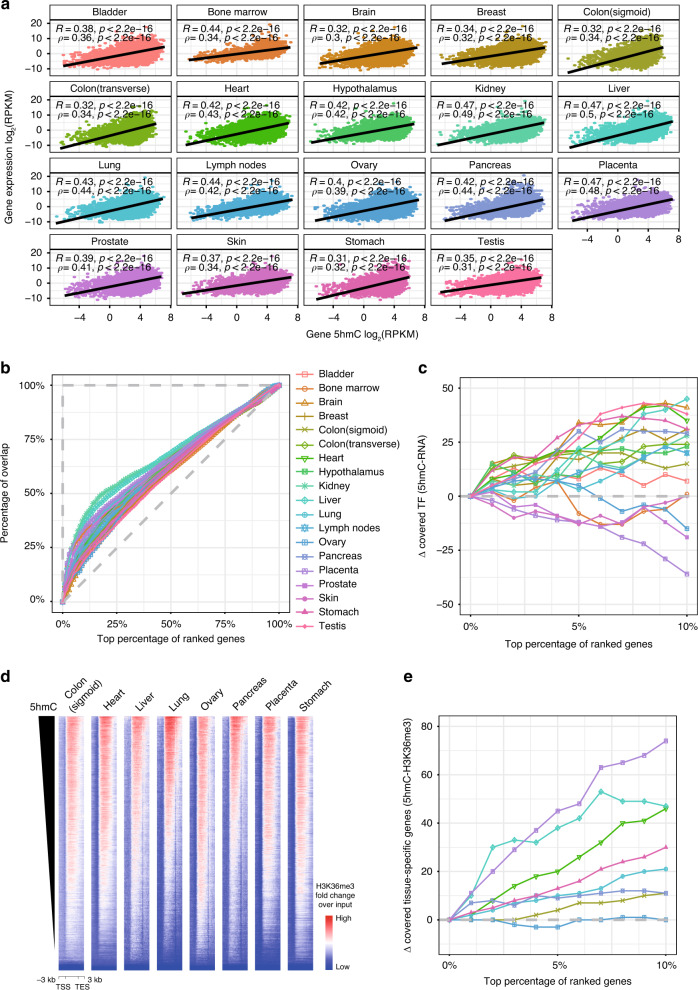
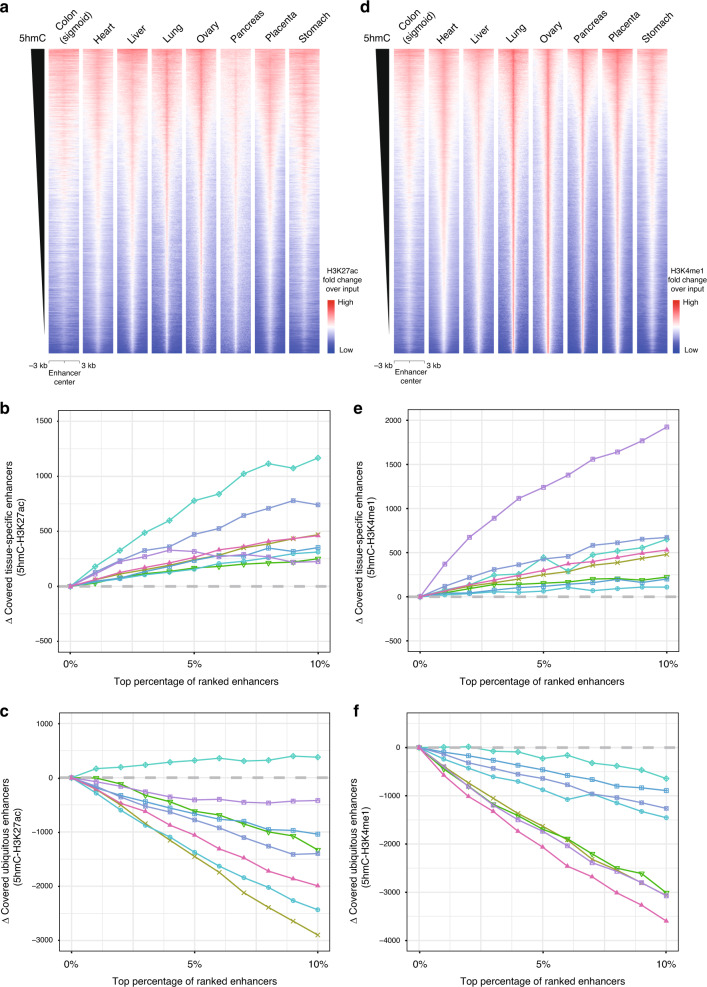
DNA 5-hydroxymethylcytosine (5hmC) modification is known to be associated with gene transcription and frequently used as a mark to investigate dynamic DNA methylation conversion during mammalian development and in human diseases. However, the lack of genome-wide 5hmC profiles in different human tissue types impedes drawing generalized conclusions about how 5hmC is implicated in transcription activity and tissue specificity. To meet this need, we describe the development of a 5hmC tissue map by characterizing the genomic distributions of 5hmC in 19 human tissues derived from ten organ systems. Subsequent sequencing results enabled the identification of genome-wide 5hmC distributions that uniquely separates samples by tissue type. Further comparison of the 5hmC profiles with transcriptomes and histone modifications revealed that 5hmC is preferentially enriched on tissue-specific gene bodies and enhancers. Taken together, the results provide an extensive 5hmC map across diverse human tissue types that suggests a potential role of 5hmC in tissue-specific development; as well as a resource to facilitate future studies of DNA demethylation in pathogenesis and the development of 5hmC as biomarkers.


Conflict of interest statement

C.H. is a scientific founder and scientific advisory board member of Accent Therapeutics, Inc. C.H. and W.Z. are shareholders of Epican Genetech, Ltd. S.L. is the Chief Executive Officer and Chief Scientific Officer of Bluestar Genomics, Inc. C.K.E., Y.N., A.Bergamaschi, and S.L. are employees of Bluestar Genomics and along with J.Ku., F.C., R.T., and P.A. are shareholders of the company. Other authors declare no competing interests.

Figures

Fig. 1
Fig. 1. Landscape of 5hmC across different tissues.
a Schematic plot showing all the organ tissues analyzed in this study. Tumor adjacent tissues are marked in red. b Genome Browser view depicting 5hmC genomic distributions at the HOXA gene cluster for one representative donor’s profile for each of the 19 tissue types assayed. The peak outlined with a box shows a highly variable region as an example. c Metagene plot of 5hmC profiles across different tissues showing underrepresentation of 5hmC at TSS regions and over-representation at gene bodies and promoters. The color ranges indicate RPKM values. Upper panel, normal tissues; lower panel, tumor adjacent tissues. TSS, transcription start site. TES, transcription end site. d Boxplots showing genomic enrichment of 5hmC peaks at RefSeq exons, introns, promoters, and intergenic regions. N = 5 biologically independent samples were used (n = 4 for hypothalamus and n = 6 for sigmoid and transverse colon). For all boxplots, center line represents median, bounds of box represent 25th and 75th percentiles and whiskers are Tukey whiskers. e Enrichment of 5hmC peaks on 15 chromHMM chromatin states from the Roadmap Epigenomics Project for 8 tissue types. Histone modification emissions data are directly from the Roadmap Epigenomics Project. f Enrichment of trans-acting factors binding sites on 5hmC peaks in different tissues. Higher GIGGLE score means higher possibility of enrichment.
Fig. 2
Fig. 2. Tissue-specific, 5hmC-enriched genes are associated with highly tissue-specific functions.
a Relative 5hmC-modification levels on tissue-specific 5hmC-enriched genes in each tissue type. Rows are distinct 5hmC-modified genes. Higher z score indicates enrichment; lower z score indicate depletion of 5hmC signal. Lower panel, numbers of tissue-specific 5hmC-enriched genes for each tissue type. Dashed line represents 100. b Functional enrichment for tissue-specific 5hmC-enriched genes. Only tissues with over 100 tissue-specific 5hmC-enriched genes are shown. Top 5 enriched functional terms are ranked by enrichment significance. c Heatmap showing fold enrichment of tissue-specific 5hmC-modified genes with tissue-specific expressed genes from accompanying RNA-Seq data. d t-SNE clustering of genomic 5hmC distributions on exons for all donor tissue samples. Colored symbols indicate the organ/tissue associated with each 5hmC profile.
Fig. 3
Fig. 3. Enrichment of 5hmC on tissue-specific genes.
a Scatter plots showing correlation of gene-body 5hmC levels with gene expression levels. R represents the Pearson correlation coefficient, and ρ represents the Spearman correlation coefficient. b Correspondence at the top (CAT) plot showing percentages of gene overlap against top percentages of 5hmC-modified genes and expressed genes. Diagonal dashed line represents results from two random gene sets, and the horizontal dashed line represents results from two exact gene sets. c Subtractions of covered transcription factors for top 10% 5hmC-modified genes and top 10% highly expressed genes. d Heatmaps showing correlation of gene-body 5hmC levels with gene-body H3K36me3 levels. TSS, transcription start site. TES, transcription end site. e Subtractions of covered tissue-specific expressed genes for top 10% 5hmC-modified genes and top 10% H3K36me3-modified genes.
Fig. 4
Fig. 4. Enrichment of 5hmC on tissue-specific enhancers.
a Heatmaps showing correlation of 5hmC and H3K27ac signals at all enhancers in 8 representative tissue types. b Subtractions of covered tissue-specific enhancers for the top 10% 5hmC-modified enhancers and the top 10% H3K27ac-modified enhancers. c Subtractions of covered ubiquitous enhancers for the top 10% 5hmC-modified enhancers and the top 10% H3K27ac-modified enhancers. d Heatmaps showing correlation of 5hmC and H3K4me1 signals at all enhancers in 8 representative tissue types. e Subtractions of covered tissue-specific enhancers for the top 10% 5hmC-modified enhancers and the top 10% H3K4me1-modified enhancers. f Subtractions of covered ubiquitous enhancers for the top 10% 5hmC-modified enhancers and the top 10% H3K4me1-modified enhancers.

References

    1. Greenberg MVC, Bourc’his D. The diverse roles of DNA methylation in mammalian development and disease. Nat. Rev. Mol. Cell Biol. 2019;20:590–607. doi: 10.1038/s41580-019-0159-6. - DOI - PubMed
    1. Tahiliani M, et al. Conversion of 5-methylcytosine to 5-hydroxymethylcytosine in mammalian DNA by MLL partner TET1. Science. 2009;324:930–935. doi: 10.1126/science.1170116. - DOI - PMC - PubMed
    1. Ito S, et al. Tet proteins can convert 5-methylcytosine to 5-formylcytosine and 5-carboxylcytosine. Science. 2011;333:1300–1303. doi: 10.1126/science.1210597. - DOI - PMC - PubMed
    1. He YF, et al. Tet-mediated formation of 5-carboxylcytosine and its excision by TDG in mammalian DNA. Science. 2011;333:1303–1307. doi: 10.1126/science.1210944. - DOI - PMC - PubMed
    1. Pastor WA, et al. Genome-wide mapping of 5-hydroxymethylcytosine in embryonic stem cells. Nature. 2011;473:394–397. doi: 10.1038/nature10102. - DOI - PMC - PubMed

Publication types