. 2020 Dec;588(7836):124-129.
doi: 10.1038/s41586-020-2975-4. Epub 2020 Dec 2.

Reprogramming to recover youthful epigenetic information and restore vision

Affiliations

Reprogramming to recover youthful epigenetic information and restore vision

Yuancheng Lu et al. Nature. 2020 Dec.

Abstract

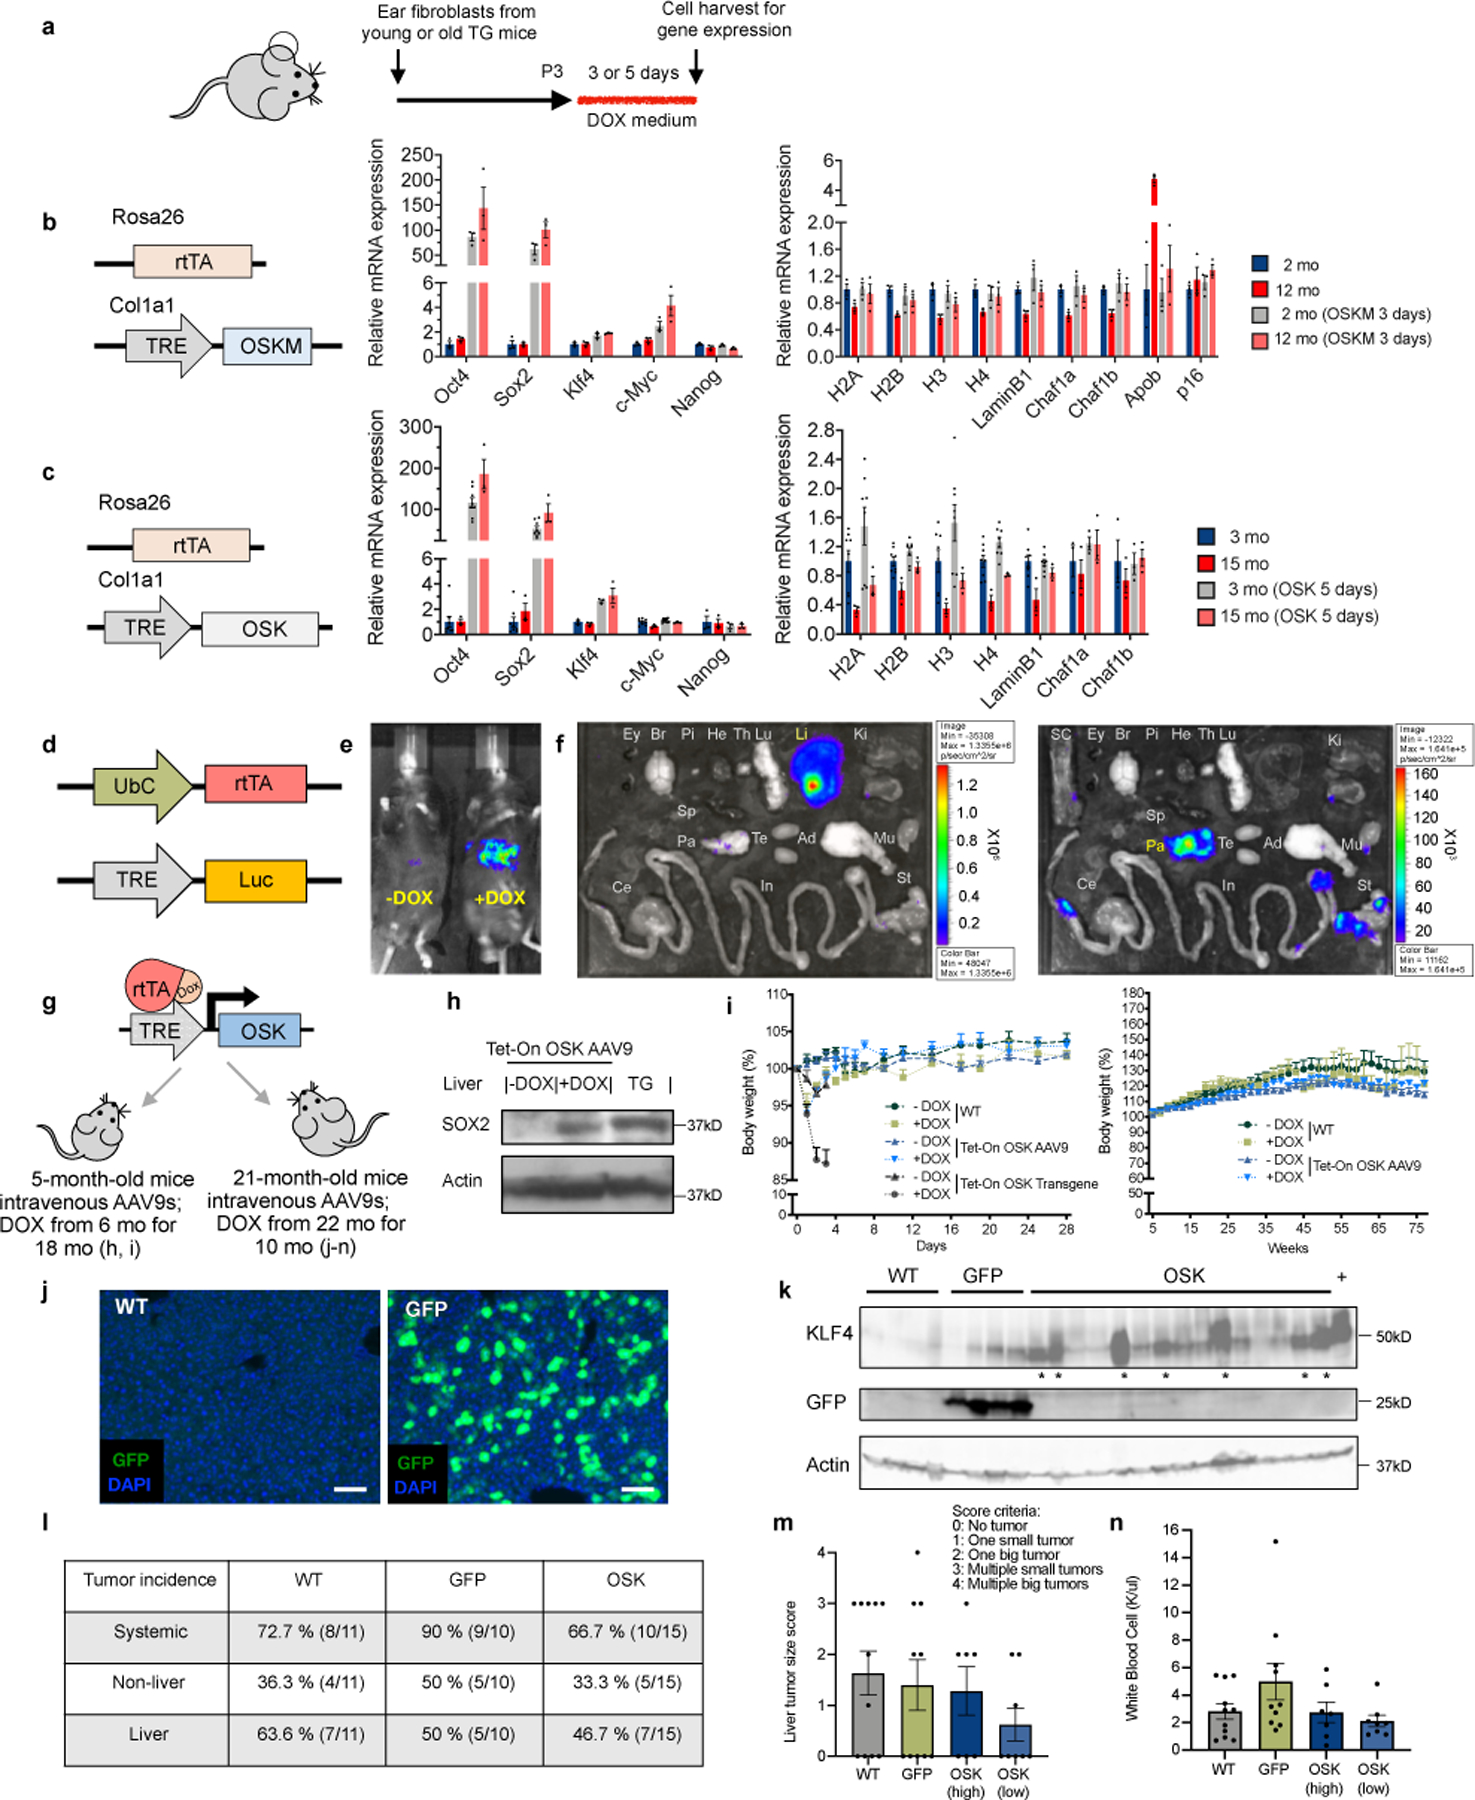
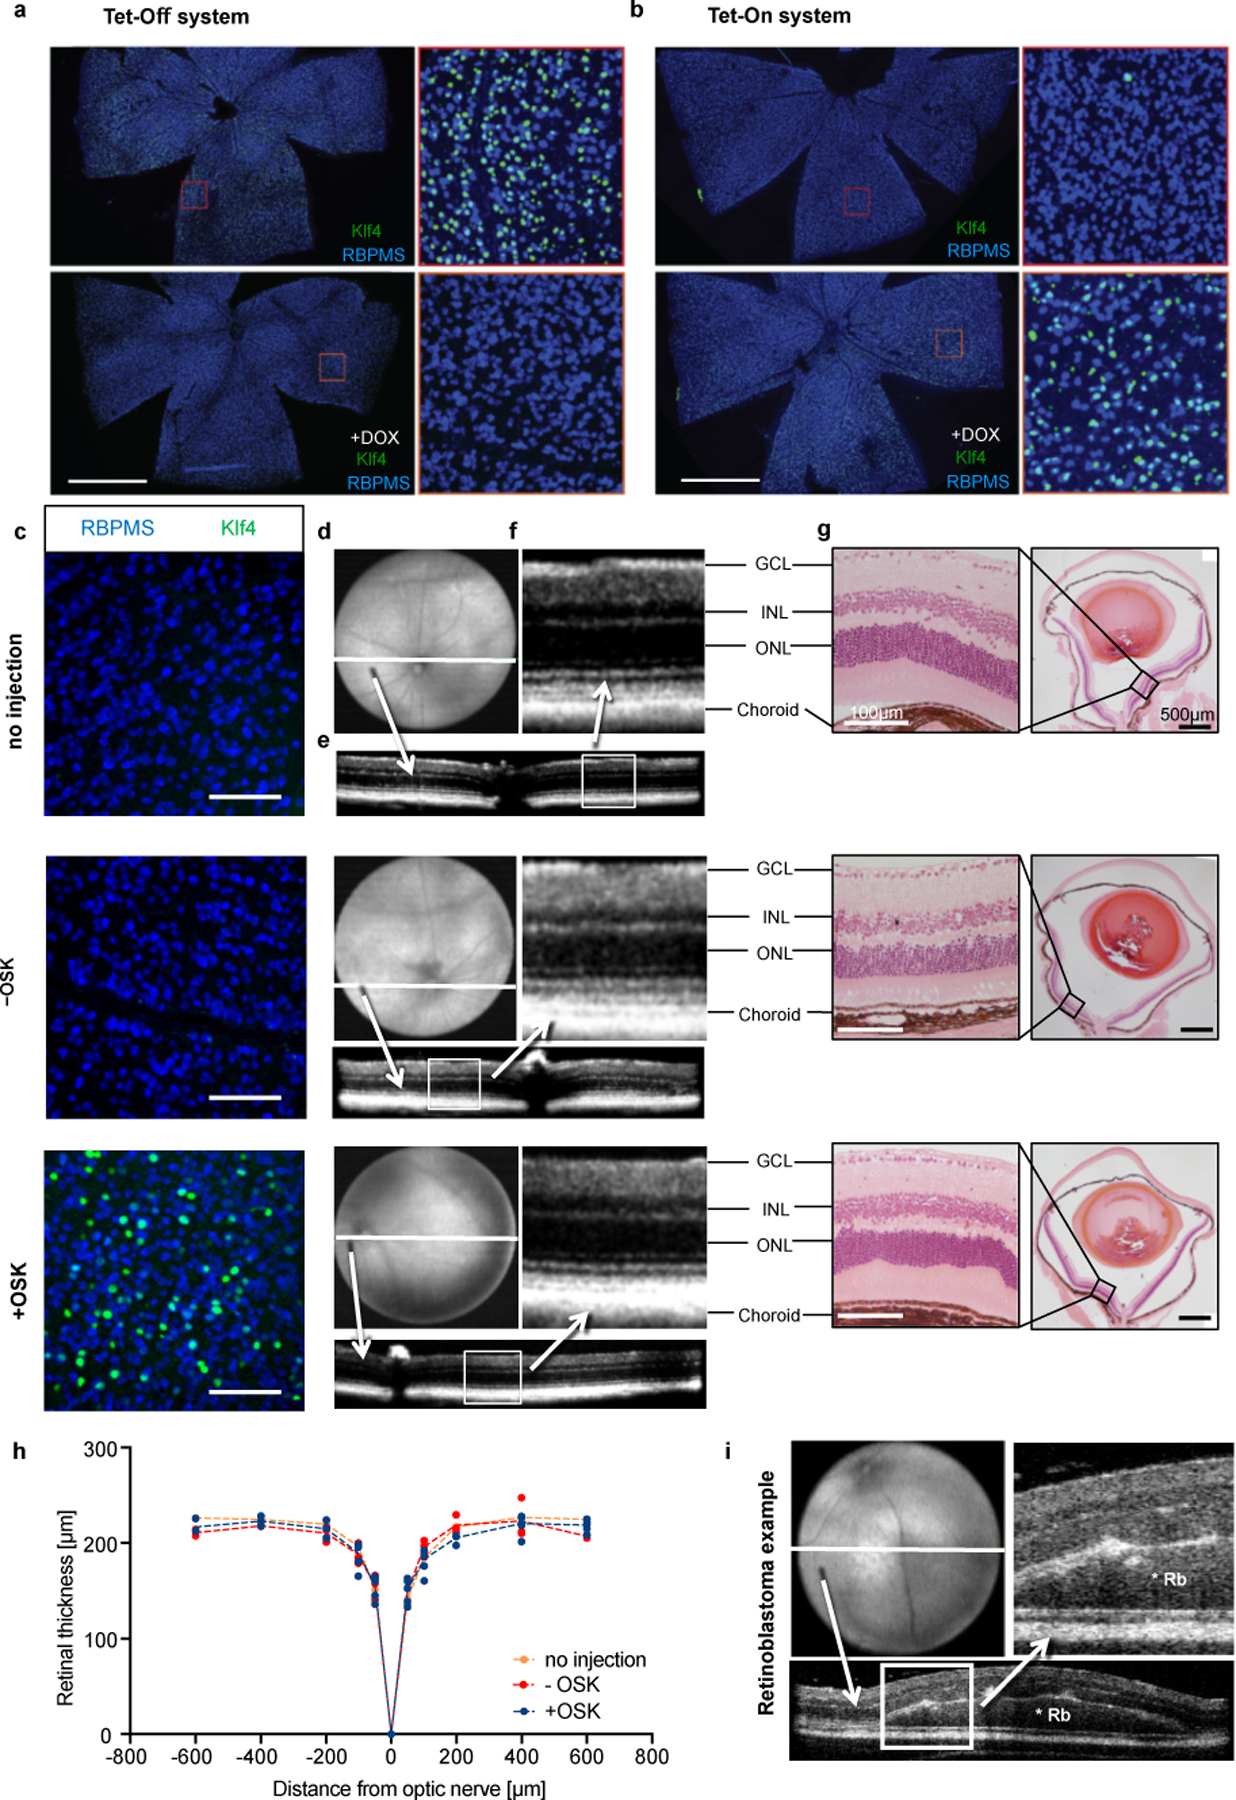
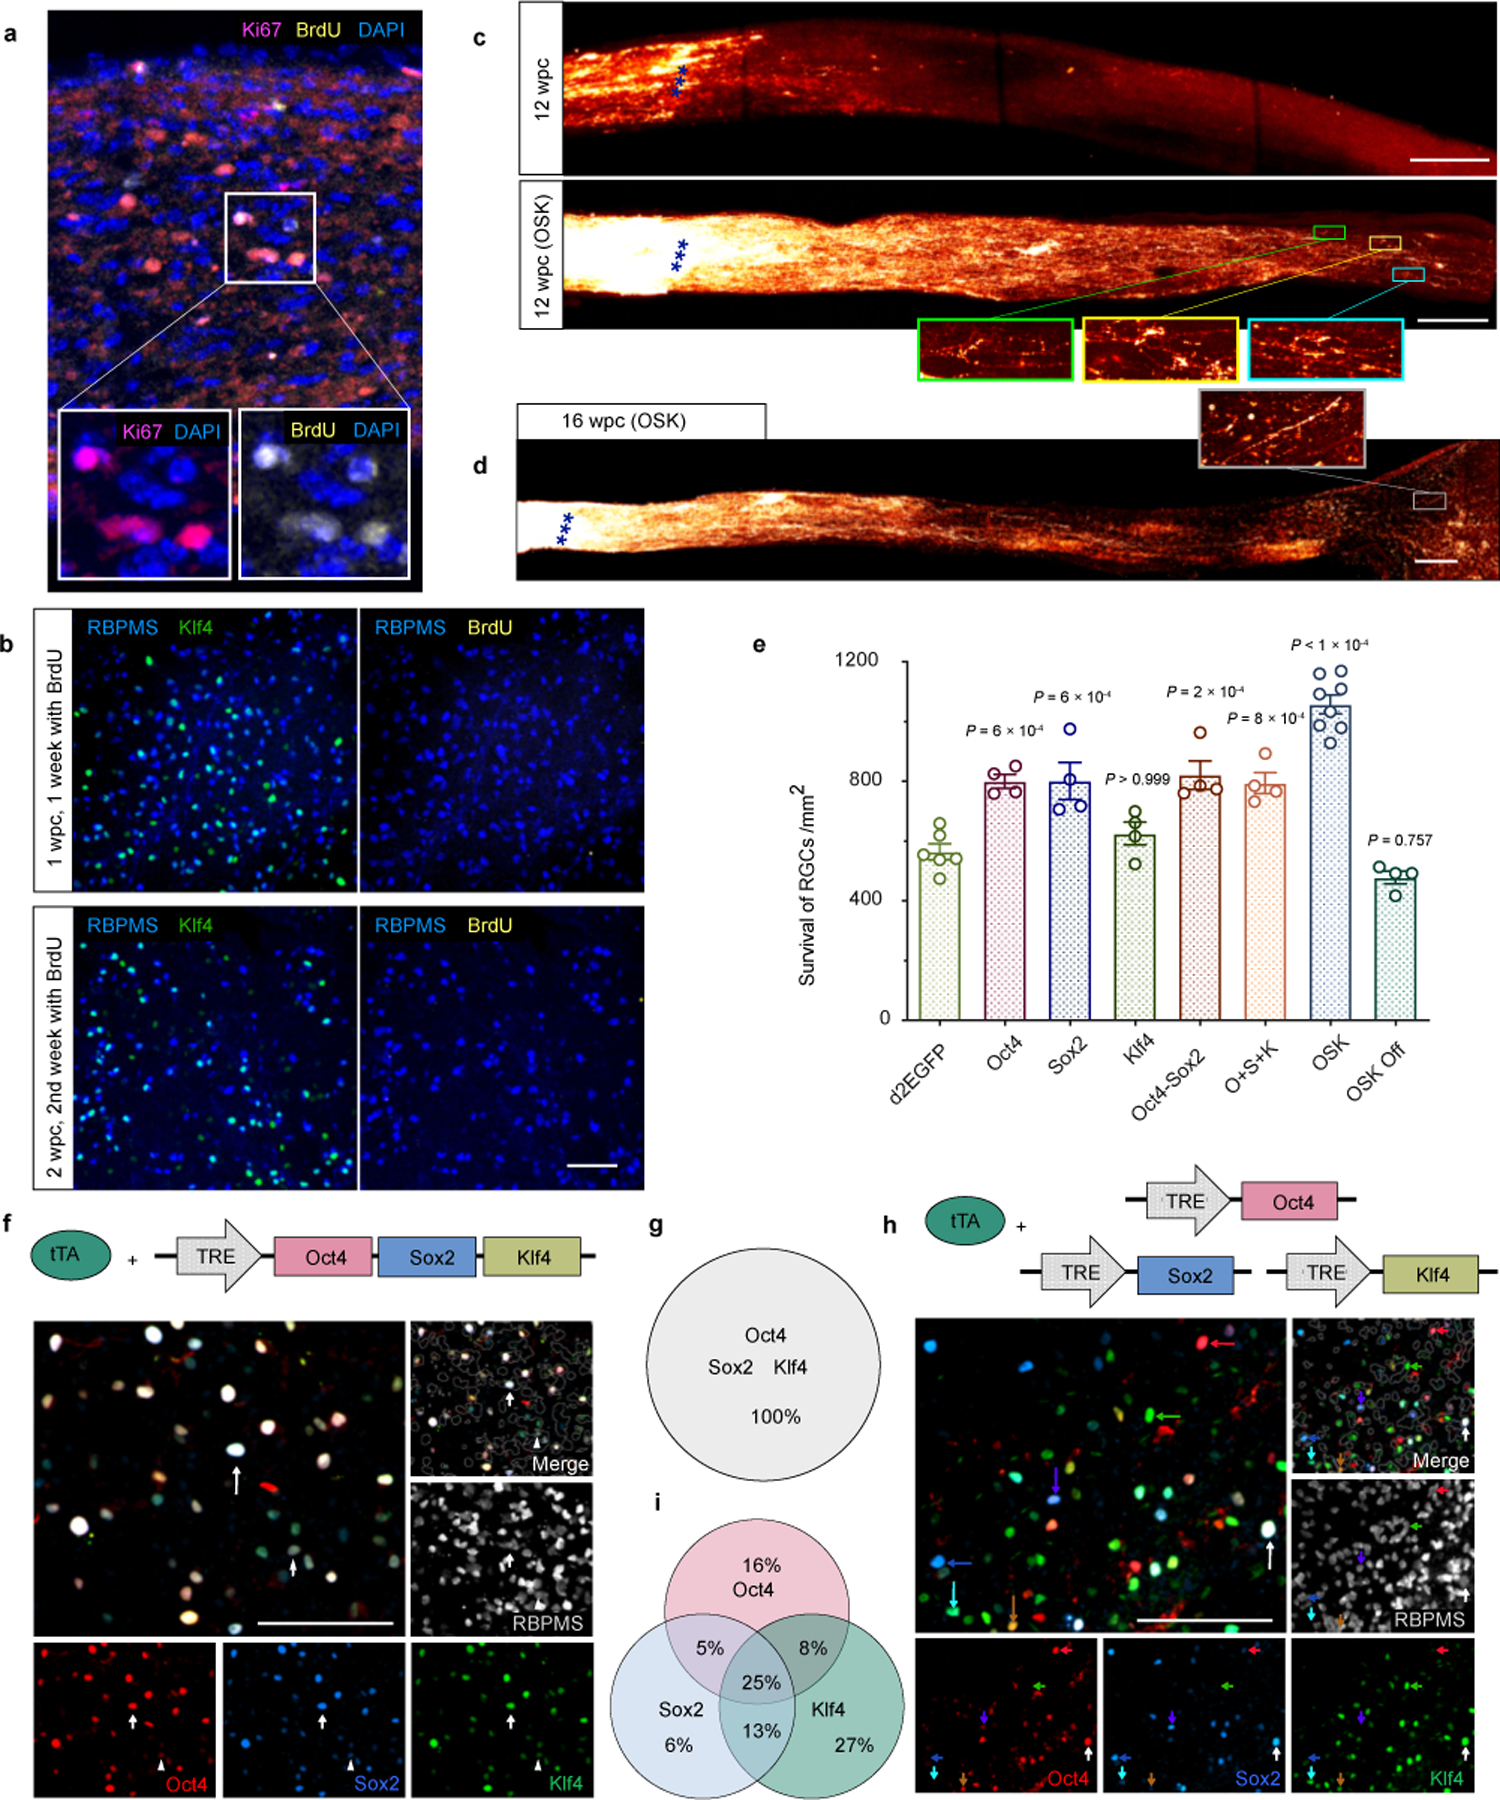
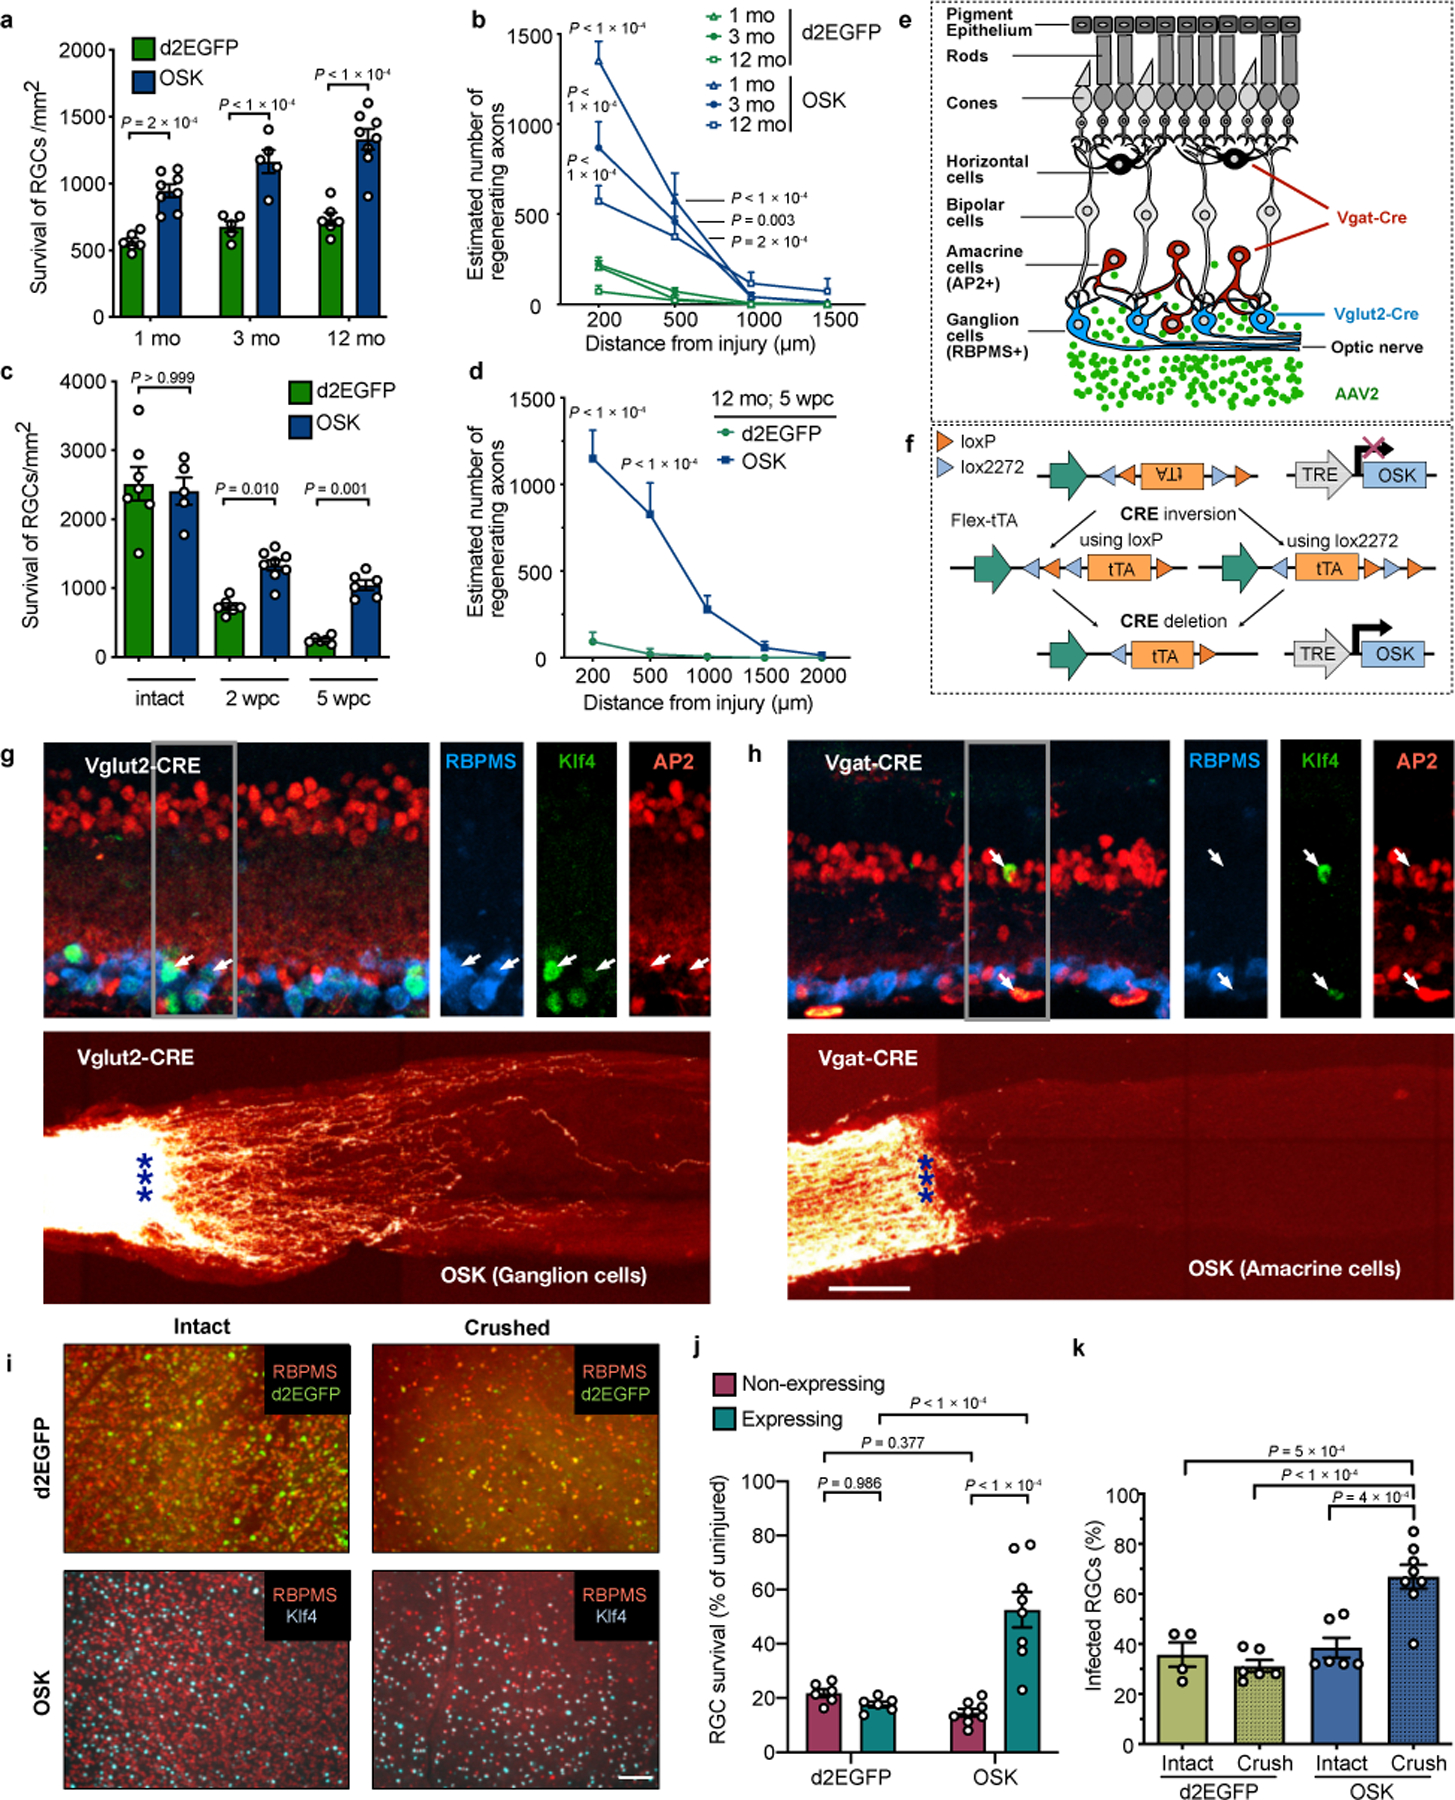
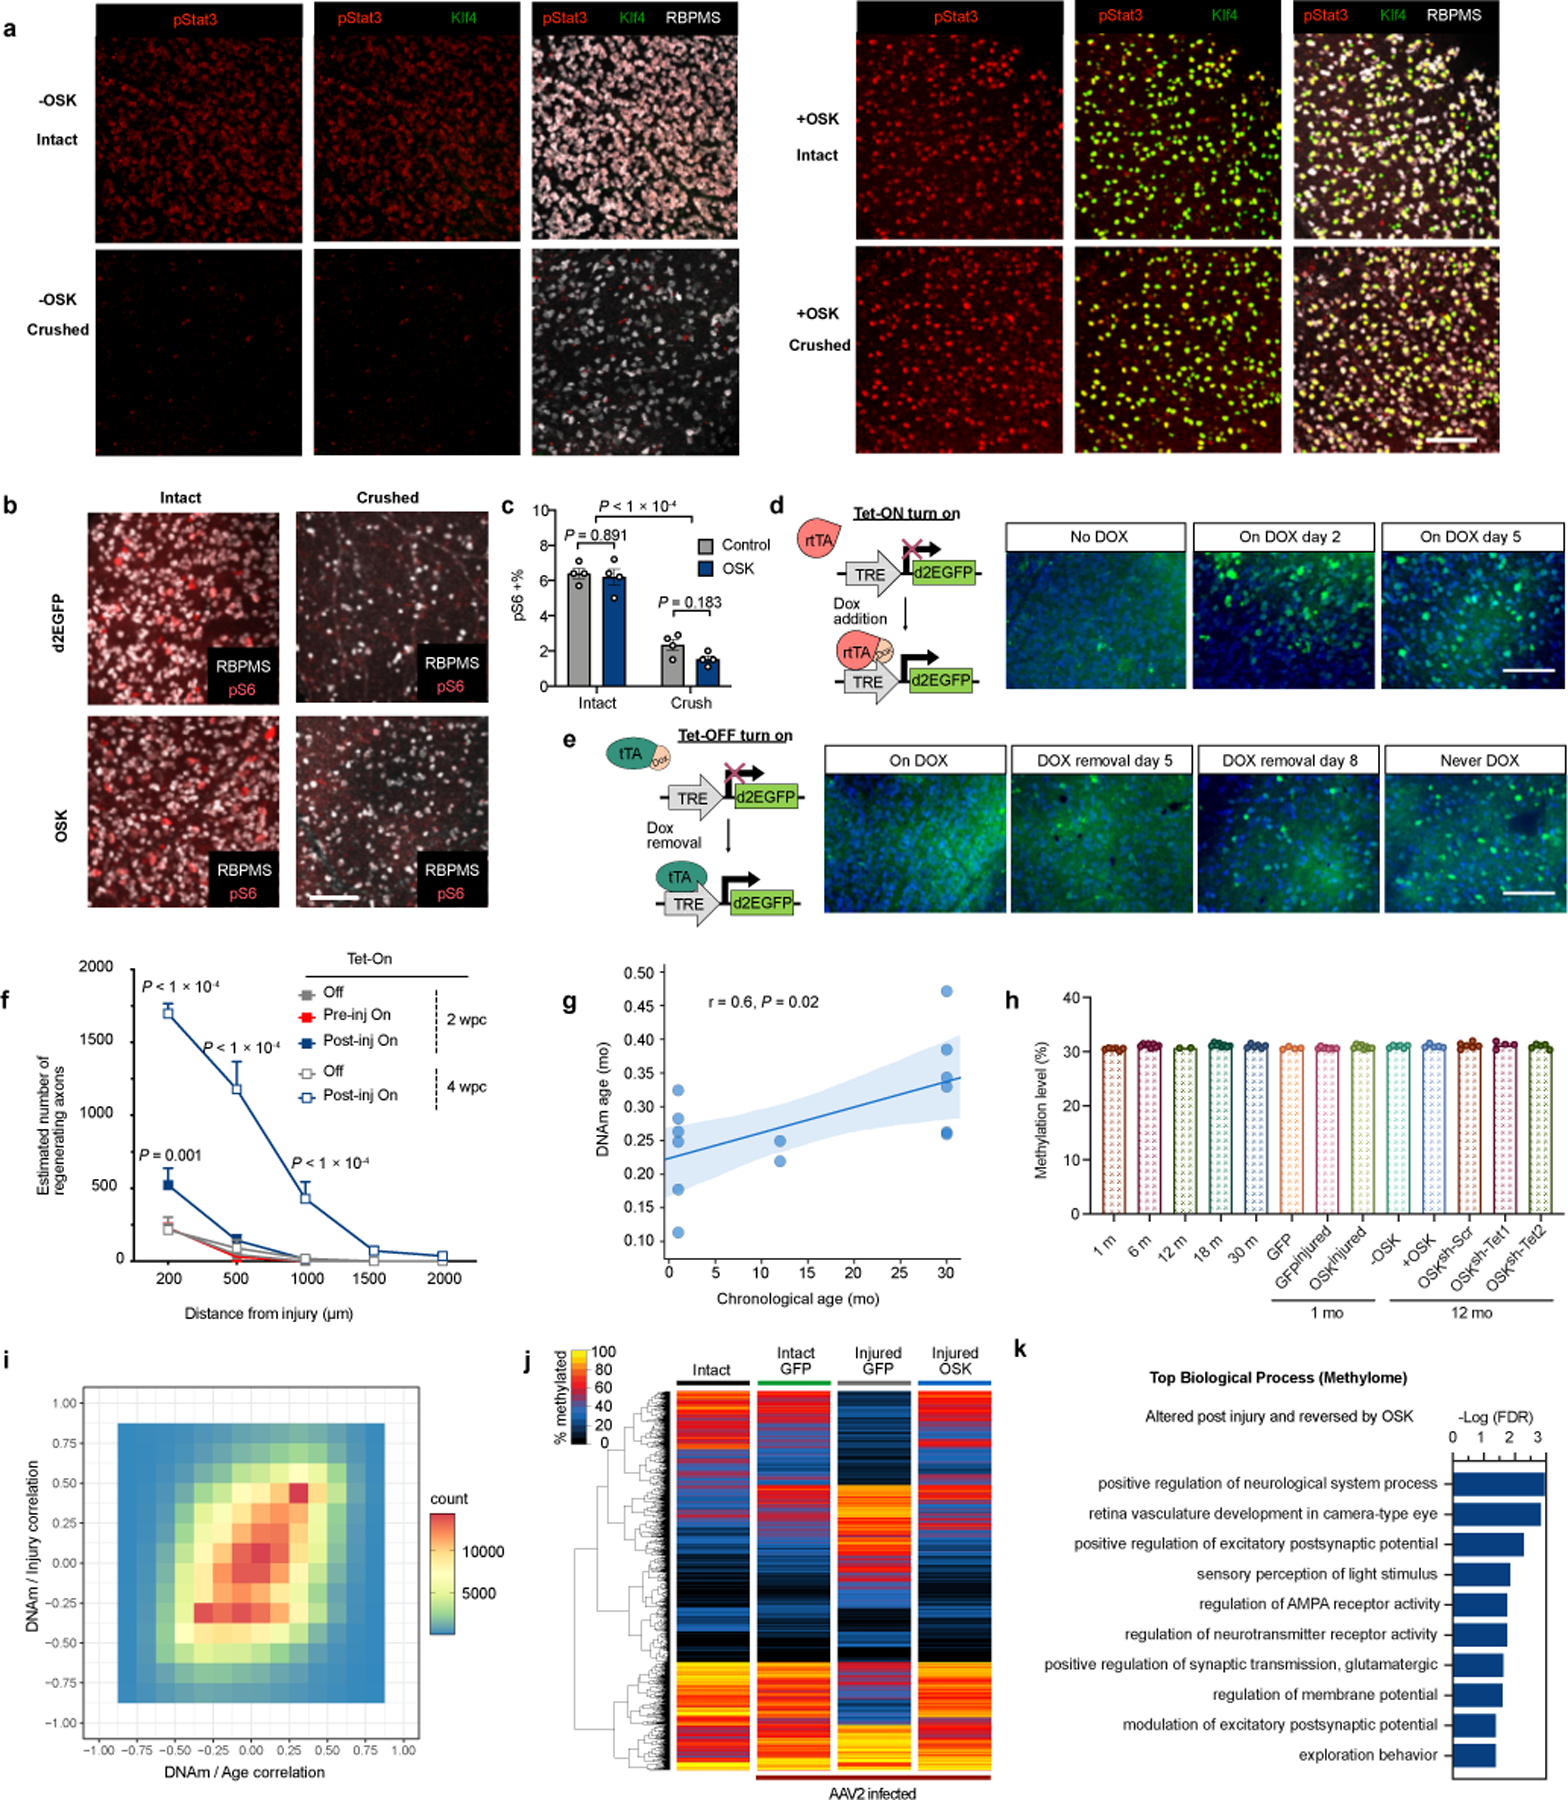
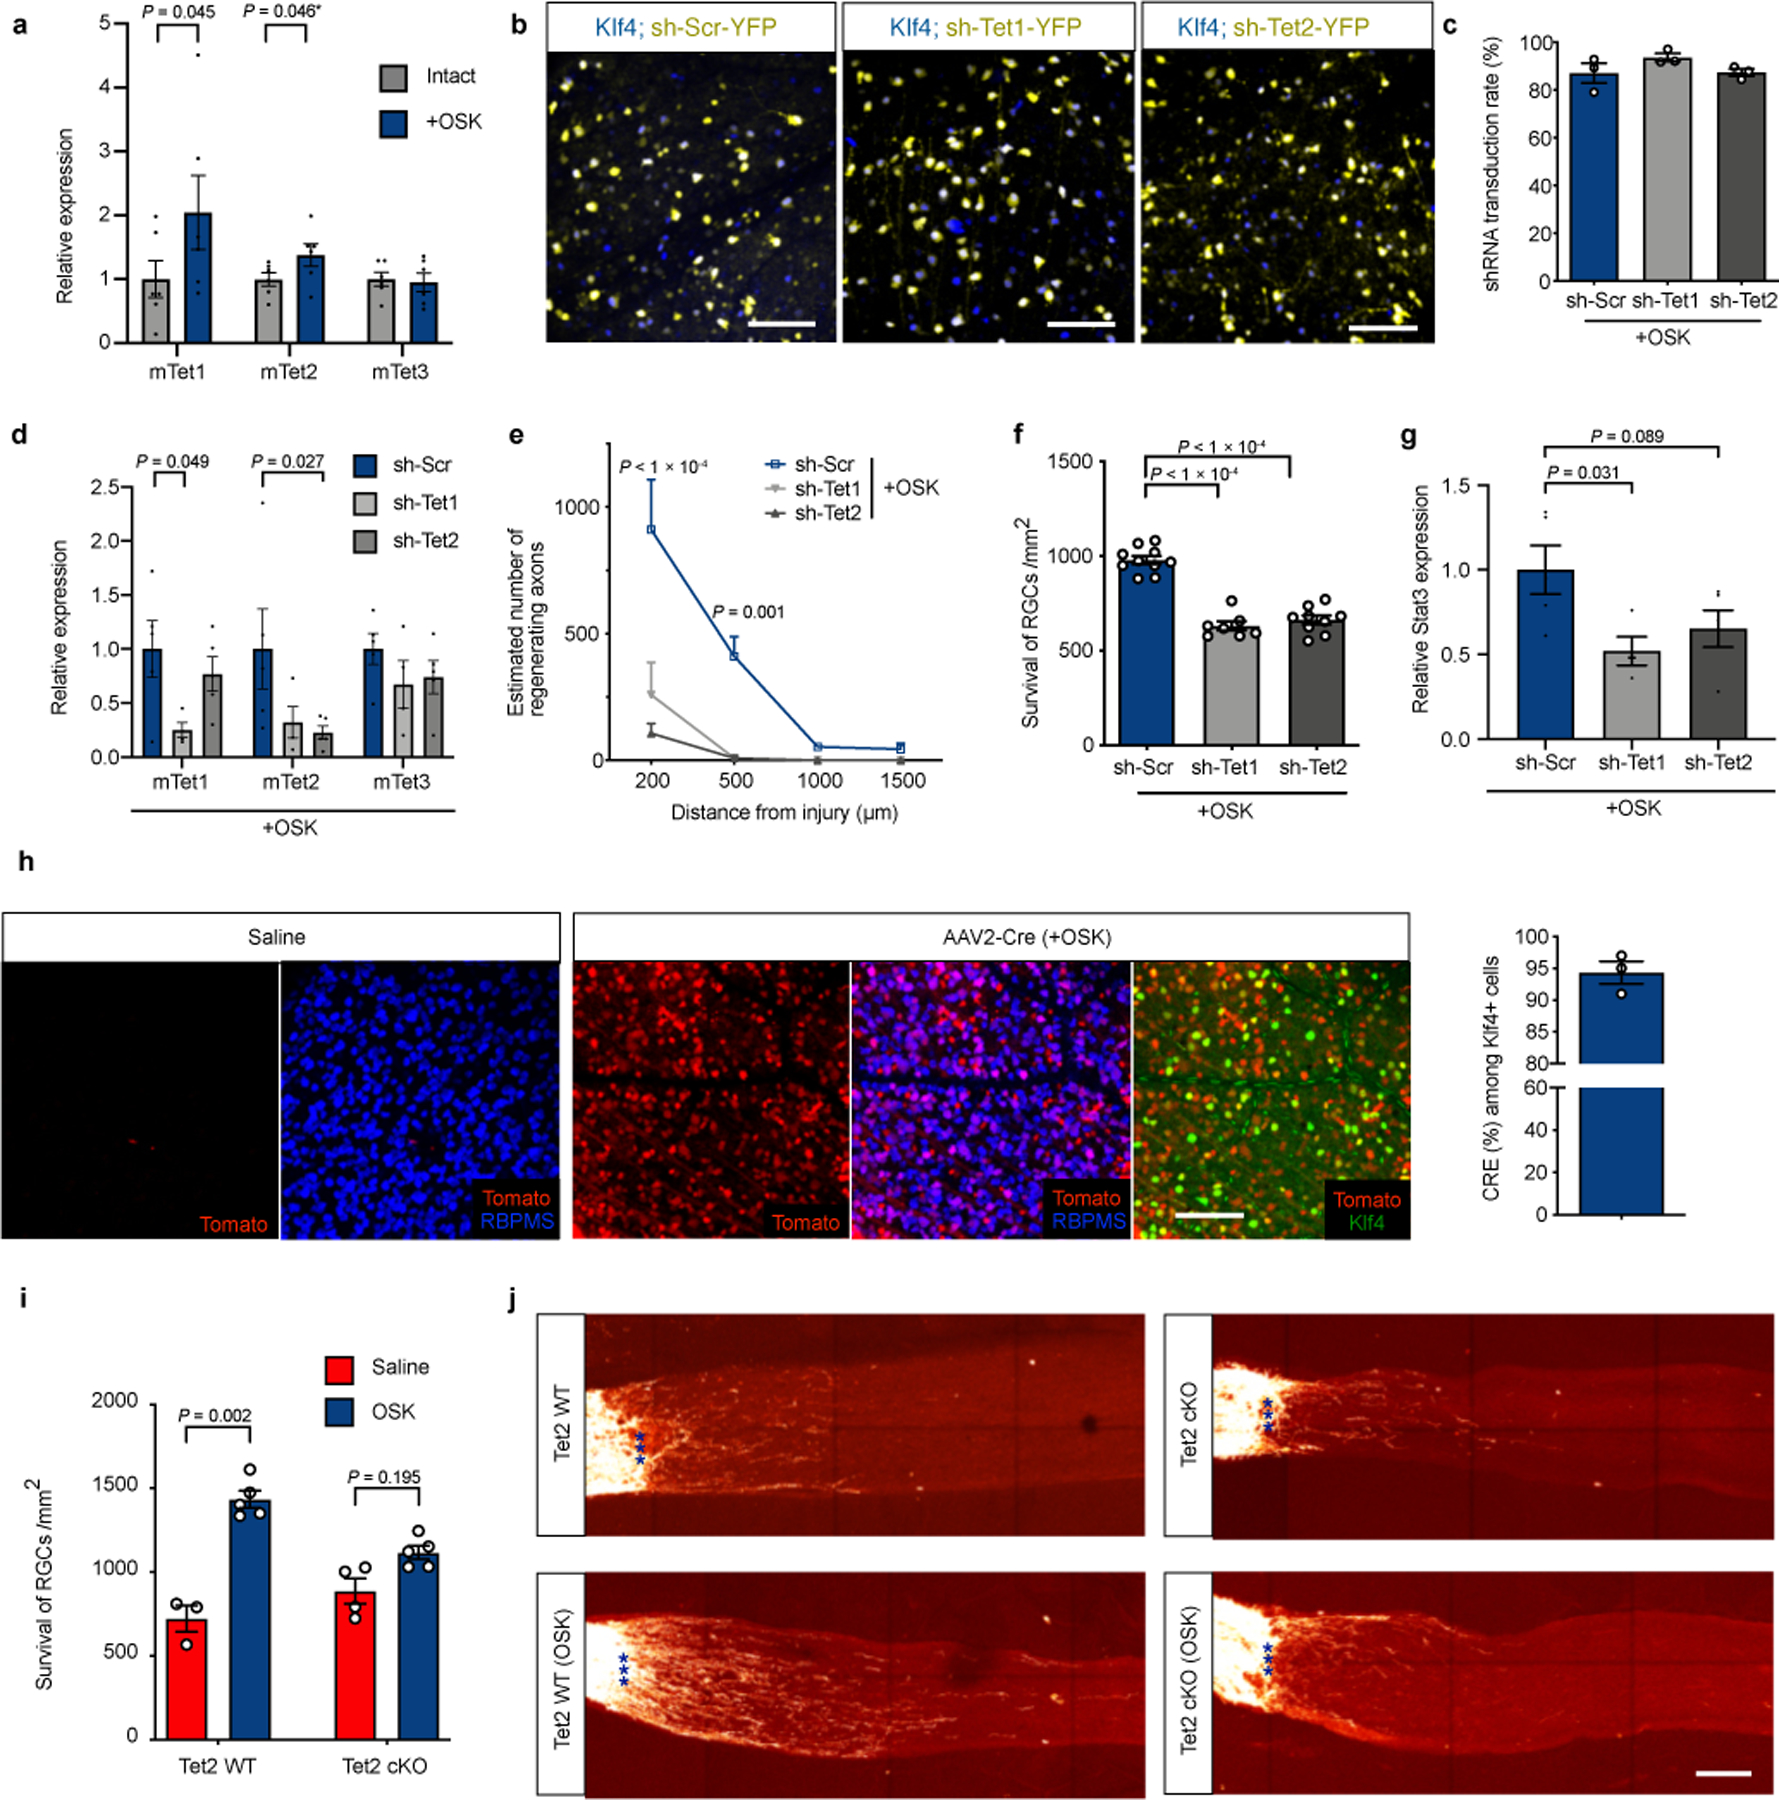
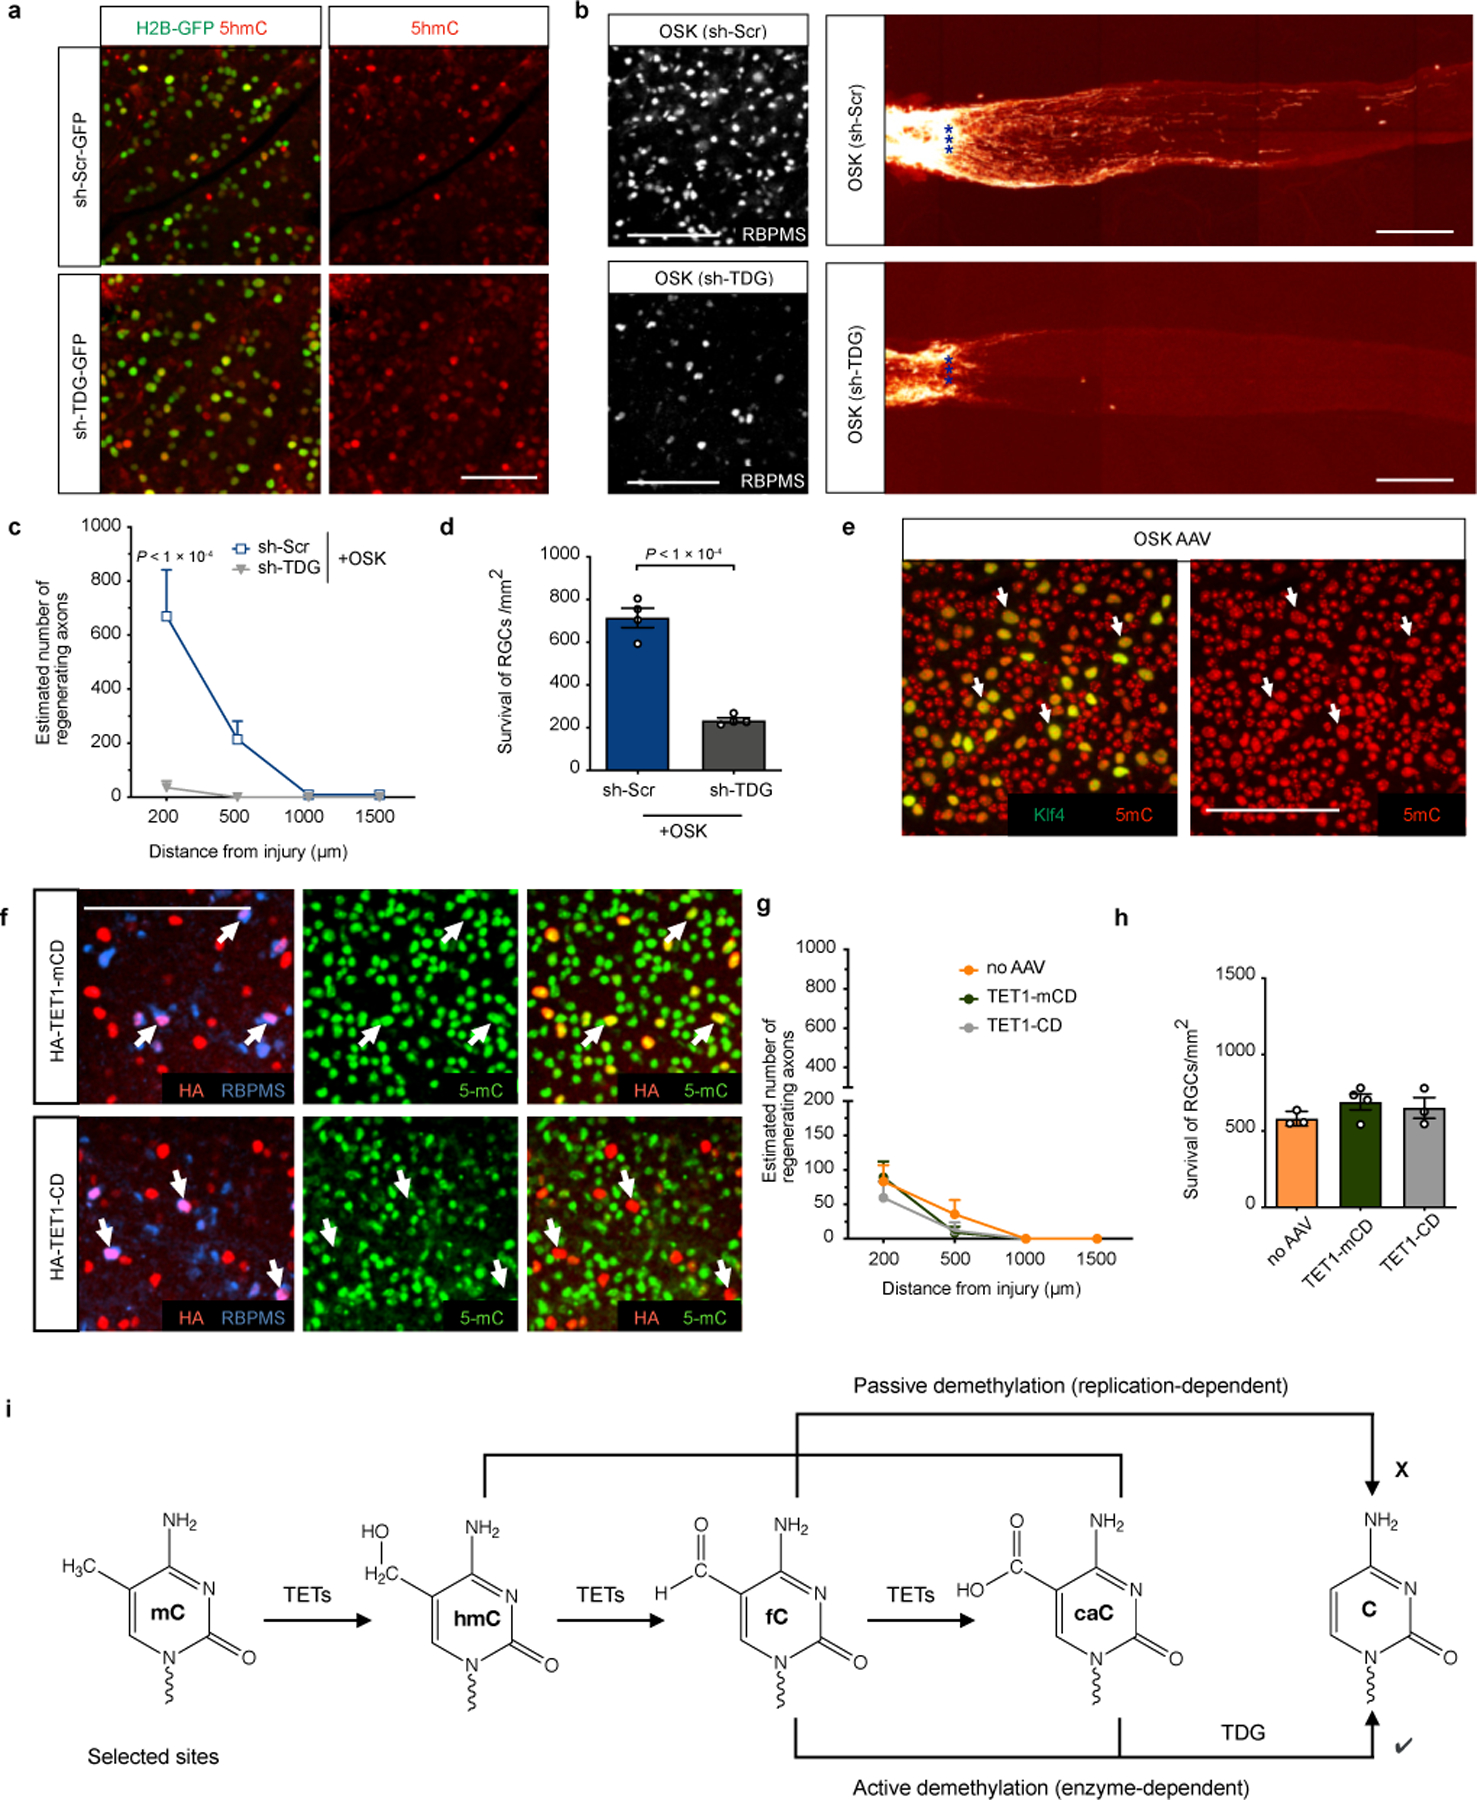
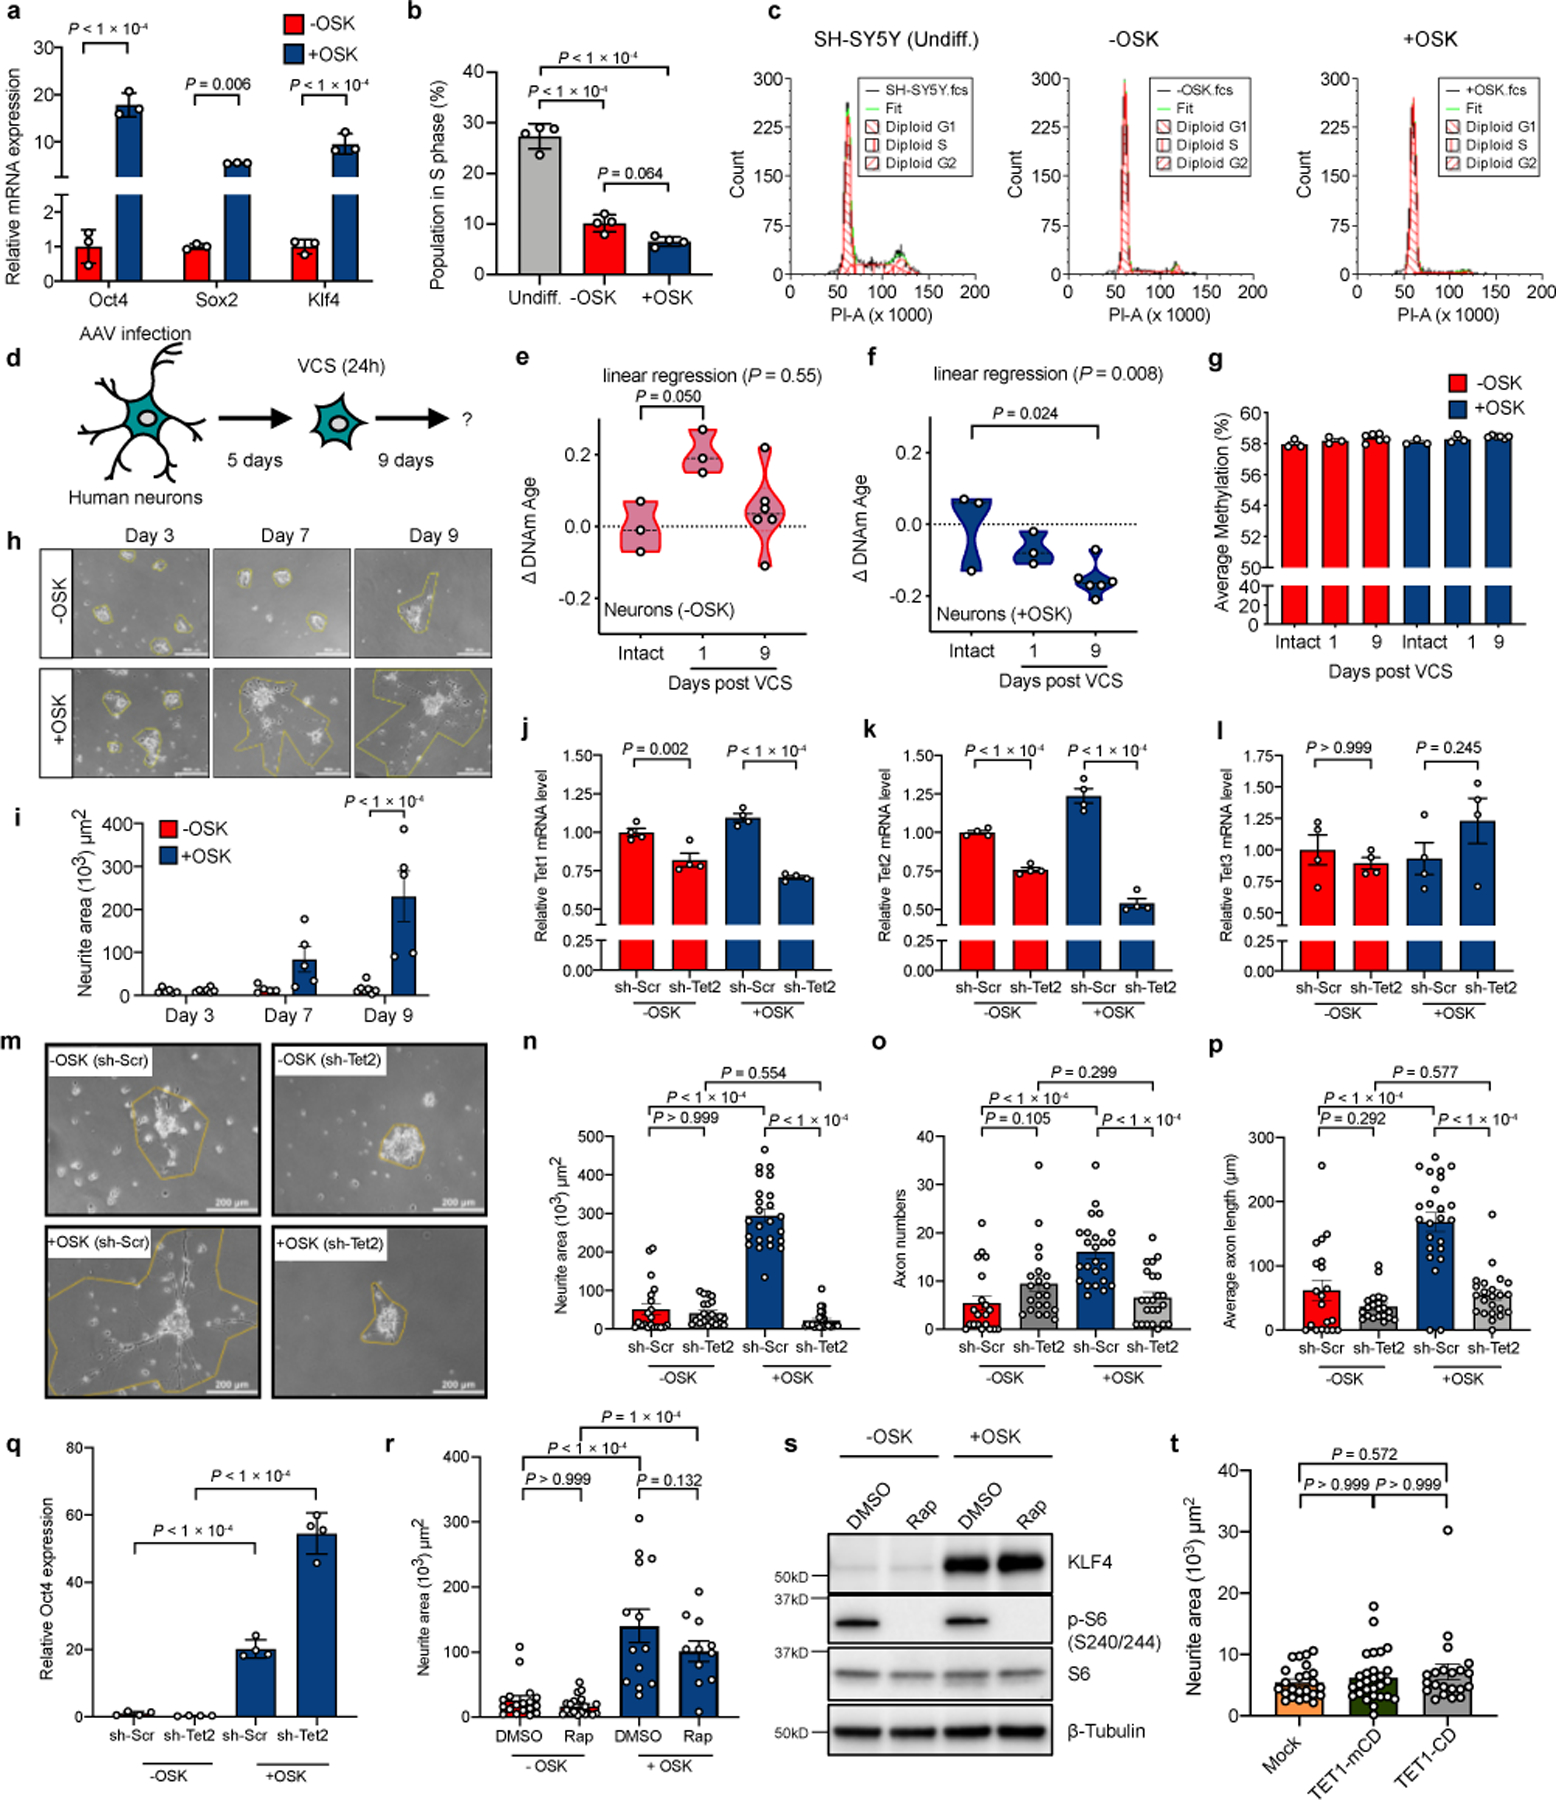
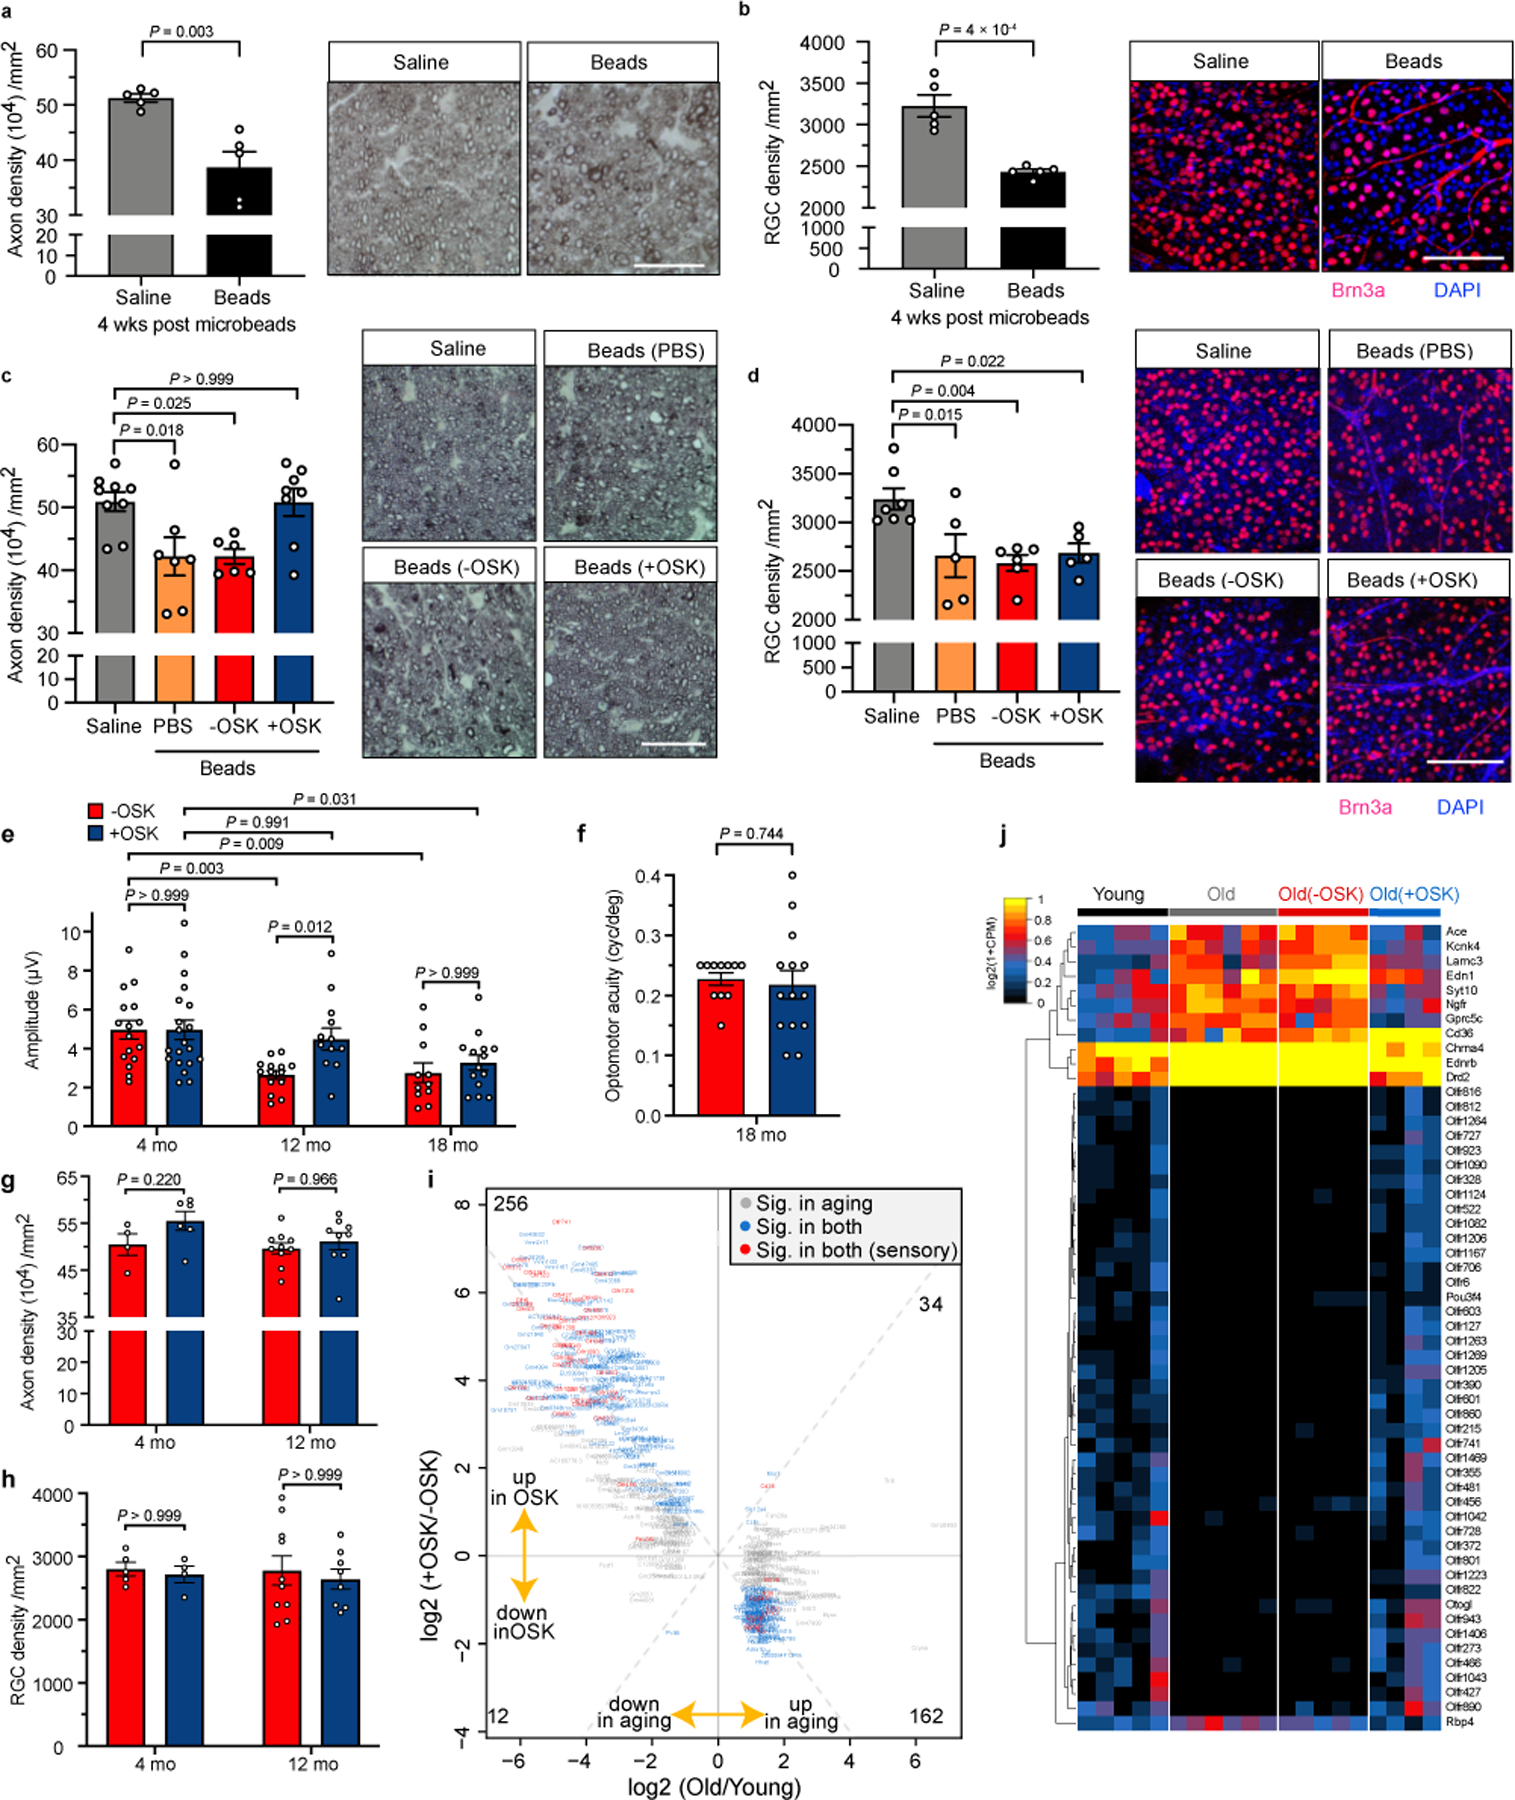
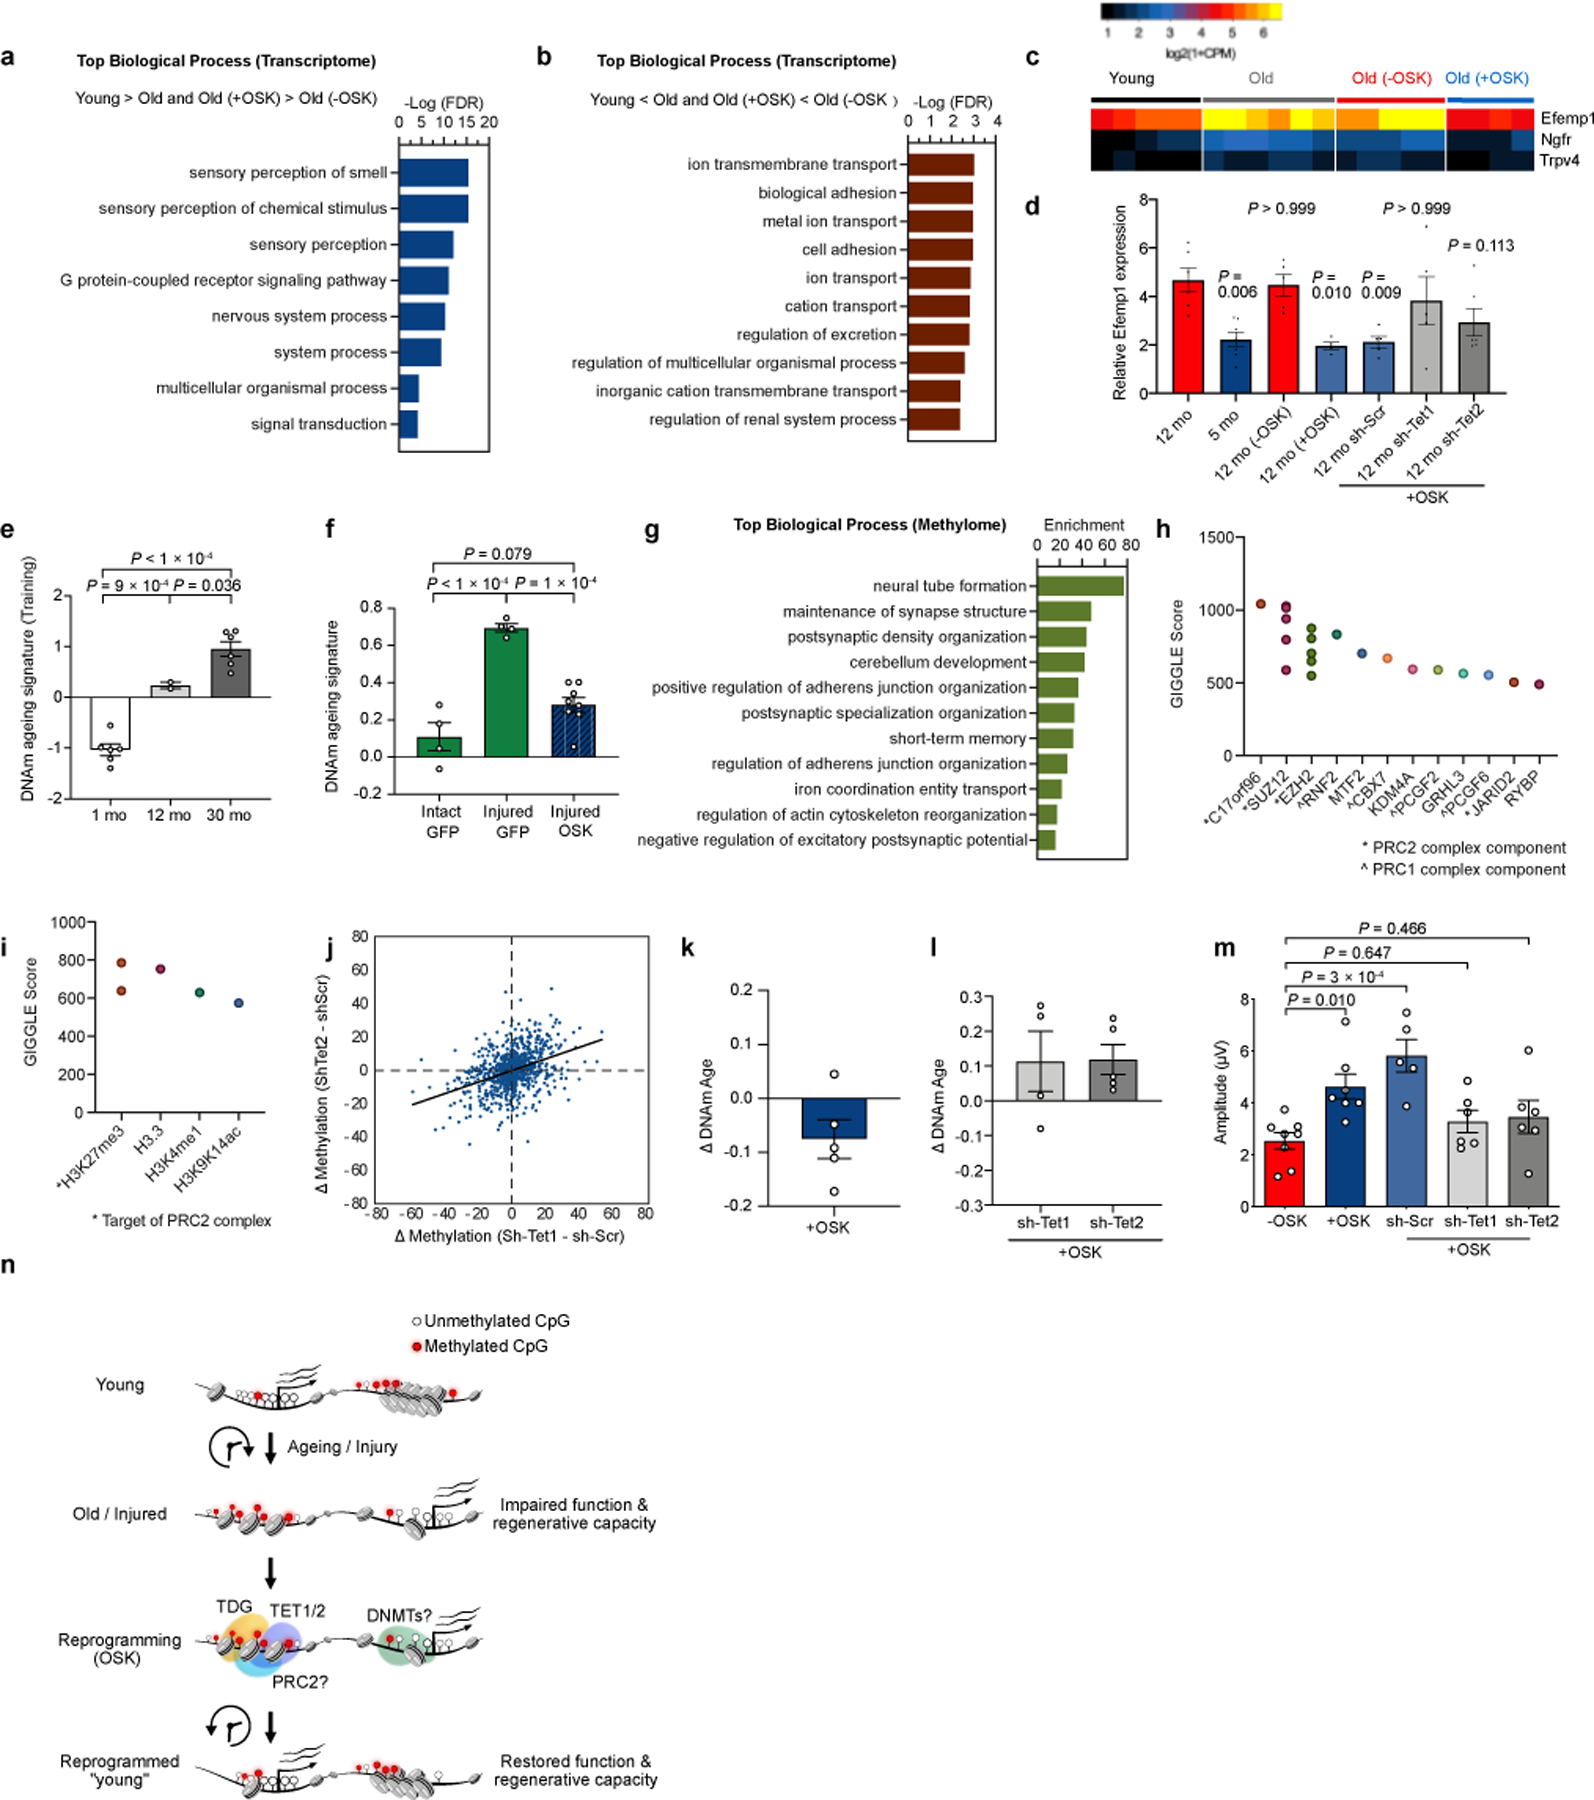
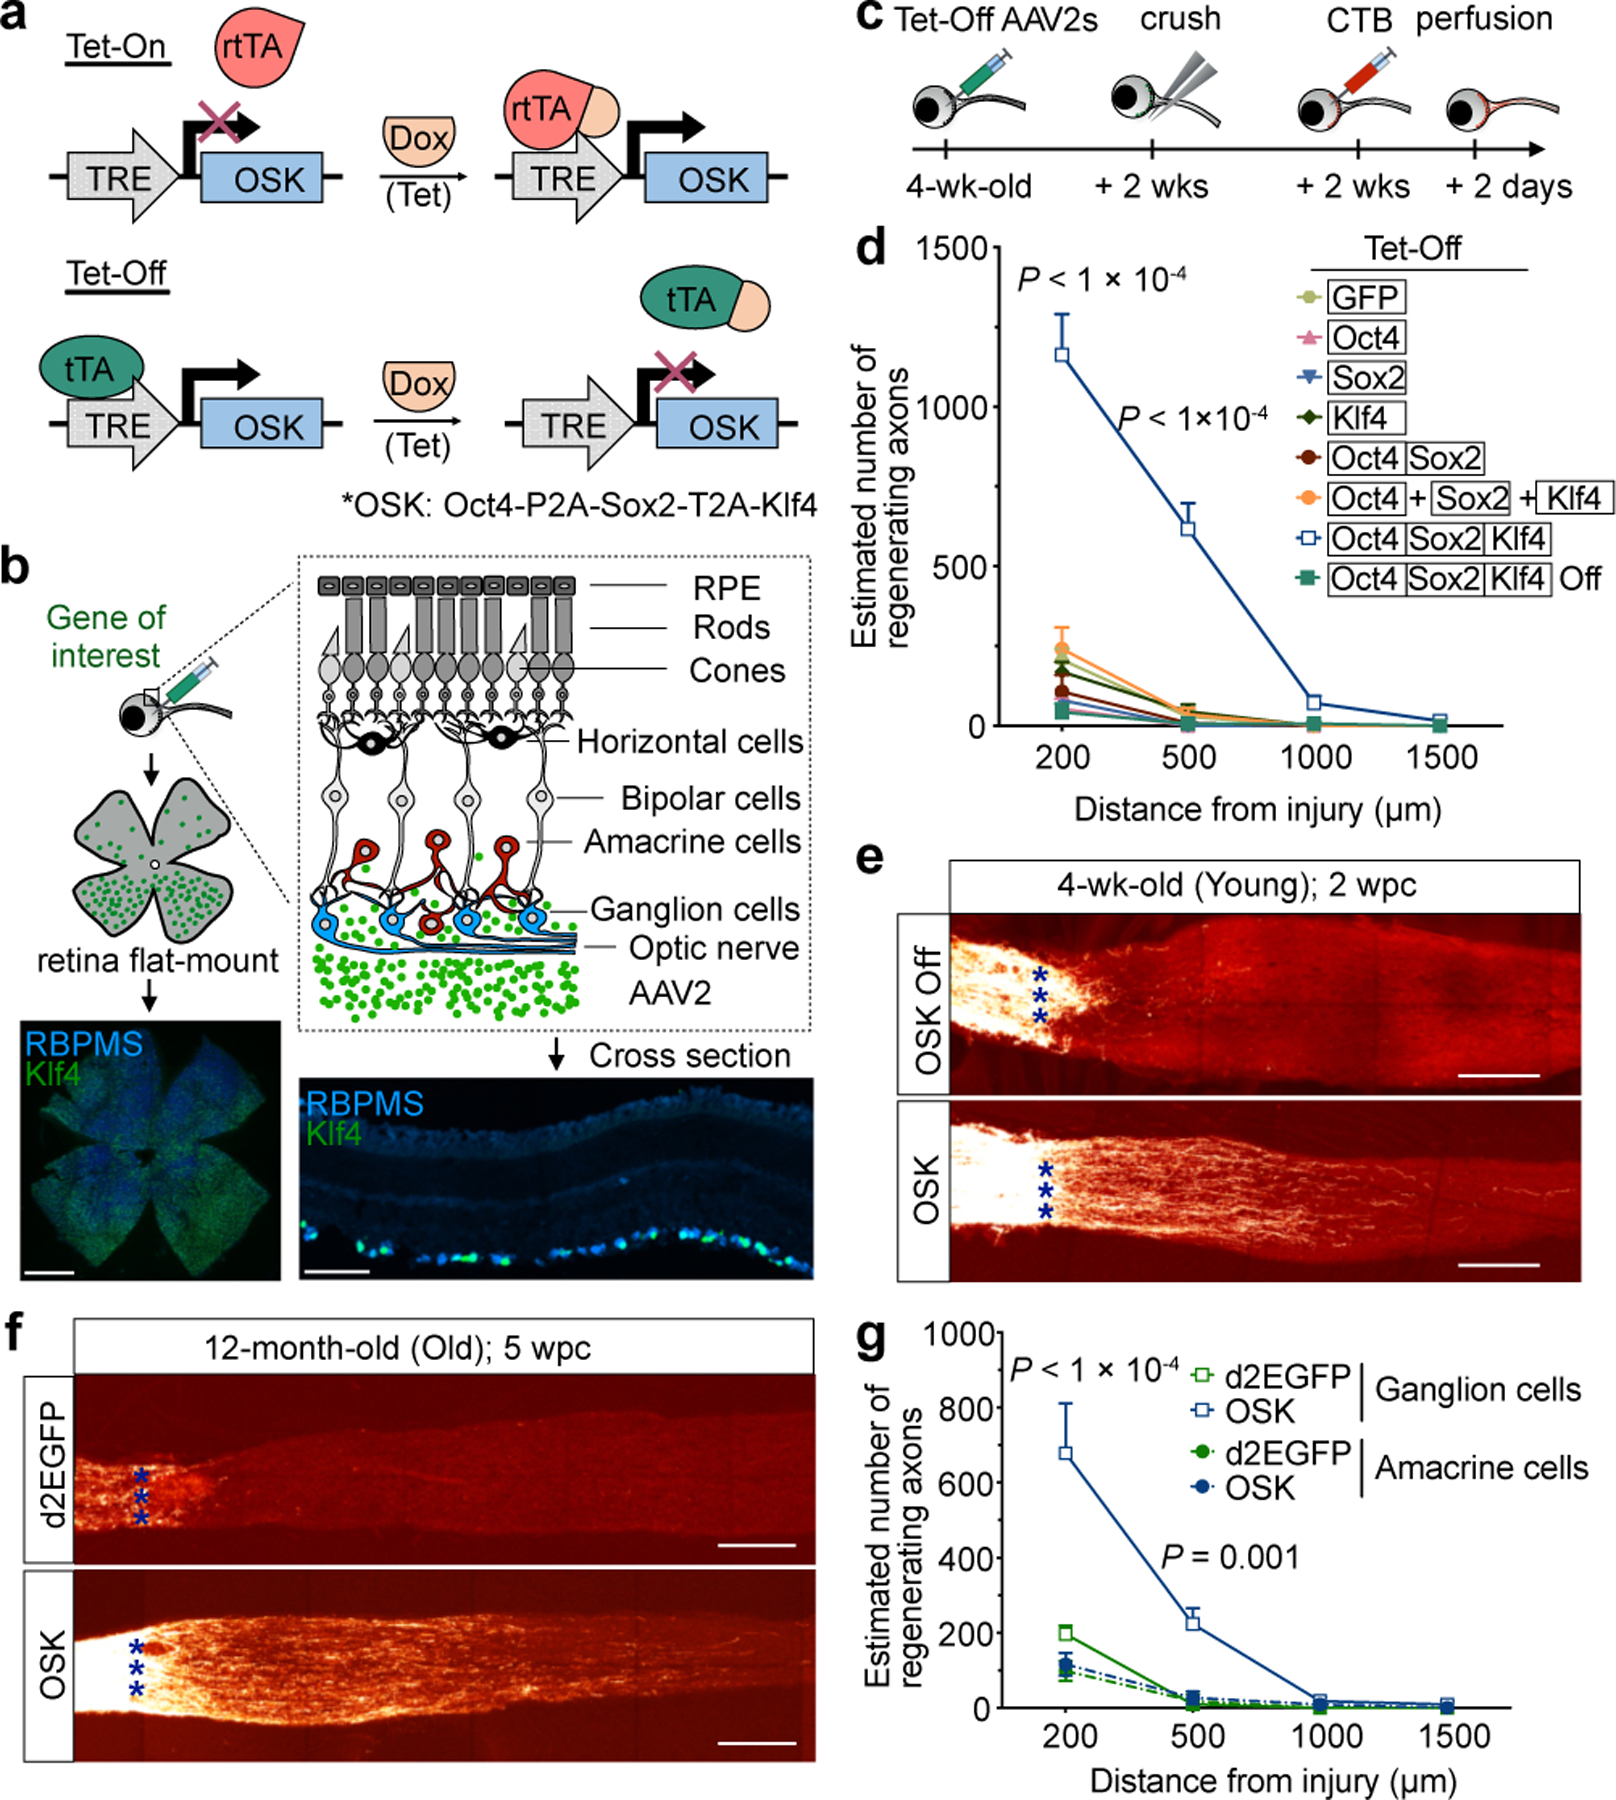
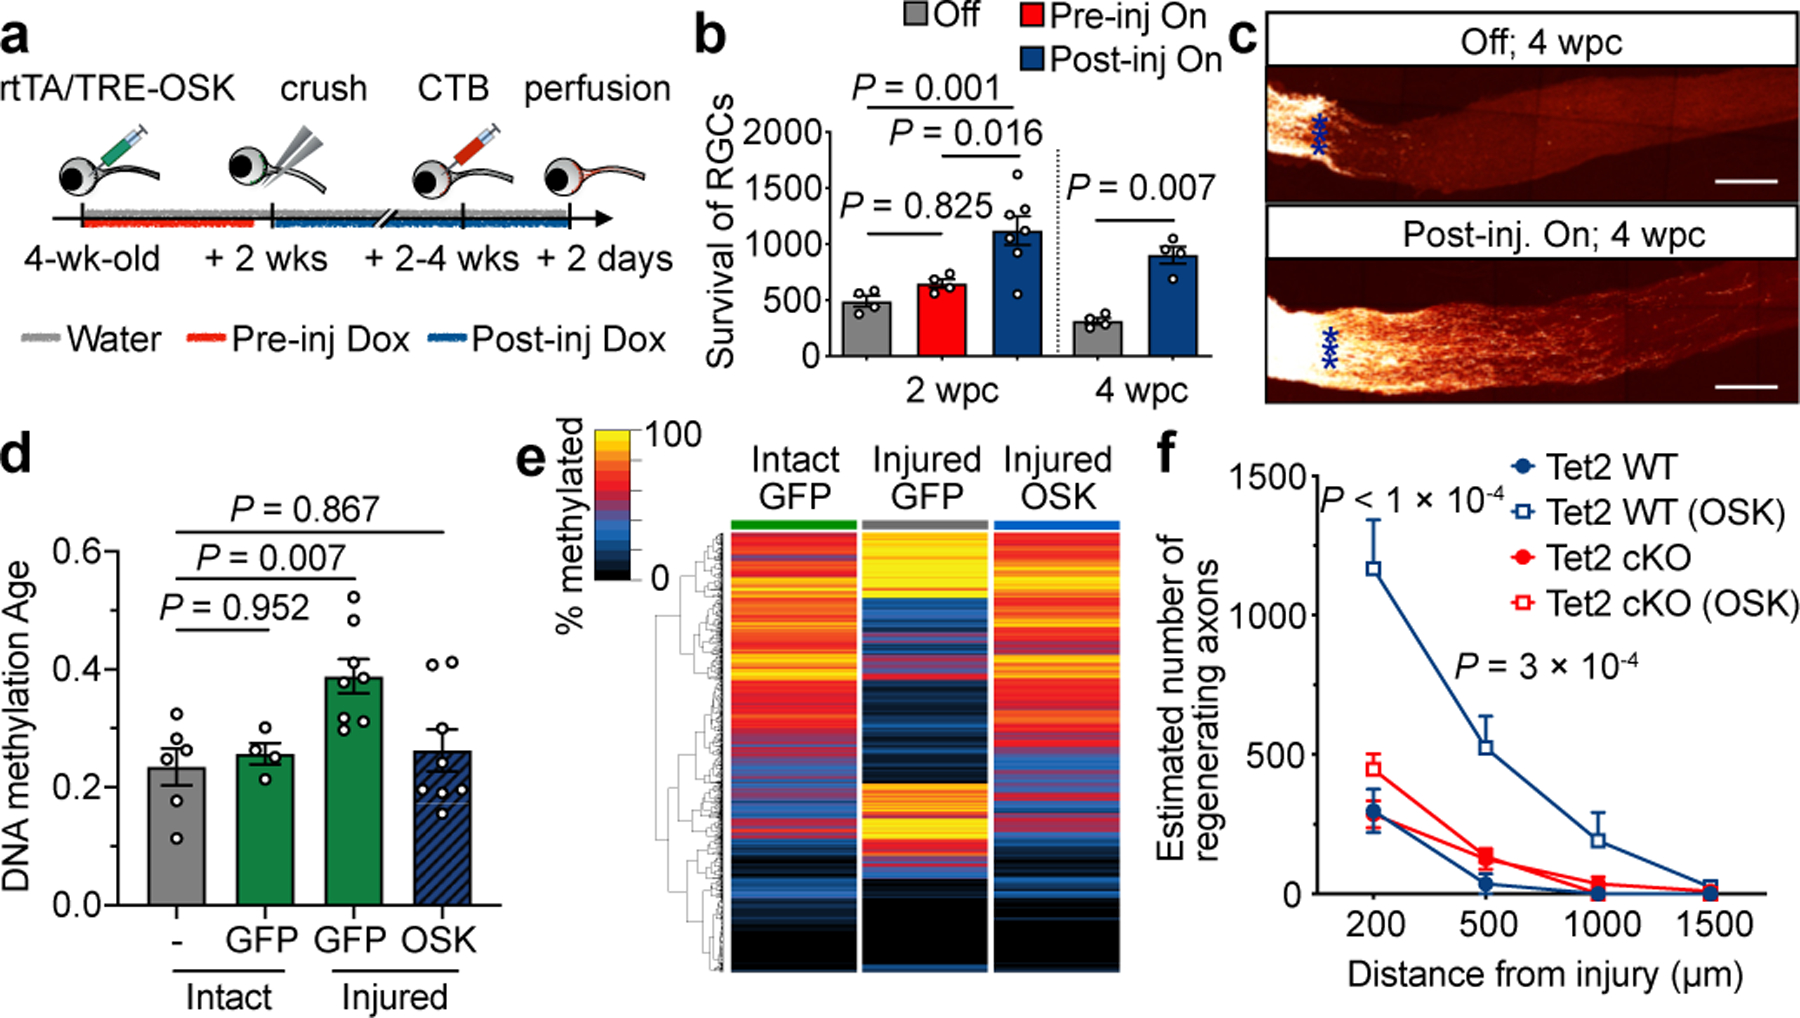
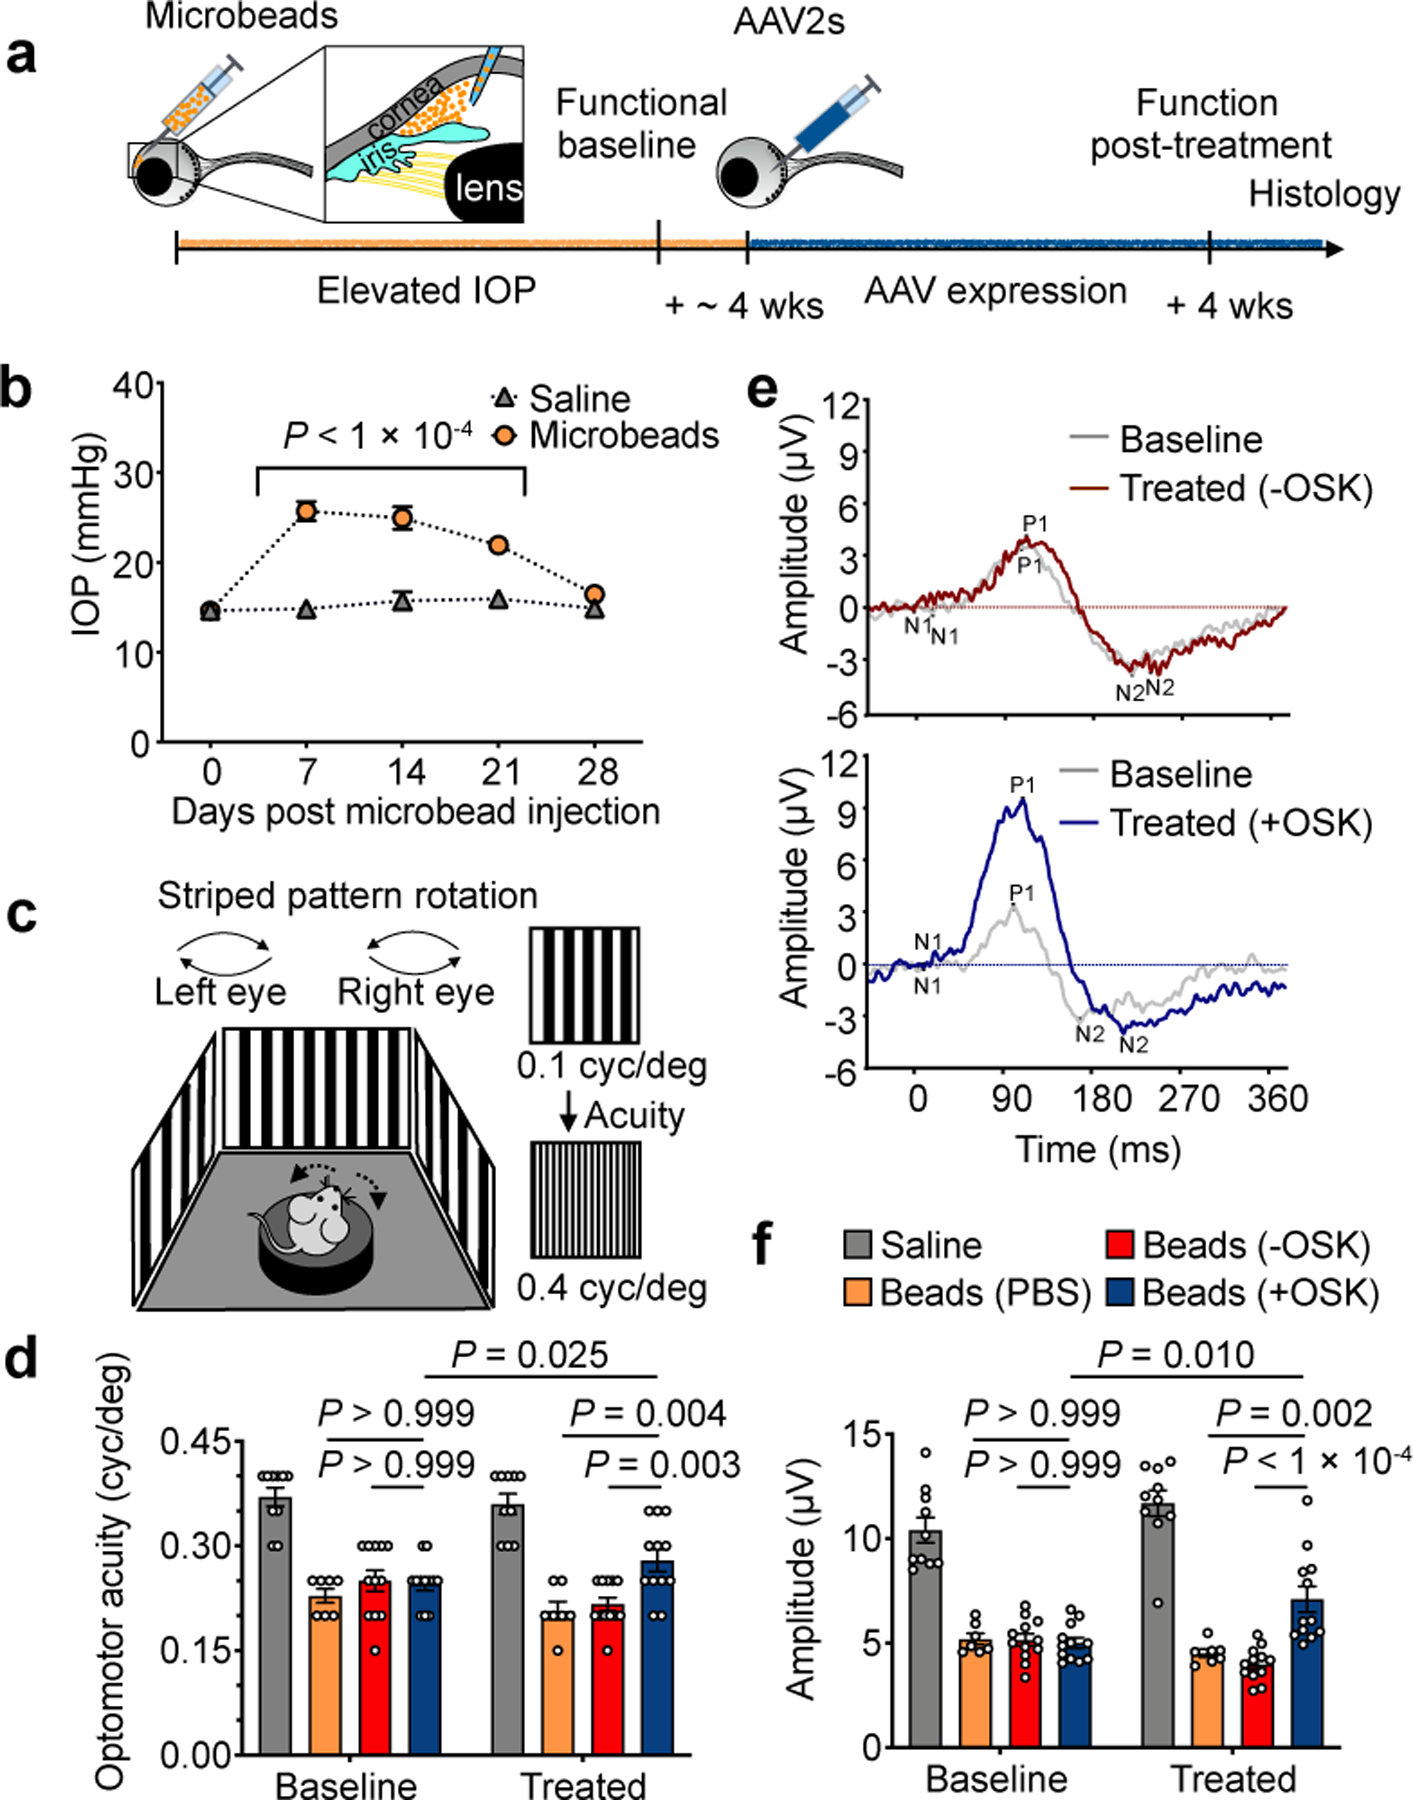
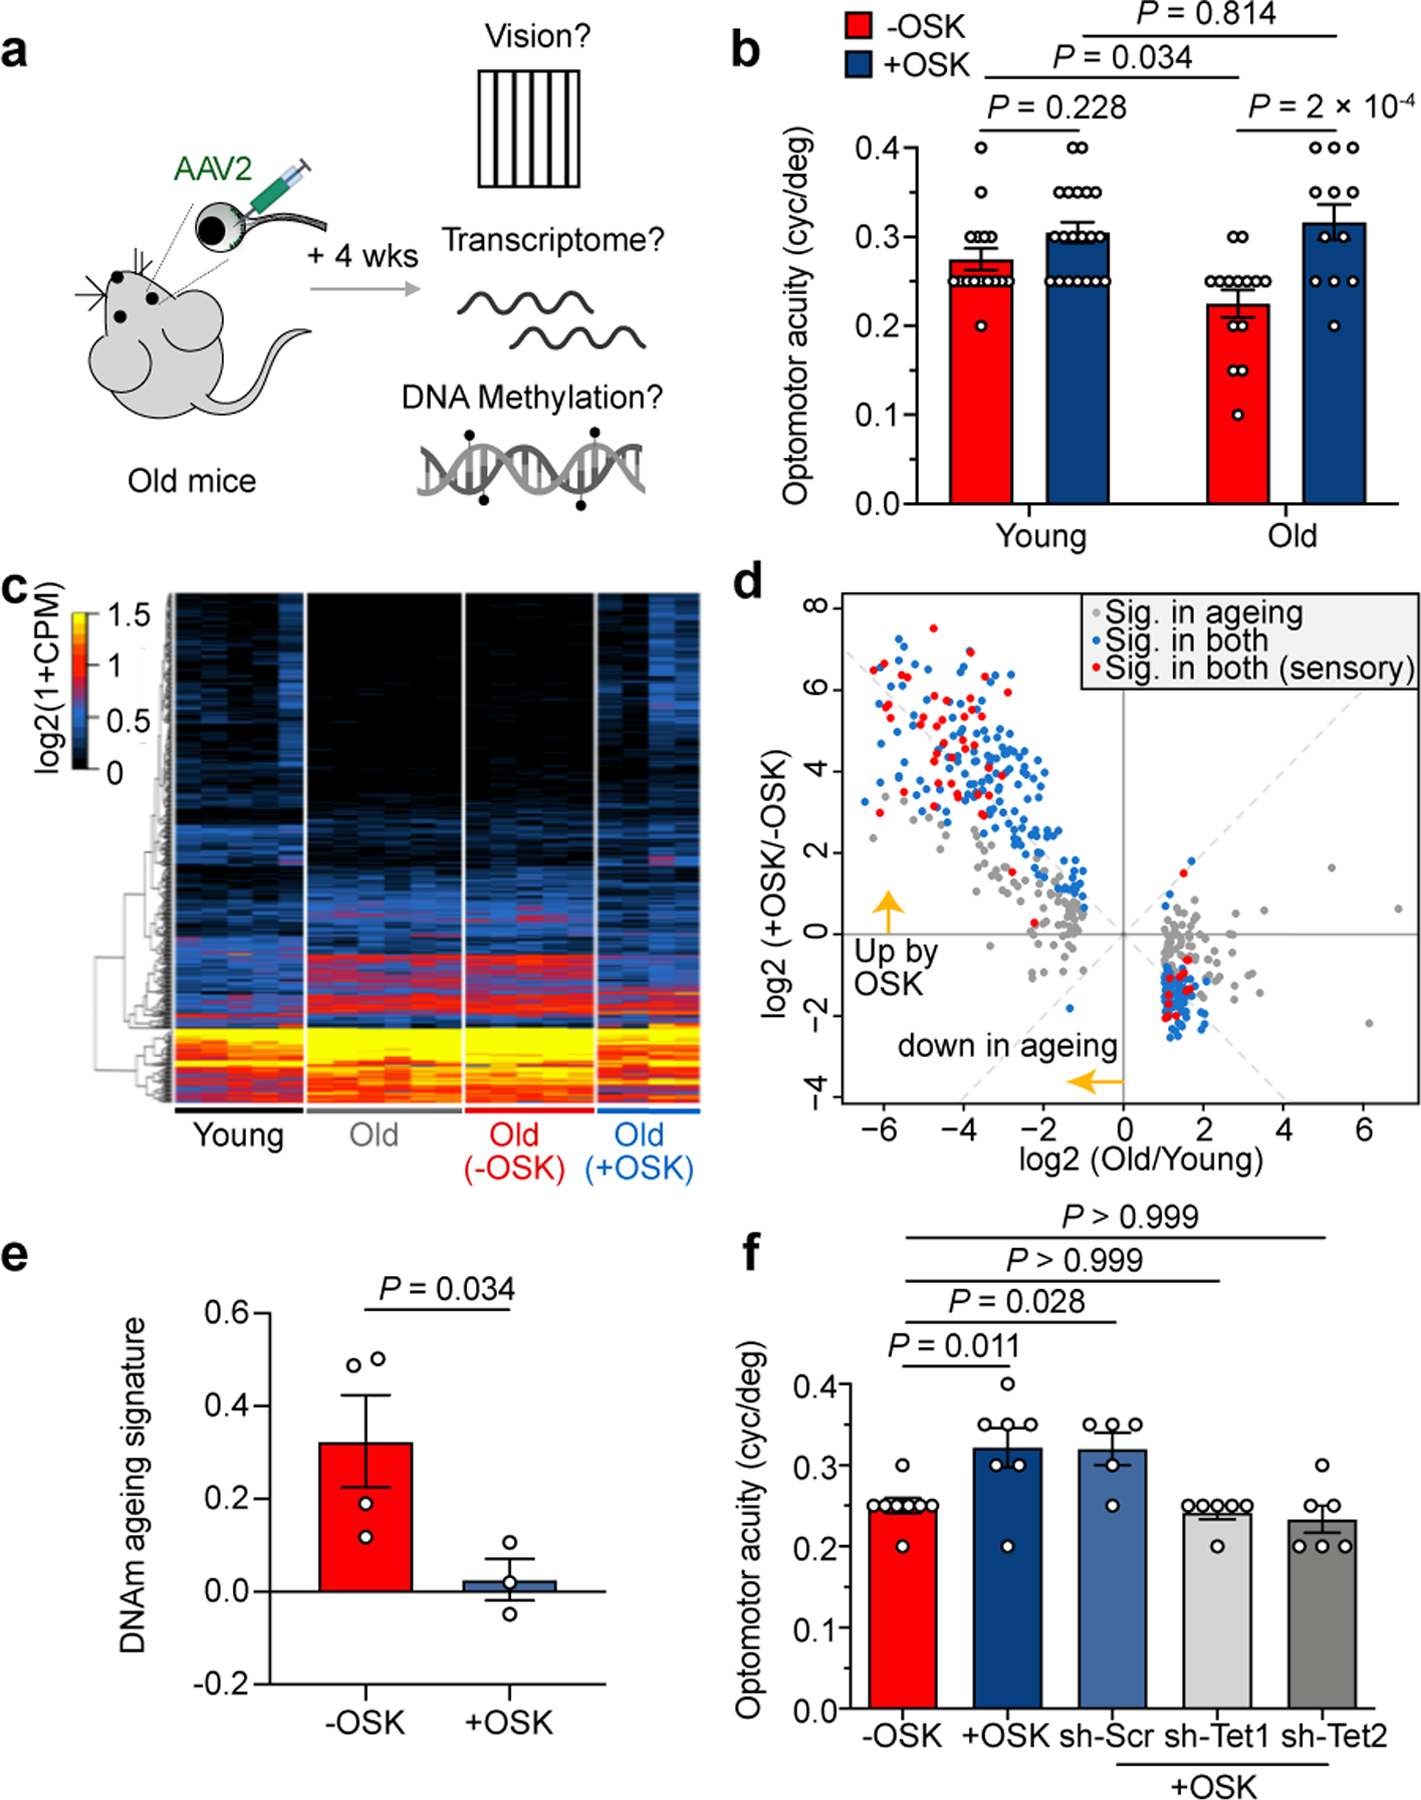
Ageing is a degenerative process that leads to tissue dysfunction and death. A proposed cause of ageing is the accumulation of epigenetic noise that disrupts gene expression patterns, leading to decreases in tissue function and regenerative capacity1-3. Changes to DNA methylation patterns over time form the basis of ageing clocks4, but whether older individuals retain the information needed to restore these patterns-and, if so, whether this could improve tissue function-is not known. Over time, the central nervous system (CNS) loses function and regenerative capacity5-7. Using the eye as a model CNS tissue, here we show that ectopic expression of Oct4 (also known as Pou5f1), Sox2 and Klf4 genes (OSK) in mouse retinal ganglion cells restores youthful DNA methylation patterns and transcriptomes, promotes axon regeneration after injury, and reverses vision loss in a mouse model of glaucoma and in aged mice. The beneficial effects of OSK-induced reprogramming in axon regeneration and vision require the DNA demethylases TET1 and TET2. These data indicate that mammalian tissues retain a record of youthful epigenetic information-encoded in part by DNA methylation-that can be accessed to improve tissue function and promote regeneration in vivo.


Conflict of interest statement

Conflict of interest

D.A.S. is a consultant to, inventor of patents licensed to, board member of and equity owner of Iduna Therapeutics, a Life Biosciences company developing epigenetic reprograming therapies. D.A.S. is an advisor to Zymo Research, an epigenetics tools company. Additional disclosures are at https://genetics.med.harvard.edu/sinclair/people/sinclair-other.php. Y.L., L.A.R. and S.H. are equity owners of Iduna Therapeutics, a Life Biosciences company. D.L.V. is an advisor to Liberty Biosecurity. M.S.B. is a shareholder in MetroBiotech. K.C. is an equity owner in Life Biosciences and affiliates. N.D. and G.M.C. are co-founders of Rejuvenate Bio. Disclosures for G.M.C. can be found at http://arep.med.harvard.edu/gmc/tech.html. M.E.L. is a bioinformatics advisor to Elysium Health. Y.L., N.D. and D.A.S. are inventors on patents arising from this work (WO/2020/069373 and WO/2020/069339), filed by the President and Fellows of Harvard College. The other authors declare no competing interests.

Figures

Extended Data Fig. 1
Extended Data Fig. 1. Effectiveness and safety of OSK reprogramming.
a, Experimental outline for testing the effects of OSKM and OSK on gene expression in fibroblasts from young and old transgenic (TG) mice. b and c, Expression of OSKM (b, R26rtTA; Col1a1OSKM, n = 3 biological replicates each condition) and OSK (c, R26rtTA; Col1a1OKS-mCherry, n = 3 and 8 biological replicates) rescue age-associated transcriptional changes without inducing Nanog mRNA. mo, month(s). qPCR primers are in Supplementary Table 7. d, AAV-ubiquitinC (UbC)-rtTA and AAV-TRE-Luc vectors for measuring tissue distribution. e, Luciferase imaging of WT mice 2 mo after intravenous injection (retro-orbital) of AAV9-UbC-rtTA;TRE-Luc (1.0 × 10¹² gene copies total). Doxycycline (Dox) was delivered in drinking water (1 mg/mL) for 7 days to +Dox mice. f, Luciferase imaging of the eye (Ey), brain (Br), pituitary gland (Pi), heart (He), thymus (Th), lung (Lu), liver (Li), kidney (Ki), spleen (Sp), pancreas (Pa), testis (Te), adipose (Ad), muscle (Mu), spinal cord (SC), stomach (St), small intestine (In), and cecum (Ce) 2 mo after retro-orbital injection of AAV9-UbC-rtTA;TRE-Luc followed by treatment with Dox for 7 days. The luciferase signal was primarily in the liver. Imaging the same tissues with a longer exposure time (right panel) with the liver removed, revealing a strong signal in the pancreas. g, Toxicity and safety studies in young and old mice after in vivo delivery of OSK-expressing AAVs. For h and i, at age 5 mo, mice were intravenously injected with AAV9-rtTA;TRE-OSK (3 and 7 × 10¹¹ gene copies each AAV/mouse). After 1 mo, mice remained untreated (−Dox) or treated with Dox (+Dox) for 18 mo. WT mice were not injected with AAV. For jn, at age 21 mo, mice were injected intravenously with 5 × 10¹¹ gene copies of AAV9-rtTA and 7 × 10¹¹ of either AAV9-TRE-GFP (GFP) or TRE-OSK (OSK) per mouse. After 1 mo, GFP, OSK, and non-injected WT mice were treated with Dox for 10 mo. h, Sox2 expression in the liver of WT mice 2 mo post-intravenous delivery of OSK-expressing AAV9s with or without a mo of Dox induction, and in the liver of OSK transgenic (TG) mice, 129S1/C57BL/6J mixed background. Uncropped scans are shown in Supplementary Figure 1. i, Body weight of WT mice, OSK transgenic mice, and AAV-mediated OSK-expressing mice with or without doxycycline in the first 4 weeks (left panel, n = 5, 3, 6, 4, 4, and 3 mice) and following 17 mo (right panel, n = 5, 3, 6, and 4 mice). j, Examples of liver sections from WT or GFP mice showing the infection of AAV9. Scale bar, 100 µm. k, Klf4 and GFP protein levels in livers of WT, GFP, and OSK mice at 32 mo of age. * indicates high OSK expression, + indicates induced protein expression levels in livers of OSK transgenic mice. Uncropped scans in Supplementary Figure 1. l, Tumor incidence in WT, GFP, and OSK mice at age 32 mo after 10 mo of Dox induction. m and n, Liver tumor scores (m) and white blood cell counts (n) for WT, GFP, and OSK groups at age 32 mo after 10 mo of Dox induction. OSK mice were defined as either high expression (indicated by * in panel k) or low expression (WT, n = 11 mice; GFP, n = 10 mice; OSK high, n = 7 mice; OSK low, n = 8 mice). For m and n, there was no difference between the groups using one-way ANOVA. All data are presented as mean ± s.e.m.
Extended Data Fig. 2
Extended Data Fig. 2. Normal architecture and absence of tumors in the retina after long-term OSK expression mediated by AAV2 delivery.
a and b, Representative wholemount retina display of RBPMS (a RGC marker) and Klf4 immunofluorescence showing (a) expression from the AAV2 Tet-Off system can be turned off by doxycycline in drinking water (2 mg/mL, 3 d), and (b) expression from the AAV2 Tet-On system can be turned on by doxycycline (2 mg/mL, 2 d). Scale bars in a and b, 1 mm. n = 4 retinas each condition. c, Corresponding retinal wholemount images stained for RBPMS and Klf4 are shown for each group tested (i) no injection, n = 6; (ii) −OSK (intravitreal injection of AAV2-rtTA;TRE-OSK without Dox induction), 10 mo post-injection, n = 3; (iii) +OSK (intravitreal injection of AAV2-tTA;TRE-OSK with Dox induction), 15 mo post-injection, n = 6. All retinas are from 16-month-old animals, showing similar expression within the group. Scale bar, 100 µm. d, Volume intensity projection of en-face OCT (optical coherence tomography) retinal image with a white line indicating the location of e. e, Representative retinal cross section B-scan images. White box indicates the location of the high magnification scans in f (retinal layers: GCL = ganglion cell layer, INL = inner nuclear layer, ONL = outer nuclear layer, and choroid). Videos of complete retinal cross section B-scan images of the entire globe are in Supplementary Videos. g, Low- and high-power representative images of H&E-stained cross-sections of corresponding eyes, verifying retinal layers. h, Quantitative measurements of retinal thickness, there was no difference between the groups at any location using two-way ANOVA with Bonferroni correction (n = 6, 3, and 6, respectively). i, Immunosuppressed NOD scid gamma mice received a subretinal injection of ~10,000 human retinoblastoma tumor cells. The OCT image shows a small retinal tumor and increased retinal thickness 14 days post-injection, demonstrating the ability of the OCT scan to detect tumors, * Rb (retinoblastoma).
Extended Data Fig. 3
Extended Data Fig. 3. Polycistronic OSK induces long-distance axon regeneration post-injury without RGC proliferation.
a, Proliferating cells in the optic nerve (e.g. glial cells) in BrdU-injected mice as a positive control (n = 2 nerves). BrdU staining co-localized with Ki67, a proliferation marker. b, Representative Retina wholemount staining shows OSK-expressing RGCs do not stain for BrdU the first or second week after crush injury, n = 4 retinas. Scale bars, 100 µm. c, Imaging of optic nerves showing regenerating and sprouting axons with or without OSK AAV treatment, 12 weeks post-crush (wpc), n = 2 nerves. Scale bars, 200 µm. d, Whole nerve imaging showing CTB- labeled regenerative axons at 16 wpc in wild-type mice with intravitreal injection of AAV2-tTA;TRE-OSK (n = 2 nerves). Scale bars, 200 µm. e, Survival of RBPMS-positive cells in the RGC layer transduced with different AAV2s, 16 dpc (n = 6, 4, 4, 4, 4, 4, 8, and 4 eyes). All data are presented as mean ± s.e.m. f and g, Representative immunofluorescence (f) and sub-population proportion (g) of wholemount retinas transduced with a polycistronic AAV vector expressing Oct4, Sox2, and Klf4 in the same cell. White arrows designate triple-positive cells. n = 3 retinas. Scale bars, 100 µm. h and i, Immunofluorescence (h) and sub-population proportion (i) of wholemount retinas transduced with AAVs separately encoding Oct4, Sox2, and Klf4. Red, blue, and green arrows designate single-positive cells, with a white arrow marking a triple-positive cell, and other arrows marking double-positive cells. n = 3 retinas. Scale bar, 100 µm. One-way ANOVA with Bonferroni correction in e, with comparisons to d2EGFP shown.
Extended Data Fig. 4
Extended Data Fig. 4. Regenerative and pro-survival effects of OSK are RGC-specific and cell-autonomous.
a, Effect of OSK expression on RGC survival in young (1 mo, n = 8), adult (3 mo, n = 5), and old mice (12 mo, n = 8) after optic nerve crush injury compared to expression of d2EGFP as a negative control (n = 6, 5, and 6, respectively). b, Axon regeneration after OSK expression compared to d2EGFP controls in young (1 mo, n = 5 and 6), adult (3 mo, n = 6), and old (12 mo, n = 4 and 5) mice, 2 wpc. c, RGC number of 12-month-old mice in intact, 2 or 5 wpc retinas with GFP (AAV2-tTA;TRE-d2EGFP, n = 7, 6, and 6, respectively) or OSK (AAV2-tTA;TRE-OSK, n = 5, 8, and 6, respectively) expression. d, Axon regeneration in 12-month-old mice with OSK AAV or control AAV (d2EGFP) treatment, 5 wpc (n = 5 nerves). e, Schematic of retinal structure showing Vglut2-Cre mice selectively expressing Cre in excitatory neurons such as RGCs, while Vgat-Cre mice selectively express Cre in inhibitory amacrine and horizontal cells. f, Schematic of the FLEx (flip-excision) CRE-switch system. AAV2-FLEx-tTA is inverted by Cre to express tTA and therefore induces OSK only in Cre-positive cells. g, Confocal image stack demonstrating delivery of AAV2-FLEx-tTA;TRE-OSK to intact Vglut2-Cre transgenic retinas, resulting in RGC-specific OSK expression (upper) and robust axon regeneration in the optic nerve (lower). White arrows indicate RBPMS+ (AP2-)-labeled RGCs that express Klf4 (green). n = 4 independent replicates. h, Confocal image stack demonstrating delivery of AAV2-FLEx-tTA;TRE-OSK to intact Vgat-Cre transgenic retinas, resulting in amacrine-specific OSK expression (upper) and poor axon regeneration in the optic nerve (lower). White arrows indicate AP2+ (RBPMS-)-labeled amacrine cells that express Klf4 (green). n = 4 independent replicates. i, Representative image of AAV-expressing or non-expressing RGCs in intact and crushed retinas 2 wpc with AAVs expressing d2EGFP or OSK. d2EGFP: AAV2-tTA;TRE-d2EGFP, n = 6 retinas; OSK: AAV2-tTA;TRE-OSK, n = 8 retinas. j, RGC survival rate (crushed / intact) of d2EGFP- (n = 6 eyes) or Klf4-expressing cells (n = 8 eyes) and their surrounding non-expressing cells indicating a cell-autonomous pro-survival effect of OSK-expressing RGCs after crush, 2 wpc. k, Frequency of d2EGFP- or Klf4-positive RGCs pre- or 2 weeks post-injury (n = 4, 6, 6, and 8 eyes). Two-way ANOVA with Bonferroni correction in ad, j; one-way ANOVA with Bonferroni correction in k. Scale bars, 100 µm in g, h, and i. All data are presented as mean ± s.e.m.
Extended Data Fig. 5
Extended Data Fig. 5. OSK activates Stat3 in the absence of mTOR activation or global demethylation.
a, Representative images of retinal wholemounts transduced with AAV2-tTA (−OSK) or AAV2-tTA;TRE-OSK (+OSK) in the presence or absence of crush injury after 3 days. Retinal wholemounts immunostained for pStat3, Klf4, and RBPMS. n = 2 retinas each condition. b, Representative images of retinal wholemounts transduced with d2EGFP- or OSK-encoding AAV2 in the presence or absence of a crush injury. Retinal wholemounts immunostained for RBPMS and mTOR activation marker phosphorylated S6 (pS6). n = 4 retinas each condition. c, Percent of pS6-positive RGCs in intact and crushed samples (n = 4 retinas each condition). d, Representative images of d2EGFP in retina expressed from the Tet-On AAV system. No GFP expression was observed in the absence of Dox. GFP expression reached peak levels 2 days after Dox induction and remained at a similar level at day 5 after induction. n = 2 retinas each condition. e, Representative images of retinal d2EGFP expression using the Tet-Off AAV system with various durations of Dox treatments (2 mg/mL). Once pre-treated with Dox to suppress expression (on Dox), GFP was sparse even on day 8 after Dox withdrawal, lower than peak expression (Never Dox). n = 2 retinas each condition. f, Axon regeneration at 2 or 4 wpc in response to OSK induction either pre- or post-injury (n = 4, 5, 5, 4, and 4 eyes, respectively). g, Correlation between ribosomal DNAm age (mo) and chronological age (mo) of sorted mouse RGCs (1 mo, n = 6; 12 mo, n = 2; 30 mo, n = 5), with the light blue region representing the confidence interval. P value of the linear regression is calculated by two-sided F-test of overall significance. In agreement with previous studies, DNAm age estimates of neurons tend to be lower than their chronological age but remain correlated (see Methods). h, Average DNA methylation levels across the mouse genome in RGCs from different ages and treatments, based on 703,583 shared CpG sites from RRBS of all samples (combined strands), n = 6, 8, 2, 8, 6, 4, 8, 8, 6, 5, 6, 4, and 5, respectively. i, Correlation of DNAm at each CpG site versus age (x-axis; 1 mo, 12 mo, 30 mo) and versus injury (y-axis; intact, injured GFP). Heatmap represents the number of sites located in each block of value coordinates. Pearson’s correlation coefficient, r = 0.34, P < 1e−200. j, Hierarchical clustered heatmap of methylation levels of 4,106 CpGs that significantly changed in RGCs after crush injury (Intact vs Injured GFP, q < 0.05) and the effect of OSK. k, Top biological processes associated with the 698 CpGs that were significantly altered by both injury and OSK. Two-way ANOVA with Bonferroni correction in c and f. Scale bars, 100 µm in a, b, d, e. All data are presented as mean ± s.e.m.
Extended Data Fig. 6
Extended Data Fig. 6. Protective and regenerative effect of OSK is dependent on Tet1/2.
a, Mouse Tet mRNA levels with or without OSK expression in RGCs (n = 6 biological replicates each condition). * Unpaired one-tailed t-test. b, Representative images of retinal wholemounts transduced with AAV2-tTA;TRE-OSK in combination with a AAV2-shRNA-YFP (yellow fluorescent protein) having either a scrambled sequence (sh-Scr) or a hairpin sequence to knockdown Tet1 (sh-Tet1) or Tet2 (sh-Tet2) expression, at titer ratio 5:5:1. Retinal wholemounts immunostained for Klf4. n = 3 retinas each condition. c, Quantification of shRNA-YFP AAV transduction in OSK-expressing RGCs (n = 3 retinas each condition). d, Mouse Tet mRNA levels with sh-Scr (n = 5), sh-Tet1 (n = 4), or sh-Tet2 (n = 5) YFP AAV2 in RGCs in the presence of OSK expression. e and f, Quantification of axon regeneration (e, n = 4 eyes each condition) and RGC survival (f, n = 10, 7, and 9 eyes) at 2 wpc in retinas co-transduced with AAV2- tTA;TRE-OSK;shRNA. g, Mouse Stat3 mRNA levels after sh-Scr (n = 5), sh-Tet1 (n = 4), or sh-Tet2 (n = 5) knockdown in RGCs in the presence of OSK expression. h, Cre-dependent Tomato expression in RGCs after intravitreal AAV2-Cre injection of Tomato reporter mice (Rosa-CAG-lox-STOP-lox-Tomato), and the co-expressed frequency of Cre and Klf4 (n = 3 eyes). i and j, RGC survival (i) and representative longitudinal sections of regenerating axons in longitudinal sections (j) in response to OSK expression (AAV2-tTA;TRE-OSK, n = 5 each condition) compared to no expression (Saline, n = 3 and 4) , 16 days after crush injury in Tet2flox/flox mice injected with saline (Tet2 WT) or AAV2-Cre (Tet2 cKO). Scale bars, 100 µm in b, h, and j. Two-way ANOVA in a, d, and i; unpaired two-tailed Student’s t-test in g; one-way ANOVA in e and f. All data are presented as mean ± s.e.m.
Extended Data Fig. 7
Extended Data Fig. 7. OSK-induced axon regeneration and survival require non-global active DNA demethylation through TDG.
a, Representative images of retinal wholemounts transduced with sh-Scr-H2B-GFP or sh-TDG-H2B-GFP AAV2s for 4 weeks, demonstrating TDG knockdown increased levels of 5-hydroxymethylcytosine (5-hmC). n = 4 retinas each condition. b, Representative retinal wholemount images and images of longitudinal sections through the optic nerve showing CTB-labeled regenerative axons in wild-type mice, 16 dpc after an intravitreal injection of AAV2-tTA ;TRE-OSK in combination with AAV2-sh-Scr (sh-Scr) or AAV2-sh-TDG (sh-TDG) at titer ratio 5:5:1. n = 4 retinas each condition. c and d, Quantification of regenerating axons (c) and RGC survival (d) in OSK-treated mice 16 dpc with AAVs carrying sh-Scr or sh-TDG (n = 4 nerves each condition). e, Representative image of retinal wholemounts transduced with AAV2-tTA;TRE-OSK. Retinal wholemounts were immunostained for 5-methylcytosine (5-mC) and Klf4, showing a lack of global demethylation in OSK expressing RGCs. n = 3 retinas. f, Representative images of retinal wholemounts transduced with AAV2 vectors encoding the HA-Tet1 catalytic domain (Tet1-CD) or its catalytic mutant (Tet1-mCD) for 4 weeks, demonstrating overexpression of Tet1-CD decreases global 5-mC levels. n = 3 retinas each condition. g and h, Quantification of axon regeneration (g) and RGC survival (h) at 2 wpc in retinas transduced without or with AAV2 vectors encoding HA-Tet1 CD mutant or HA-Tet1 CD (n = 3, 4, and 3 eyes). i, A schematic diagram illustrating passive demethylation and TDG-dependent active DNA demethylation. Scale bars, 100 µm in a b, e, and f. One-way ANOVA with Bonferroni’s multiple comparison test in c, g, and h; unpaired two-tailed Student’s t-test in d. There was no difference between the groups in g and h using two-way ANOVA and one-way ANOVA, respectively. All data are presented as mean ± s.e.m.
Extended Data Fig. 8
Extended Data Fig. 8. OSK induces axon regeneration and reversal of DNAm age in human neurons.
a, mRNA levels of murine Oct4, Sox2, and Klf4 in human neurons transduced with vectors packaged by AAV-DJ, a recombinogenic hybrid capsid that is efficient for in vitro transduction. −OSK: AAV-DJ-tTA (n = 3); +OSK: AAV-DJ-tTA;TRE-OSK (n = 3). b, Percentage of cells in S phase by PI-staining (n = 4). c, FACS profiles of G1, S, and G2 phases in undifferentiated SH-SY5Y cells and differentiated cells transduced with −OSK and +OSK vectors. d, Experimental outline for testing axon regeneration in human neurons post-vincristine (VCS) damage. e and f, DNA methylation (DNAm) age of human neurons without damage (intact), and 1 or 9 days post-VCS damage in the absence (e) or presence (f) of OSK expression, measured using the skin and blood clock suited to in vitro studies (see Methods). The linear regression P value in e (P = 0.55) indicates non-linear DNAm age changes, and in f (P = 0.008) indicates a continuous decrease in DNAm age (n = 3, 3, and 6). g, Average DNAm levels among 850,000 probes from the EPIC array in human neurons without damage (intact), and 1 or 9 days post-VCS damage in the absence or presence of OSK expression (n = 3, 3, and 6). h and i, Representative images (h, similar results were confirmed in two series of experiments) and quantification (i) of neurite area at different time points after VCS damage (n = 6, 7, 5, 5, 7, and 5; 2 independent experiments). Cells were not passaged after damage to avoid cell-cell contact for quantifying maximum axon regeneration. j-l, Human Tet1–3 mRNA level with scrambled shRNA (sh-Scr) or sh-Tet2 AAV in human neurons in the presence or absence of OSK expression (n = 4; 2 independent experiments). m, Representative images of human neurons in each AAV treated group, 9 days post-VCS damage. Similar results were confirmed in three series of experiments. n-p, Neurite area (n), axon number (o), and axon length (p) in each AAV-treated group 9 days post-VCS damage (n = 20, 21, 24, and 23; 3 independent experiments). q, Mouse Oct4 mRNA levels (from OSK AAV) in human neurons with sh-Scr or sh-Tet2 AAV and in presence or absence of OSK AAV (n = 4). r, The effect of mTOR inhibition by rapamycin (Rap, 10 nM) on axon regeneration of differentiated neurons with or without OSK (n = 18, 19, 13, and 11; 2 independent experiments). s, S6 phosphorylation levels in human neurons 5 days after treatment with rapamycin (Rap, 10 nM). Similar results were seen in two independent experiments. Uncropped scans in Supplementary Figure 1. t, Neurite area of neurons expressing Tet1 catalytic domain (Tet1-CD) or its catalytic mutant (Tet1-mCD) 9 days post-VCS damage (n = 24, 28, and 21; 2 independent experiments). One-way ANOVA with Bonferroni’s multiple comparison test in b, e, f, g, and t; two-way ANOVA with Bonferroni’s multiple comparison test in a, i, jl, and nr. All bar graphs are presented as mean ± s.e.m.
Extended Data Fig. 9
Extended Data Fig. 9. Vision restoration and regenerative effect of OSK rely on functional improvement of existing RGCs.
a, Axon density and representative photomicrographs of PPD-stained optic nerve cross-sections, 4 weeks after microbead or saline injection (baseline, n = 5 eyes each condition). Scale bars, 25 µm. b, Quantification of RGCs and representative confocal microscopic images from retinal flat-mounts stained with anti-Brn3a (red), an RGC-specific marker, and DAPI (4′,6-diamidino-2-phenylindole, blue), a nuclear stain, 4 weeks after microbead or saline injection (baseline, n = 5 eyes each condition). Scale bar, 100 µm. c, Axon density and representative micrographs from PPD-stained optic nerve cross-sections, 4 weeks after AAV2 or PBS injection (treated, n = 9, 7, 6, and 8 eyes). Scale, 50 µm. d, Quantification of RGCs and representative confocal microscopic images 4 weeks post-PBS or AAV injection (treated, n = 7, 5, 6, and 5 eyes). Scale bar, 100 µm. e, PERG measurement at different ages 4 weeks after −OSK (n = 16, 14, and 11 eyes) or +OSK treatment (n = 20, 12, and 14 eyes). Similar results from 2 independent experiments are combined. f, Visual acuity in 18-month-old mice treated with −OSK (n = 11 eyes) or +OSK AAV (n = 14 eyes) for 4 weeks. g and h, Axon (g, n = 4, 6, 10, and 9 nerves) and RGC (h, n = 5, 4, 10, and 8 retinas) density in 4- and 12-month-old-mice, 4 weeks after −OSK or +OSK AAV injection. i, Scatter plot of OSK-induced changes and age-associated changes in mRNA levels in RGCs, with differentially expressed genes labelled. Gene selection criteria are in Methods. j, Hierarchical clustered heatmap showing relative mRNA levels of age-associated sensory perception genes in FACS-sorted RGCs from untreated young (5 mo) or old mice (12 mo) or old mice treated with either −OSK or +OSK AAV. Sensory genes were extracted from the mouse Sensory Perception (GO:0007600) category the Gene Ontology database, including genes that were differentially expressed (q < 0.05) in 12- versus 5-month-old mice, excluding genes that were induced by the empty virus infection (q < 0.1). −OSK: AAV2-rtTA;TRE-OSK for ch, AAV2-TRE-OSK for i and j; +OSK: AAV2-tTA;TRE-OSK for c-j. Unpaired two-tailed Student’s t-test in a, b, and f; one-way ANOVA with Bonferroni’s multiple comparison test in c and d; two-way ANOVA with Bonferroni correction in e, g, and h. All data are presented as mean ± s.e.m.
Extended Data Fig. 10
Extended Data Fig. 10. OSK expression in old RGCs restores youthful epigenetic signatures.
a and b, Top biological processes based on transcriptome data that were either lower expressed in old compared to young RGCs and reversed by OSK (a), or higher expressed in old RGCs compared to young and reversed by OSK (b). c, Heatmap showing relative mRNA levels of genes involved in the negative regulation of neural projection development, among the 464 differentially expressed genes during ageing. Efemp1 is a gene whose accumulation during ageing is suspected to play a role in diseases of the retina. d, RGC Efemp1 mRNA levels measured by qPCR (relative to GAPDH) compared between young, old, and old treated with −OSK or + OSK AAV. Old RGCs with sh-Scr, sh-Tet1, or sh-Tet2 knockdown combined with +OSK AAV are included for comparison (n = 7, 6 ,5, 4, 5, 5, and 6 eyes). e, Principal Component 1 value of 1 mo, 12 mo, and 30 mo RGC training samples in the PCA analysis. Values are standardized to have a mean=0 and s.d.=1 (n = 6, 2, and 6). f, DNAm ageing signatures of 6-week-old RGCs isolated from axon-intact retinas infected with GFP-expressing AAV, or from axon-injured retinas infected with GFP- or OSK- expressing AAV at 4 dpc (n = 4, 4, and 8 eyes). g, Top biological processes associated with the 1,226 signature CpG sites. h and i, Transcription factor (TF) binding (h) and histone modifications (i) specifically enriched at the 1,226 signature CpG sites, compared to five sets of randomly selected CpGs. j, Correlation of Tet1 and Tet2 knockdown-induced changes in methylation (5-mC and 5-hmC together) at the selected CpGs. r = 0.4, P = 2.53e-45. k, Delta value of ribosomal DNAm age (mo) of 12-month-old RGCs infected for 4 weeks with +OSK (n = 5 retinas). Values are relative to the average of RGCs infected with −OSK AAV. l, Ribosomal DNAm age (mo) of 12-month-old OSK-treated RGCs infected for 4 weeks with sh-Tet1 or sh-Tet2 (n = 4, 5 retinas). Values are relative to the average of RGCs infected with sh-Scr. m, PERG amplitudes in old mice (12 mo) treated with −OSK, +OSK, or +OSK together with either sh-Scr or sh-Tet1/sh-Tet2-mediated knockdown for 4 weeks (n = 8, 7, 5, 6, and 6 eyes). n, Working model. The loss of youthful epigenetic information during ageing and injury (including genome-wide changes to DNA methylation, acceleration of the DNAm clock, and disruption of youthful gene expression patterns) causes a decline in tissue function and regenerative capacity. OSK-mediated reprogramming recovers youthful epigenetic information, reverses the DNAm clock, restores youthful gene expression patterns, and improves tissue function and regenerative capacity, a process that requires active DNA demethylation by TET1/TET2 and TDG. The PRC2 complex may serve to recruit TET1 and TET2 to specific sites in the genome, and DNA methylation by DNA methyltransferases (DNMTs) may be important as well. One-way ANOVA with Bonferroni’s multiple comparison test in d, e, f and m. All data are presented as mean ± s.e.m.
Figure 1.
Figure 1.. AAV2-delivered polycistronic OSK promotes axon regeneration and RGC survival following optic nerve injury.
a, Schematic of the Tet-On and Tet-Off dual AAV vectors. b, Schematic and representative retinal wholemount/cross sections (n = 10), two weeks after intravitreal injection of AAV2-tTA;TRE-OSK showing Klf4 (green) expression in the RGCs (RBPMS+, blue). Scale bars, 1 mm and 100 µm, respectively. c, Experimental outline of the optic nerve crush study using the Tet-Off system. 555-CTB was used for anterograde axonal tracing. wks, weeks. d, Number of axons 16 days after crush injury at distances distal to the lesion in mice treated with either AAV2 encoding destabilized enhanced green fluorescent protein (d2EGFP), Oct4, Sox2, Klf4, Oct4-Sox2, or OSK on three monocistronic AAV2s or a single polycistronic AAV2 (n = 5, 4, 4, 4, 4, 4, and 7 eyes). Suppression of polycistronic OSK expression by Dox (n = 5 eyes) is shown as OSK Off in d and e. e, Representative images of longitudinal sections through optic nerves after receiving intravitreal injections of AAV2-tTA;TRE-OSK in the presence (n = 5) or absence of doxycycline (n = 7). CTB-labeled axons are shown 16 days post crush (dpc). Asterisks indicate optic nerve crush site. f, Representative confocal images of longitudinal sections through the optic nerve showing CTB-labeled axons in 12-month-old mice, 5 weeks post-crush (wpc), with AAV2-mediated expression of either GFP or OSK. Representative results from n = 5 eyes. g, At 16 dpc, the number of axons at multiple distances distal to the lesion site in transgenic Cre lines that selectively express OSK either in RGCs (Vglut2-CRE) or amacrine cells (Vgat-CRE) with intravitreal injection of AAV2-FLEx-tTA;TRE-OSK (n = 4 eyes each condition). Details in Extended Data Fig. 4e–h. Scale bars, 200 µm. One-way ANOVA with Bonferroni correction in d and g, with comparisons to d2EGFP shown in f. All data are presented as mean ± s.e.m.
Figure 2.
Figure 2.. DNA demethylation is required for OSK-induced axon regeneration post injury.
a, Strategies for induction of OSK pre- and post-injury. b, RGC survival per mm2 at 2 and 4 wpc in response to OSK induction either pre- or post-injury (n = 4 eyes except for Post-inj On group, 2 wpc, n = 7 eyes). c, Representative longitudinal sections through the optic nerve showing CTB-labeled axons at 4 wpc, with or without post-injury induction of OSK. Asterisks indicate optic nerve crush site. Representative results from n = 4 eyes. Scale bars, 200 µm. d, ribosomal DNAm age (mo, month) of 6-week-old RGCs isolated from axon-intact retinas infected with or without GFP-expressing AAV, or from axon-injured retinas infected with GFP- or OSK-expressing AAV at 4 dpc (n = 6, 4, 8, and 8 eyes). DNA methylation age estimates of neurons tend to be lower than their chronological ages but remain correlated (see Extended Data Fig. 5g and Methods). e, Hierarchical clustered heatmap of DNA methylation levels of CpGs that significantly changed in RGCs after crush injury (GFP vs Injured GFP, q < 0.05) and the effect of OSK at 4 dpc. f, Axon regeneration in response to OSK expression (AAV2-tTA; TRE-OSK), 16 dpc in Tet2flox/flox mice infected with saline (Tet2 WT, n = 3 each condition) or AAV2-Cre (Tet2 cKO, n = 4 each condition). One-way ANOVA with Bonferroni’s multiple comparison test in b, d, and f. All bar graphs are presented as mean ± s.e.m.
Figure 3.
Figure 3.. Four weeks of OSK expression reverses vision loss after glaucomatous damage has already occurred.
a, Experimental outline of the induced glaucoma studies using 8-wk-old mice. wks, weeks. b, Intraocular pressure (IOP) measured weekly by rebound tonometry for the first 4 weeks post-microbead/saline injection (saline, n = 10 mice; microbeads, n = 29 mice). c, High-contrast visual stimulation to measure optomotor response. Reflexive head movements were tracked in response to the rotation of a moving stripe pattern that increased in spatial frequency (cyc/deg, cycle per degree). d, Optomotor response of each mouse before treatment and 4 weeks after intravitreal injection of AAVs (n = 10, 7, 12, and 12 mice; similar results from 3 independent experiments combined). e, Representative PERG waveforms in response to a reversing contrast checkerboard pattern, recorded from the same eye both at pre-injection baseline and at 4 weeks after −OSK (upper graph) or +OSK (lower graph) AAV injection. f, Mean PERG amplitudes of recordings from each mouse in d at baseline before treatment and 4 weeks after intravitreal AAV injection (n = 10, 7, 12, and 12 mice; similar results from 3 independent experiments combined). −OSK (not induced): AAV2-rtTA;TRE-OSK; +OSK (induced): AAV2-tTA;TRE-OSK. Two-way ANOVA with Bonferroni correction between groups was used for b; Two-way mixed ANOVA with Bonferroni correction between groups was used for the overall effect of time and treatment for d, and f; before and after treatments were analyzed using a paired two-tailed Student’s t-test in d and f. Data in b, d, and f are presented as mean ± s.e.m.
Figure 4.
Figure 4.. Restoration of youthful vision, transcriptome and DNAm ageing signature in old mice.
a, Experimental outline for testing the effect of reprogramming in old mice. b, Visual acuity in young (4 mo) and old mice (12 mo) after 4 weeks of −OSK or +OSK treatment (n = 16, 20, 14, and 12 eyes; similar results from 2 independent experiments combined). mo, month(s). c and d, Hierarchical clustered heatmap (c) and scatter plot (d) showing mRNA levels of 464 genes that were differentially expressed between young and old RGCs and the effect of OSK. RGCs were sorted from untreated young (5 mo, n = 5), old (12 mo, n = 6), or treated old retinas (−OSK, n = 5; +OSK, n = 4). Gene selection criteria for c and d are described in the methods. e, DNAm ageing signatures of 12-mo-old RGCs infected for 4 weeks with: −OSK, or +OSK (n = 4 and 3 retinas). f, Visual acuity in old mice (12 mo) treated for 4 weeks with: −OSK, +OSK, or +OSK together with sh-Scr, sh-Tet1, or sh-Tet2 (n = 8, 7, 5, 6, and 6 eyes). −OSK: AAV2-rtTA;TRE-OSK for b, AAV2-TRE-OSK for c and d, AAV2-tTA;TRE-d2EGFP for e; +OSK: AAV2-tTA;TRE-OSK for bf. Two-way ANOVA with Bonferroni correction in b; Kruskal-Wallis test for e; one-way ANOVA with Bonferroni correction in f, with comparisons to the −OSK group. All bar graphs are presented as mean ± s.e.m.

Comment in

References

    1. Sinclair DA, Mills K & Guarente L Accelerated aging and nucleolar fragmentation in yeast sgs1 mutants. Science 277, 1313–1316 (1997). - PubMed
    1. Imai S & Kitano H Heterochromatin islands and their dynamic reorganization: a hypothesis for three distinctive features of cellular aging. Exp Gerontol 33, 555–570, doi:10.1016/s0531-5565(98)00037-0 (1998). - DOI - PubMed
    1. Oberdoerffer P et al. SIRT1 redistribution on chromatin promotes genomic stability but alters gene expression during aging. Cell 135, 907–918, doi:10.1016/j.cell.2008.10.025 (2008). - DOI - PMC - PubMed
    1. Horvath S DNA methylation age of human tissues and cell types. Genome Biol 14, R115, doi:10.1186/gb-2013-14-10-r115 (2013). - DOI - PMC - PubMed
    1. Kennard MA Relation of age to motor impairment in man and in subhuman primates. Archives of Neurology & Psychiatry 44, 377–397, doi:10.1001/archneurpsyc.1940.02280080137008 (1940). - DOI

Publication types

MeSH terms