. 2021 Jan;589(7841):258-263.
doi: 10.1038/s41586-020-2995-0. Epub 2020 Dec 2.

Distinct hypothalamic control of same- and opposite-sex mounting behaviour in mice

Affiliations

Distinct hypothalamic control of same- and opposite-sex mounting behaviour in mice

Tomomi Karigo et al. Nature. 2021 Jan.

Erratum in

Abstract

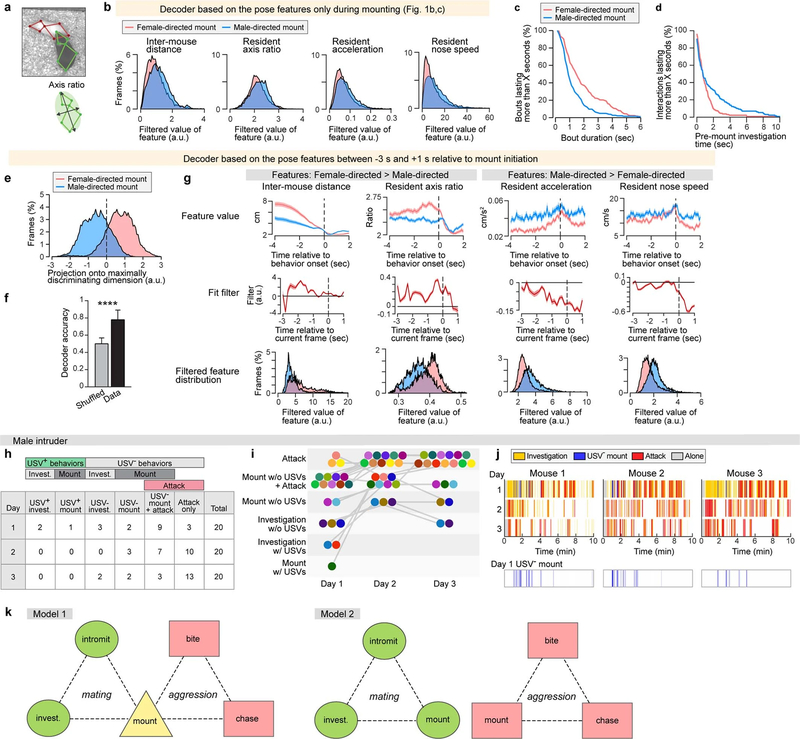
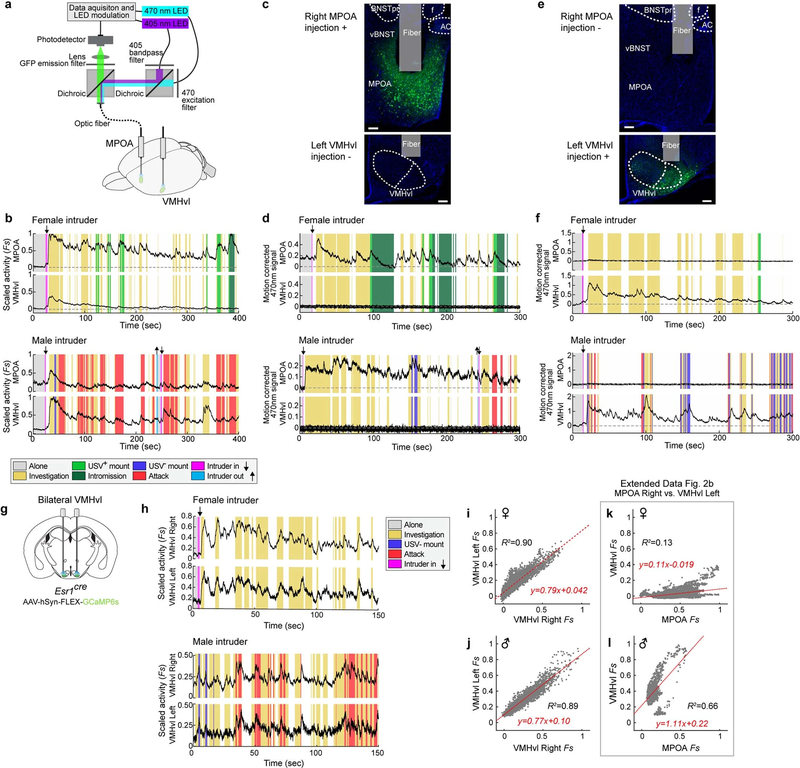
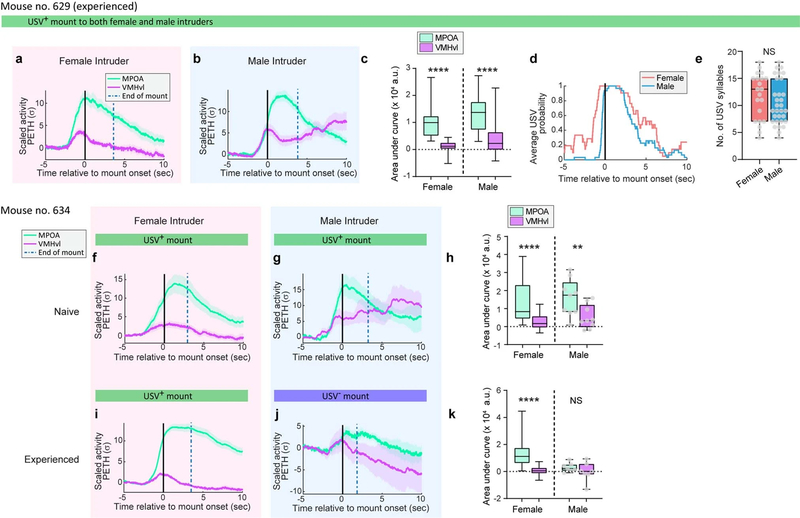
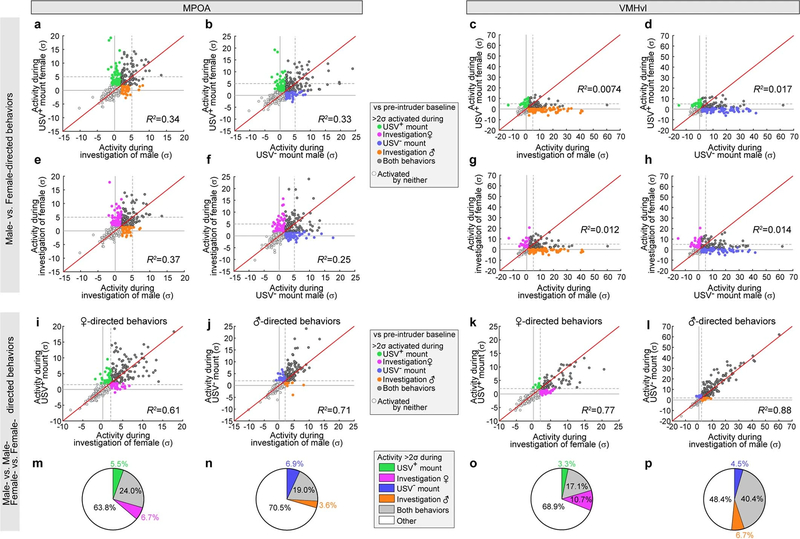
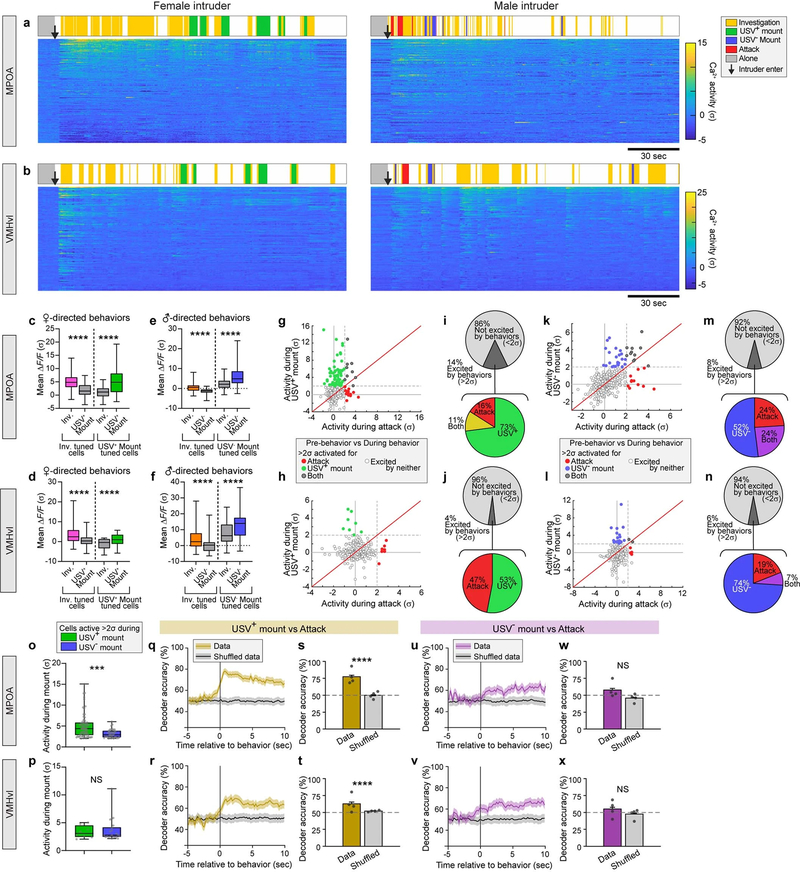
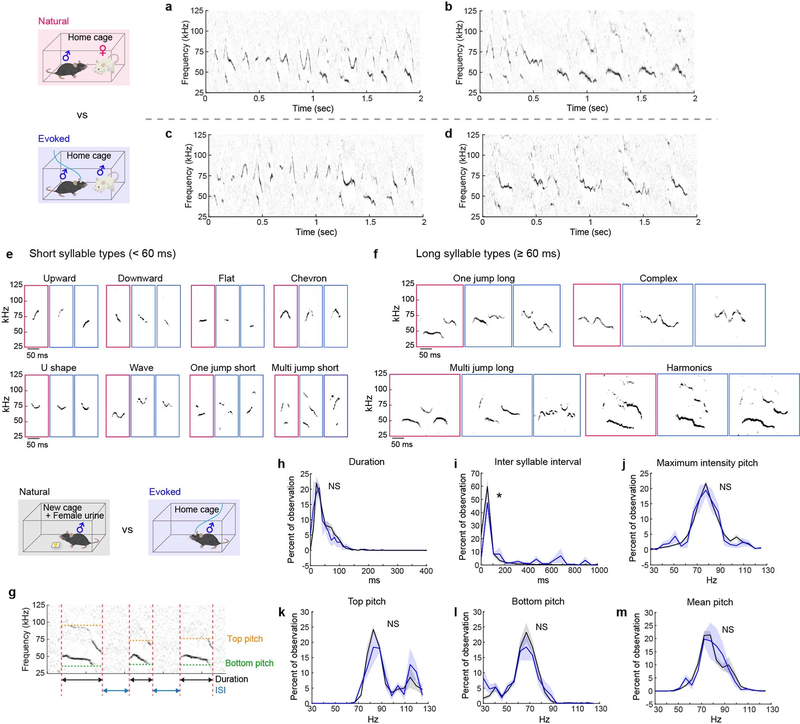
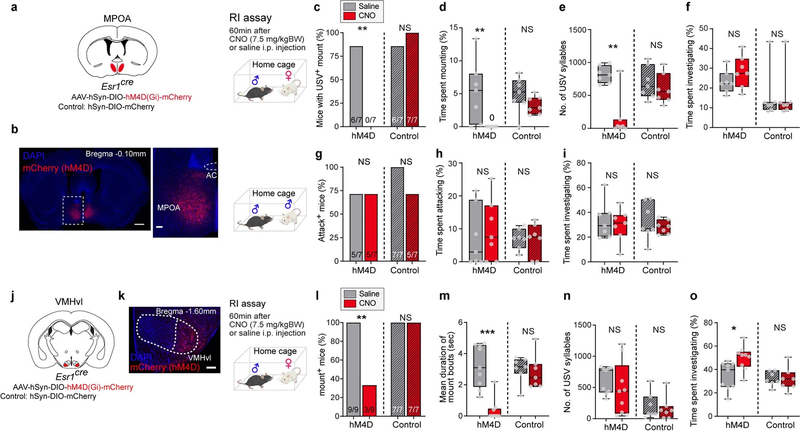
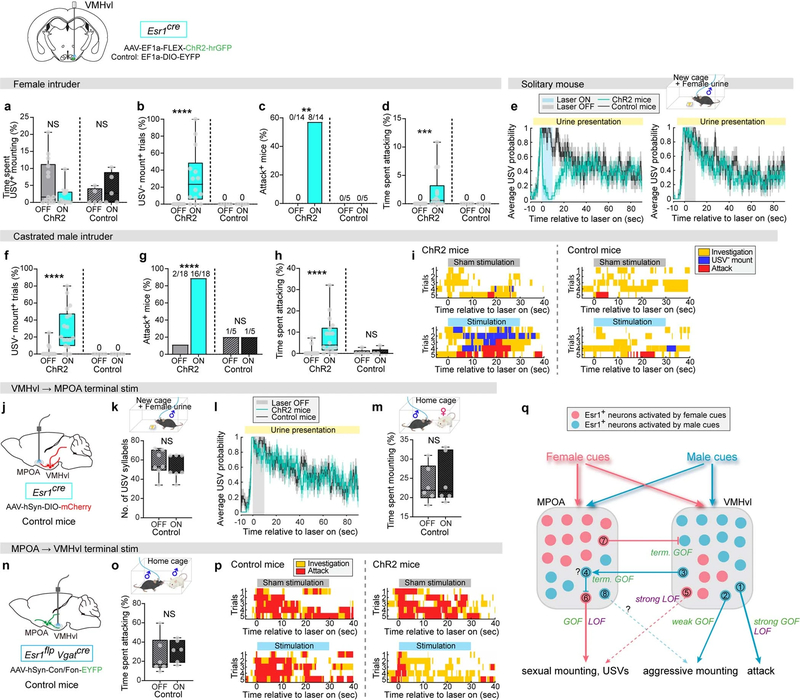
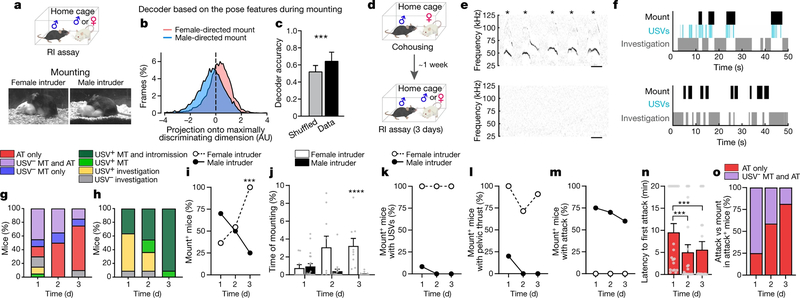
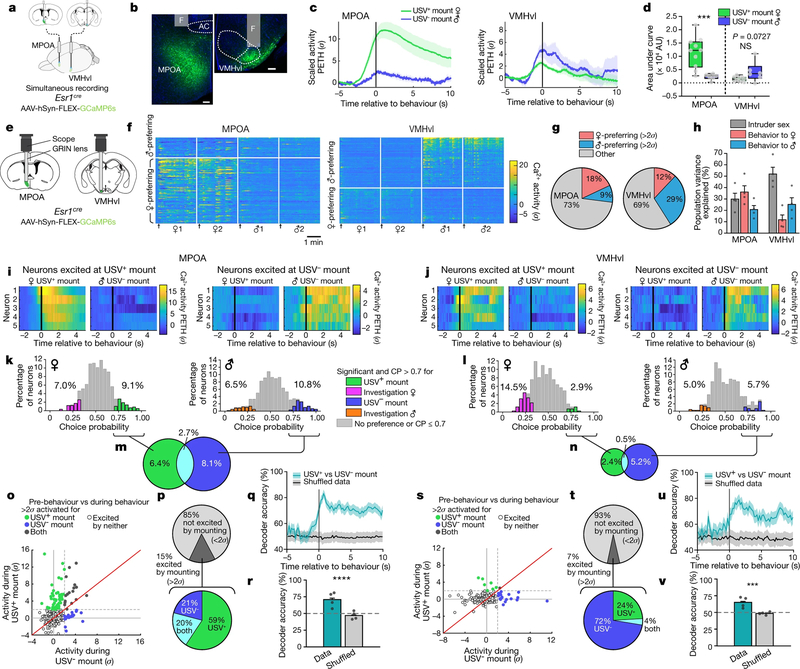
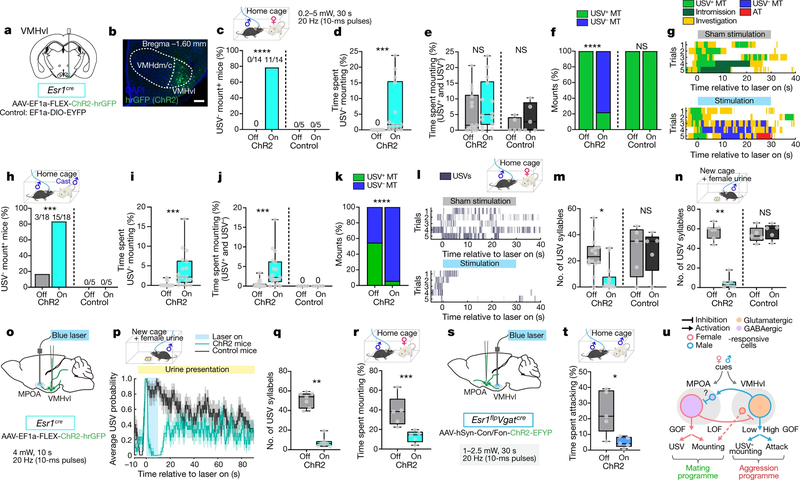
Animal behaviours that are superficially similar can express different intents in different contexts, but how this flexibility is achieved at the level of neural circuits is not understood. For example, males of many species can exhibit mounting behaviour towards same- or opposite-sex conspecifics1, but it is unclear whether the intent and neural encoding of these behaviours are similar or different. Here we show that female- and male-directed mounting in male laboratory mice are distinguishable by the presence or absence of ultrasonic vocalizations (USVs)2-4, respectively. These and additional behavioural data suggest that most male-directed mounting is aggressive, although in rare cases it can be sexual. We investigated whether USV+ and USV- mounting use the same or distinct hypothalamic neural substrates. Micro-endoscopic imaging of neurons positive for oestrogen receptor 1 (ESR1) in either the medial preoptic area (MPOA) or the ventromedial hypothalamus, ventrolateral subdivision (VMHvl) revealed distinct patterns of neuronal activity during USV+ and USV- mounting, and the type of mounting could be decoded from population activity in either region. Intersectional optogenetic stimulation of MPOA neurons that express ESR1 and vesicular GABA transporter (VGAT) (MPOAESR1∩VGAT neurons) robustly promoted USV+ mounting, and converted male-directed attack to mounting with USVs. By contrast, stimulation of VMHvl neurons that express ESR1 (VMHvlESR1 neurons) promoted USV- mounting, and inhibited the USVs evoked by female urine. Terminal stimulation experiments suggest that these complementary inhibitory effects are mediated by reciprocal projections between the MPOA and VMHvl. Together, these data identify a hypothalamic subpopulation that is genetically enriched for neurons that causally induce a male reproductive behavioural state, and indicate that reproductive and aggressive states are represented by distinct population codes distributed between MPOAESR1 and VMHvlESR1 neurons, respectively. Thus, similar behaviours that express different internal states are encoded by distinct hypothalamic neuronal populations.


Figures

Extended Data Fig. 1 |
Extended Data Fig. 1 |. Additional information for resident–intruder assay with female or male intruders.
a, An example of detected resident (green) and intruder (red) key points used for mouse pose estimation (top) and example diagram of the resident ‘axis ratio’ feature (bottom). b, Histograms of values of four relevant mouse pose features during bouts of female- or male-directed mounting. Pose features extracted from mount video frames only are highly overlapping for male- versus female-directed mounts. c, Distribution of mounting bout length. d, Distribution of time spent in close proximity to the intruder before initiation of mounting. eg, Decoding intruder sex from female- versus male-directed mounting from video frames spanning 3 s before to 1 s after mount onset. e, Projection of mouse pose features from mounting bouts onto the maximally discriminating dimension of the decoder. f, Decoder accuracy compared with shuffled data. Fifty-four behaviour sessions, two-sided Mann–Whitney U test, ****P < 0.0001. g, Values of four mouse pose features relative to onset of female- or male-directed mounting (top row), the temporal filter on each feature learned by the SVM decoder (middle row), and histograms of filter output for tested frames of female- versus male-directed interactions, showing separation of feature values (bottom row). a.u., arbitrary units. h, i, Details of the behaviours of different resident mice towards male intruder across three days, corresponding to Fig. 1g. h, Number of mice assigned to each behaviour category. i, Visualization of behaviour changes across three days. Different coloured circles indicate different resident mice. Overall, behaviours for each mouse changed from lower intensity categories (less aggressive) to higher intensity categories (more aggressive), with repeated social experience. j, Behaviour rasters towards male intruders across three days from three mice. Bottom row indicates extracted USV mount bouts from day 1 to show that most USV mounts occur in the early phase of a male–male social interaction. k, Two alternative models for encoding of male- versus female- directed mounting in the hypothalamus. In model 1, the two forms of mounting share a common hypothalamic ‘mounting control centre’; in model 2, the two forms of mounting use distinct neural substrates. Circles, squares and triangles are abstractions representing different cell populations, and do not correspond to specific nuclei or circuits. Data are mean ± s.e.m. (Supplementary Table 2).
Extended Data Fig. 2 |
Extended Data Fig. 2 |. Control experiment data for dual-site fibre photometry.
a, Schematic of dual-site fibre photometry setup. Calcium signals are recorded simultaneously from contralateral MPOA and VMHvl using Esr1cre male mice. b, Representative scaled calcium signals from MPOAESR1 and VMHvlESR1 neurons after exposure to female (top) and male (bottom) intruders. Vertical shading indicates bouts of annotated social behaviour listed and colour-coded at right. Downward arrows, intruder introduction; upward arrows, intruder removal. cf, Representative data from mice injected with GCaMP6s AAV only in MPOA (c, d), or in VMHvl (e, f) and recorded from both two areas. c, e, Representative GCaMP6s expression and optic fibre tract. Top, MPOA; bottom, VMHvl, Scale bars, 100 μm. n = 2 each. AC, anterior commissure; f, fornix; BNSTpr, principal division of the bed nucleus of the stria terminalis; vBNST, ventral BNST; fiber, optic fibre tract. d, f, Representative GCaMP6s traces from MPOAESR1 and VMHvlESR1 neurons with female and male intruders. Vertical shading indicates bouts of annotated social behaviour listed and colour-coded at right. Data are presented as raw motion corrected 470-nm traces. Non-injected sites (VMHvl in c, MPOA in e) had few GCaMP-positive fibres from contralateral injection sites (c, e) and did not show detectable Ca2+ signal changes (flat lines in d, f). gj, Representative data from recording bilateral VMHvlESR1 neurons. n = 2. g, Schematic of fibre photometry recording from bilateral VMHvl. h, Ca2+ traces from female and male trials. Ca2+ traces in right and left hemispheres are highly correlated. i, j, Distribution of scaled activity in right (x axis) versus left (y axis) VMHvlESR1 neurons across entire trials with female (i) and male (j) intruders. Activity was fitted to y = ax + b (red line) using 1-kHz sampling traces and scatter plots display downsampled (30 Hz) time points. R2, coefficient of determination. k, l, Distribution of scaled activity in MPOAESR1 (x axis) versus VMHvlESR1 (y axis) neurons across entire trials with female (k) and male (l) intruders from the traces in b. MPOAESR1 and VMHvlESR1 neural activities are less correlated than bilateral VMHvlESR1 neural activities.
Extended Data Fig. 3 |
Extended Data Fig. 3 |. Dual-site fibre photometry recording during social interaction.
aj, Average calcium signals in MPOAESR1 and in VMHvlESR1 neurons aligned to social investigation onset of female (ae) and male (fj) intruders. n = 10. First investigation bouts of each intruder have stronger calcium signals than all other investigation bouts and were analysed separately (d, e, i, j). a, f, PETH of scaled neural activity normalized to pre-behaviour period. b, g, Maximum PETH signal during 0 to 3 s from investigation onset (shaded grey area in a, f), compared with mean activity during pre-behaviour period (−5 to −3 s). b, ****P < 0.0001, **P = 0.0025; g, *P = 0.0105, ****P < 0.0001. c, h, Integrated activity during investigation. c, **P = 0.0039; h, *P = 0.0273. a.u., arbitrary units. d, e, i, j, Average calcium signals during first investigation of each intruder versus all other investigation bouts towards female (d, e) and male (i, j) intruders. d, i, PETH of scaled neural activity. e, j, Maximum PETH signal during 0 to 3 s from first investigation onset. e, j, **P = 0.002. k, l, Average calcium signals during social investigation in each region. k, PETH of scaled neural activity in MPOAESR1 and VMHvlESR1. n = 10. Traces were reproduced and rescaled from data in a, f for comparative purposes. l, Integrated activity during investigation. **P = 0.0098 (MPOA), 0.0059 (VMHvl). mx, Average calcium signals during USV+ mounts towards female intruders (mp, n = 10), USV mounts towards male intruders (qt, n = 6) or attack towards male intruders (ux, n = 7). m, q, u, PETH of average scaled neural activity. n, r, v, Maximum scaled activity during 0–3 s from behaviour onset. n, ****P < 0.0001, **P = 0.0014; r, *P = 0.0358, ***P = 0.0009; v, *P = 0.0104, ***P = 0.0007. o, s, w, Representative PETH traces for each behaviour. Coloured shading marks behavioural episodes. p, t, x, Integrated activity in during behaviours. p, **P = 0.002; x, **P = 0.0469. m and q traces were reproduced and rescaled from data in Fig. 2c. y, Average calcium signals during USV+ mount, USV mount and attack. y, PETH of scaled activity in MPOAESR1 and VMHvlESR1neurons. USV+ mount, n = 10; USV mount, n = 6; attack, n = 7. Traces were reproduced and rescaled from data in m, q and u. z, Integrated activity during each behaviour. **P = 0.0092, 0.0097, 0.0097 (left to right). b, e, g, j, l, n, r, v, z, Kruskal–Wallis test; c, h, p, t, x, Wilcoxon test. Data are mean ± s.e.m. except for box plots (see Fig. 2 legend). All statistical tests are two-sided and corrected for multiple comparisons when necessary (Supplementary Table 2).
Extended Data Fig. 4 |
Extended Data Fig. 4 |. Neural activity patterns in rare mice that exhibit USV+ mounting towards male intruders resemble those observed during USV+ mount towards female intruders.
ae, Calcium activity and USV data from a sexually and socially experienced mouse (no. 629) that showed USV+ mounting towards both female and male intruders. Female, 21 bouts; male, 30 bouts. a, b, PETH traces aligned at onset of USV+ mount towards female (a) or male (b) intruders. c, Integrated activity during mounting bouts. ****P < 0.0001. d, e, Quantification of USVs from mouse no. 629 towards female or male intruders. d, Distribution of USVs aligned at onset of USV+ mount. e, Number of USV syllables during 0 to 5 s from onset of USV+ mount. This mouse did not display any attack behaviour towards male mice, but preferred females to males in a triadic interaction test (Supplementary Note 2). fk, Calcium activity data from one mouse (no. 634) which showed USV+ mounting towards males when sexually and socially naive, and later USV mounting after it obtained sexual and social experience. f, g, PETH traces from naive mouse aligned at onset of USV+ mount. h, Integrated activity during mounting bouts from data in f, g. Female, 27 bouts; male, 9 bouts, ****P < 0.0001, **P = 0.0039. i, j, PETH traces from the same mouse after social and sexual experience, aligned at onset of USV+ mounting towards female or USV mounting towards male intruders. k, Integrated activity during mounting bouts from traces in i, j. Female, 107 bouts; male, 7 bouts, ****P < 0.0001. c, h, k, Wilcoxon test; e, Mann–Whitney U test. Data are mean ± s.e.m. except for box plots (see Fig. 2 legend). All statistical tests are two-sided and corrected for multiple comparisons when necessary (Supplementary Table 2).
Extended Data Fig. 5 |
Extended Data Fig. 5 |. Correlation of ESR1+ neural activity during male-versus female-, male-versus male-, or female- versus female-directed behaviours in MPOA and VMHvl.
al, Average calcium response per neuron in MPOAESR1 (a, b, e, f, i, j) or VMHvlESR1 (c, d, g, h, k, l) populations during female-directed behaviours (USV+ mounting or investigation, y axis) versus male-directed behaviours (USV mounting or investigation, x axis) (ah), female-directed USV+ mounting (y axis) versus investigation (x axis) (i, k) or male-directed USV mounting (y axis) versus investigation (x-axis) (j, k), compared to pre-intruder baseline period. Coloured points indicate cells with >2σ, compared to pre-intruder baseline period. Red lines, y = x. R2, coefficient of determination. Dashed lines, 2σ. mp, Proportion of cells excited (>2σ) during female- (m, o) or male- (n, p) directed behaviours. The correlations of the neural activity during the behaviours directed towards the same sex (il) are higher than the correlations during the behaviours directed towards the different sex (ah).
Extended Data Fig. 6 |
Extended Data Fig. 6 |. Neuronal population representations of social behaviours in MPOA and VMHvl.
a, b, Representative calcium activity rasters of MPOAESR1 (a) and VMHvlESR1 (b) neurons during social interaction with a female (left) or male (right) intruder, sorted by mean activity level during the displayed period. Behaviours of the resident mice are indicated above the neural activity rasters. Arrows, intruder introduction. cf, Response strength of behaviour-tuned populations, during their preferred behaviour (coloured bars) and non-preferred behaviour (grey bars). Behaviour-tuned populations are defined by choice probability for female-directed mount versus investigation (c, d, from Fig. 2k, l, left) and for male-directed mount versus investigation (e, f, from Fig. 2k, l, right). c, n = 41 (inv-tuned), 53 (mount-tuned); d, n = 61 (inv), 12 (mount); e, n = 38 (inv), 63 (mount); f, n = 21 (inv), 24 (mount), ****P < 0.0001, ***P = 0.0005. gn, Average calcium response per neuron during female-directed USV+ mounting (y axis) versus male attack (x axis) (gj), and male-directed USV mounting (y axis) versus male attack (x axis) (kn), relative to activity immediately before behaviour initiation. g, h, k, l, Scatter plots. i, j, m, n, Proportion of cells excited (>2σ) during each behaviour. o, p, Average response strength of mount responsive neurons (>2σ relative to activity immediately before mount initiation). USV+ mount-responsive neurons (green + grey dots in Fig. 2o, s), n = 68 (MPOA), 8 (VMHvl); USV mount-responsive (blue + grey dots in Fig. 2o, s), n = 35 (MPOA), 22 (VMHvl), ***P = 0.0001. qx, Accuracy of time-evolving (q, r, u, v) or frame-wise (s, t, w, x) decoders predicting USV+ mounting from attack (qt) and USV mounting from attack (ux), trained on neural activity. n = 4, ****P < 0.0001, *P = 0.026. cf, Wilcoxon test; o, p, s, t, w, x, Mann–Whitney U test. Data are mean ± s.e.m. except for box plots (see Fig. 2 legend). All statistical tests are two-sided and corrected for multiple comparisons when necessary (Supplementary Table 2).
Extended Data Fig. 7 |
Extended Data Fig. 7 |. Stimulation of MPOAESR1∩VGAT neurons triggers mounting and USVs towards male and female intruders.
ai, Quantification of behaviour parameters towards male intruders (ah) or under solitary conditions (i) with different laser intensities. af, h, i, ChR2 with intensity A, B, off, n = 7; C, n = 6; control, n = 7; g, ChR2 with intensity B and off, n = 6; A and C, n = 6; control, on n = 5, off n = 4. Data with intensity B (0.5–1.5 mW) are reproduced from Fig. 3 for comparative purposes. b, Left to right, *P = 0.0418, ***P = 0.0009, 0.0006. c, ***P = 0.0004, **P = 0.001. d, **P = 0.0012, 0.0031. e, **P = 0.0025, 0.0024. f, **P = 0.0027, **P = 0.0179. g, **P = 0.0014, 0.002. h, *P = 0.0102, 0.0112. i, **P = 0.0096, 0.0045. j, Representative behaviour raster plots towards male intruders from ChR2 and control mice without (top) and with (bottom) photostimulation with laser intensity B (0.5–1.5 mW). kq, Quantification of behaviour parameters towards female intruders with laser intensity B (0.5–1.5 mW). ChR2, n = 6; control, n = 7. l, *P = 0.0127. m, **P = 0.0034. o, **P = 0.0025. p, ***P = 0.0001. bi (ChR2), lp, Kruskal–Wallis test; bi (control), Wilcoxon test; k, Fisher’s test. Data are mean ± s.e.m. except for box plots (see Fig. 2 legend). All statistical tests are two-sided and corrected for multiple comparisons when necessary (Supplementary Table 2).
Extended Data Fig. 8 |
Extended Data Fig. 8 |. Comparison between features of naturally occurring and optogenetically evoked USVs.
ad, Example spectrograms from male– female interaction (natural USVs, a, b) and male–male interaction during MPOAESR1∩VGAT optogenetic stimulation (evoked USVs, c, d). e, f, Example syllables extracted from naturally occurring USVs recorded during male–female interactions (pink), and from evoked USVs recorded during male–male interactions with MPOA optogenetic stimulation (blue). Syllable were first classified into short (duration <60 ms, e) or long (≥60 ms, f), then further manually classified into total of 12 categories according to previous criteria. All 12 syllable types were observed among both natural and evoked USVs. gm, Comparison of acoustic features between USVs evoked by female urine or optogenetic stimulation of MPOA in solitary males. g, Schematic of the acoustic parameters of USVs (Methods). ISI, inter syllable interval. hm, Histograms of acoustic features. Optogenetically evoked USVs in solitary males (blue, 3 mice), natural USVs evoked by female urine (black, 5 mice). Asterisk indicates significant difference between the distributions of the feature from natural versus evoked USVs. Kolmogorov–Smirnov test, i, *P < 0.0001. Number of syllables used in the analysis, ISI, natural n = 844, evoked n = 263; other features, natural n = 868, evoked n = 285. Data are mean ± s.e.m. (Supplementary Table 2).
Extended Data Fig. 9 |
Extended Data Fig. 9 |. Chemogenetic inhibition of MPOAESR1 and VMHvlESR1 neurons decreases mounting towards females.
a, Strategy to chemogenetically inhibit MPOAESR1 neurons in male Esr1cre mice. b, mCherry (hM4D) expression in MPOA in Esr1cre mice with boxed region magnified (right). Scale bars, 500 μm (left), 100 μm (right). n = 7. cf, Behaviour parameters from resident–intruder (RI) assay with female intruders. hM4D, n = 7; control, n = 7. c, Per cent mice showing USV+ mounting, **P = 0.0047. d, Per cent time spent USV+ mounting, **P = 0.0034. e, Number of USV syllables, **P = 0.0021. f, Per cent time spent investigating. gi, Behaviour parameters from resident–intruder assay with male intruders. g, Per cent mice showing attack. h, Per cent time spent attacking, i, Per cent time spent investigating. j, Strategy to chemogenetically inhibit VMHvlESR1 neurons in male Esr1cre mice. k, mCherry (hM4D) expression in VMHvl. Scale bar, 100 μm. n = 9. lo, Behaviour parameters from resident–intruder assay with female intruders. hM4, n = 9; control, n = 7. l, Per cent mice showing USV+ mounting, **P = 0.009. m, Mean duration of USV+ mount bouts, ***P = 0.0008. n, Number of USV syllables. o, Per cent time spent investigating, *P = 0.024. c, g, l, Fisher’s test; df, h, i, mo, Kruskal–Wallis test. In box plots, centre lines indicate medians, box edges represent the interquartile range and whiskers denote minimal and maximal values. All statistical tests are two-sided and corrected for multiple comparisons when necessary (Supplementary Table 2).
Extended Data Fig. 10 |
Extended Data Fig. 10 |. Optogenetic stimulation of VMHvlESR1 neurons triggers USV mounting as well as attack towards female and castrated male intruders.
ai, Behaviours during photostimulation towards female intruders (ad), alone with female urine presentation (e) or towards castrated male intruders (fi). a, Per cent time spent USV+ mounting. b, f, Fraction of trials with USV mounting, ****P < 0.0001. c, g, Fraction of mice showing attack, **P = 0.0019, ****P < 0.0001. d, h, Per cent time spent attacking, ****P < 0.0001. e, Probability of USVs with (left) and without photostimulation (right). ChR2, n = 7; control, n = 5, i, Behaviour raster plots from ChR2 (left) and control mice (right). ad, n = 14 (ChR2), 5 (control). e, n = 7 (ChR2), 7 (control). fh, n = 18 (ChR2), 5 (control). jm, Controls for optogenetic activation of ESR1VMHvl→MPOA axon terminals. j, Schematic. k, Number of USV syllables evoked by female urine during photostimulation with control mice. l, Probability of USVs with sham photostimulation. n = 7 (ChR2, cyan), 7 (control, grey). m, Per cent time spent USV+ mounting during photostimulation with control mice, triggered after mount onset. n = 6. np, Controls for optogenetic activation of ESR1∩VGATMPOA→VMHvl axon terminals. n, Schematic. o, Per cent time spent attacking during photostimulation with control mice. n = 6. p, Behaviour raster plots with male intruders from control (left) and ChR2 mice (right). q, Working hypothesis to reconcile imaging experiments and effects of functional manipulations of ESR1+ neurons in MPOA and VMHvl. Small circles are ESR1+ neurons, pink circles are neurons preferentially activated by female cues and blue circles are neurons preferentially activated by male cues. GOF, gain-of-function manipulation of neuronal activity (optogenetic or chemogenetic activation); LOF, loss-of-function manipulation of neuronal activity (optogenetic or chemogenetic). term. GOF, optogenetic stimulation of nerve terminals. See Supplementary Note 3 for details and explanations about the numbers in the neurons. a, b, d, f, h, k, m, o, Kruskal–Wallis test; c, g, Fisher’s test. Data are mean ± s.e.m. except for box plots (see Fig. 2 legend). All statistical tests are two-sided and corrected for multiple comparisons when necessary (Supplementary Table 2).
Fig. 1 |
Fig. 1 |. Female- and male-directed mounting are distinct male social behaviours.
a, Experimental design (top) and representative video stills for female- and male-directed mounting (bottom). RI, resident–intruder. b, c, Decoding the sex of the intruder from female- versus male-directed mounting. AU, arbitrary units. b, Projection of mouse pose features from mounting bouts onto the maximally discriminating dimension of the decoder. c, Decoder accuracy compared with shuffled data. Fifty-four behaviour sessions, Mann–Whitney U test, ***P = 0.0004. d, Schematic illustrating resident–intruder assay. Male intruder tests, n = 20; female intruder tests, n = 11. e, Representative spectrograms during female-directed (top) and male-directed (bottom) mounting. Scale, 100 ms. Asterisks indicate USV syllables. f, Representative raster plots indicating mount, USV and investigation episodes during interaction with female (top) or male (bottom) intruder. g, h, Distribution of social behaviours by a male mouse that was initially naive to male, across three consecutive days with a male (g) or female (h) intruder. See Extended Data Fig. 1h–j for details. AT, attack; MT, mount. i, j, Fraction of mice exhibiting mounting (i) and time spent mounting (j) on each test day. i, Fisher’s test, ***P = 0.0002; j, Kruskal–Wallis test, ****P < 0.0001. km, Fraction of mice exhibiting mounting with USVs (k), pelvic thrust (l) or attack (m) on each test day. n, o, Quantification of behaviours towards male intruders on each test day. n, Latency to first attack (Methods). n = 20, Friedman test, ***P = 0.0003, 0.0002. o, Fraction of mice exhibiting USV mount plus attack versus attack only. Data are mean ± s.e.m. All statistical tests are two-sided and corrected for multiple comparisons when necessary (Supplementary Table 2).
Fig. 2 |
Fig. 2 |. Distinct neural representations of USV+ and USV mounting in MPOAESR1 and VMHvlESR1 neurons.
a, Schematic illustrating dual-site fibre photometry. b, Representative GCaMP6s expression and optic fibre tract. Scale bars, 100 μm. n = 10. AC, anterior commissure; F, optic fibre tract. See Extended Data Fig. 2c, e for examples from control experiments. c, d, Averaged calcium signals in MPOAESR1 and in VMHvlESR1 aligned to mount onset (Methods). PETH, peri-event time histograms. d, Integrated activity during mounting. ***P = 0.001. USV+ mount, n = 10; USV mount, n = 6. e, Schematic of micro-endoscopic calcium imaging. GRIN, gradient index. f, Representative calcium activity raster during social encounters, sorted by intruder sex preference and response magnitude. Arrows, intruder introduction. g, Fraction of female- and male-preferring MPOAESR1 and VMHvlESR1 neurons. h, Main sources of variance in population activity (Methods). n = 4 for each region. i, j, Neural activity of example mount-activated neurons, shown as PETHs (normalized to 2.5 to 1.5 s before mount onset). Each pair of rasters is from the same neuron. k, l, Choice probabilities (CP) for female- or male-directed investigation versus USV+ or USV mounting (coloured bars indicate significance, Methods). m, n, Proportion of cells showing significance (Methods) and choice probability >0.7 for USV+ mounting, USV mounting or both. o, p, s, t, Average activity per neuron (σ, relative to pre-mount activity) during USV+ versus USV mounting. o, s, Scatter plots. p, t, Proportion of cells excited (>2σ) during mounting. q, r, u, v, Accuracy of time-evolving (q, u) or frame-wise (r, v) decoders predicting USV+ from USV mounting, trained on neural activity. n = 4, ****P < 0.0001. d, r, v, Mann–Whitney U test. Data are mean ± s.e.m., except in box plots (d), in which centre lines indicate medians, box edges represent the interquartile range and whiskers denote minimal and maximal values. All statistical tests are two-sided and corrected for multiple comparisons when necessary (Supplementary Table 2).
Fig. 3 |
Fig. 3 |. MPOAESR1∩VGAT neurons control male sexual behaviour.
a, Strategy to express ChR2 in MPOAESR1∩VGAT or MPOAESR1 neurons using sexually and socially experienced Esr1flp Vgatcre (blue bars) or Esr1flp (purple bars) mice. Con/Fon, Cre-ON/FLP-ON; fDIO, FLP-ON. b, ChR2 expression in MPOA in Esr1flp Vgatcre mice with boxed region magnified (right). Scale bars, 500 μm (left), 100 μm (right). n = 7. c, d, Optogenetically triggered mounting towards male intruders. c, Fraction of mice mounting. NS, not significant; ***P = 0.0006. d, Fraction of photostimulation trials with mounting. ****P < 0.0001. MPOAESR1∩VGAT, n = 7; MPOAESR1, n = 8. Off, sham photostimulation; On, during photostimulation (Extended Data Fig. 7). eg, ChR2-triggered USVs with male intruder. e, USV raster plots. f, Fraction of trials with USVs. g, Number of USV syllables per trial. n = 7. f, **P = 0.0012; g, **P = 0.0025. h, Per cent of mount bouts that were USV+ during photostimulation. Numbers indicate total mounts (USV+ and USV) observed. ik, Photostimulation of MPOAESR1∩VGAT neurons initiated during attack towards male intruder. i, Behaviour raster plots. j, Fraction of total time spent attacking. k, Fraction of attacks converted to USV+ mounts. n = 6. j, **P = 0.0027; k, **P = 0.0014. lo, Solitary male mice. l, Fraction of USV+ trials in solitary male mice during photostimulation. n = 7. **P = 0.0045. m, Strategy to optogenetically inhibit MPOAESR1 neurons in male Esr1cre mice. n, o, Female-urine-evoked USVs during MPOAESR1 photoinhibition (pale blue bar). n, Probability of USVs. GtACR2 mice, mice injected with GtACR2-coding AAV; control mice, mice injected with mCherry-coding AAV. o, Number of USV syllables. Orange, GtACR2, n = 7; grey, control, n = 8, ***P = 0.0008. Qualitatively similar results were obtained with iC++ inhibition of MPOAESR1∩VGAT neurons. c, Fisher’s test; d, f, g, j–l, o, Kruskal–Wallis test. Data are mean ± s.e.m. except for box plots (see Fig. 2 legend for box plot definitions). All statistical tests are two-sided and corrected for multiple comparisons when necessary (Supplementary Table 2).
Fig. 4 |
Fig. 4 |. VMHvlESR1 neurons promote aggressive mounting and inhibit USV production.
a, Strategy to optogenetically activate VMHvlESR1 neurons in naive male mice. b, ChR2 expression in VMHvl. Scale bar, 100 μm. n = 18. VMHdm/c, dorsomedial and central parts of the VMH. cg, Behaviours towards female intruders during photostimulation. ChR2 mice, mice injected with ChR2-coding AAV; control mice, mice injected with EYFP-coding AAV. ChR2, n = 14; control, n = 5. c, Fraction of mice displaying USV mounting. ****P < 0.0001. d, Per cent time spent USV mounting. ***P = 0.001. e, Per cent time spent in all mounting. f, Fraction of USV+ and USV mounts. ****P < 0.0001. g, Behaviour raster plots. hk, Behaviours towards castrated male intruders. ChR2, n = 18; control, n = 6. h, Fraction of mice displaying USV mounting. i, Per cent time spent USV mounting. ***P = 0.0003. j, Per cent time spent in all mounting. ***P = 0.0002. k, Fraction of USV+ and USV mounts. ****P < 0.0001. l, m, Spontaneous USVs towards female intruder during VMHvlESR1 photostimulation. l, USV raster plots. m, Number of USV syllables. ChR2, n = 14; control, n = 5. *P = 0.01. n, Female-urine-evoked USVs in solitary male mouse during photostimulation. ChR2, n = 14; control, n = 7. **P = 0.002. o, Strategy to optogenetically activate ESR1VMHvl→MPOA axon terminals. pr, Female-urine-evoked USVs and mounting during terminal stimulation. p, Probability of USVs. q, Number of USV syllables. ChR2, n = 7; control, n = 7, **P = 0.0065. r, Per cent time spent mounting during photostimulation, triggered after mount onset. ChR2, n = 5, ***P = 0.0006. s, Strategy to optogenetically activate ESR1∩VGATMPOA→VMHvl axon terminals. t, Per cent time spent attacking during photostimulation, triggered after attack onset. ChR2, n = 5, *P = 0.034. u, Summary of perturbation effects. GOF, gain-of-function effect; LOF, loss-of-function effect only; low and high denote relative stimulation intensities in optogenetic gain-of-function experiments. Function of minor cell populations (small circles) is hypothetical. More details are provided in Extended Data Fig. 10q, Supplementary Note 3. c, f, h, k, Fisher’s test. d, i, Wilcoxon test. e, j, m, n, q, r, t, Kruskal–Wallis test. Data are mean ± s.e.m., except for box plots (see Fig. 2 legend for definitions). All statistical tests are two-sided and corrected for multiple comparisons when necessary (Supplementary Table 2).

Similar articles

Cited by

References

    1. Bailey NW & Zuk M Same-sex sexual behavior and evolution. Trends Ecol. Evol 24, 439–446 (2009). - PubMed
    1. Nyby J Ultrasonic vocalizations during sex behavior of male house mice (Mus musculus): a description. Behav. Neural Biol 39, 128–134 (1983). - PubMed
    1. White NR, Prasad M, Barfield RJ & Nyby JG 40- and 70-kHz vocalizations of mice (Mus musculus) during copulation. Physiol. Behav 63, 467–473 (1998). - PubMed
    1. Holy TE & Guo Z Ultrasonic songs of male mice. PLoS Biol. 3, e386 (2005). - PMC - PubMed
    1. Segalin C et al. The mouse action recognition system (MARS): a software pipeline for automated analysis of social behaviors in mice. Preprint at 10.1101/2020.07.26.222299 (2020). - DOI - PMC - PubMed

Publication types

Substances