. 2020 Dec;588(7839):688-692.
doi: 10.1038/s41586-020-2996-z. Epub 2020 Dec 2.

Galactosaminogalactan activates the inflammasome to provide host protection

Affiliations

Galactosaminogalactan activates the inflammasome to provide host protection

Benoit Briard et al. Nature. 2020 Dec.

Erratum in

Abstract

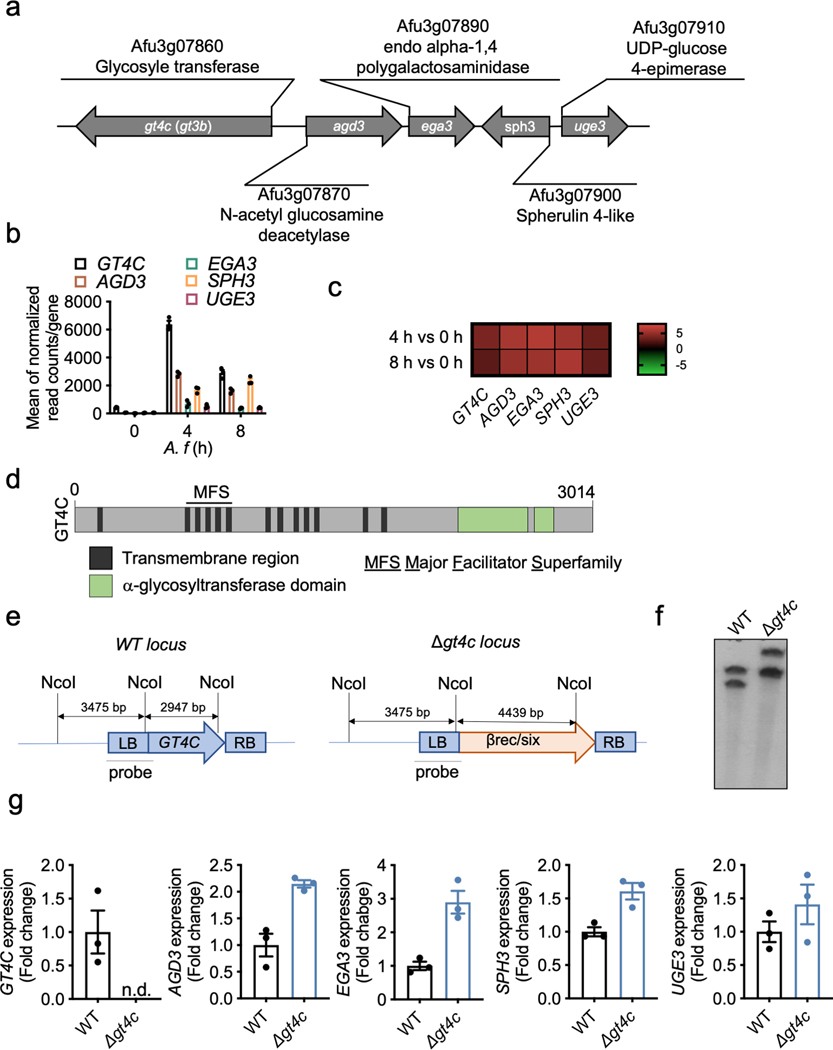
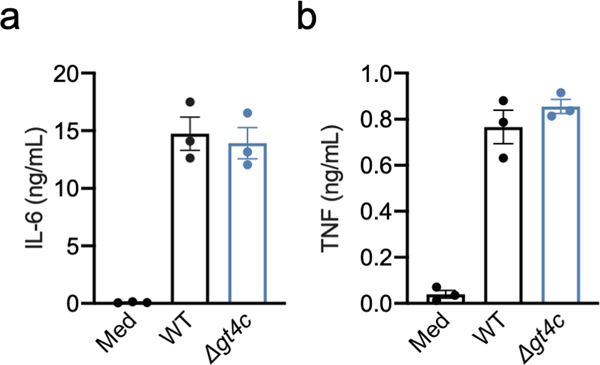
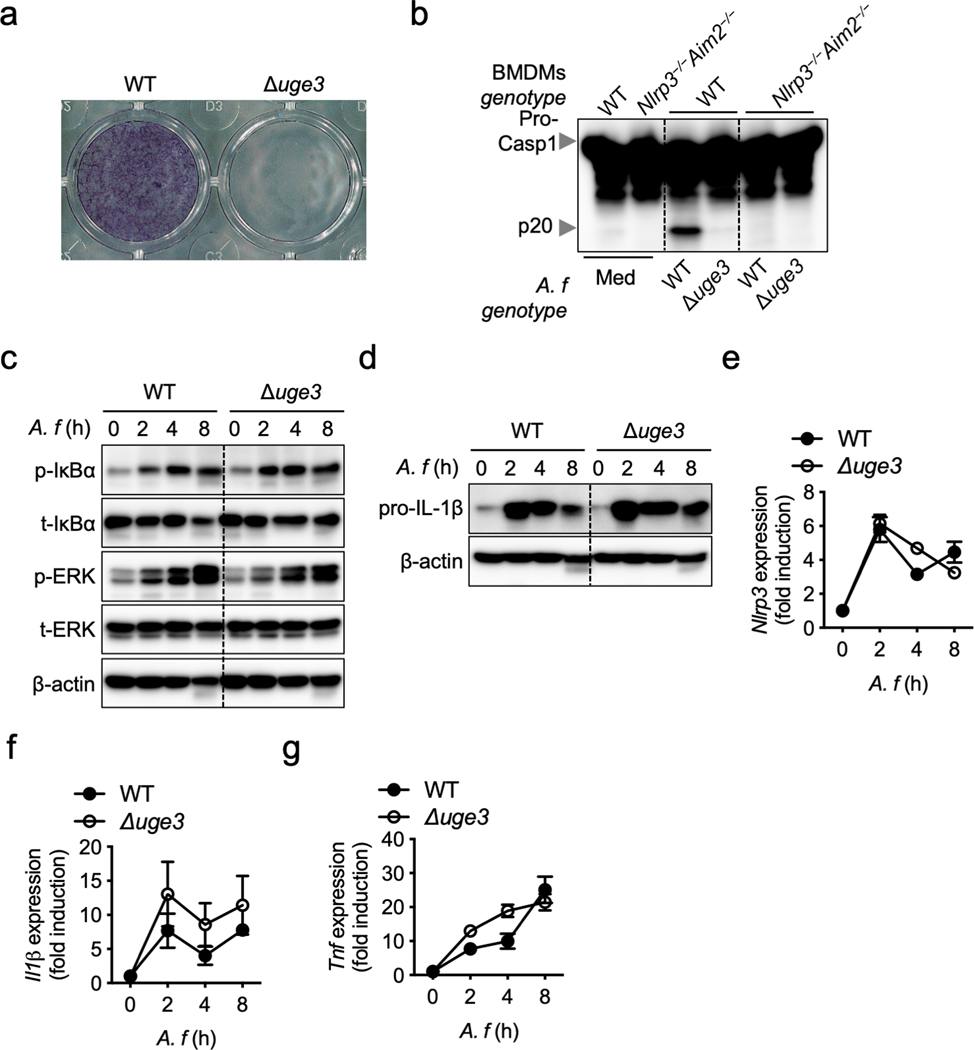
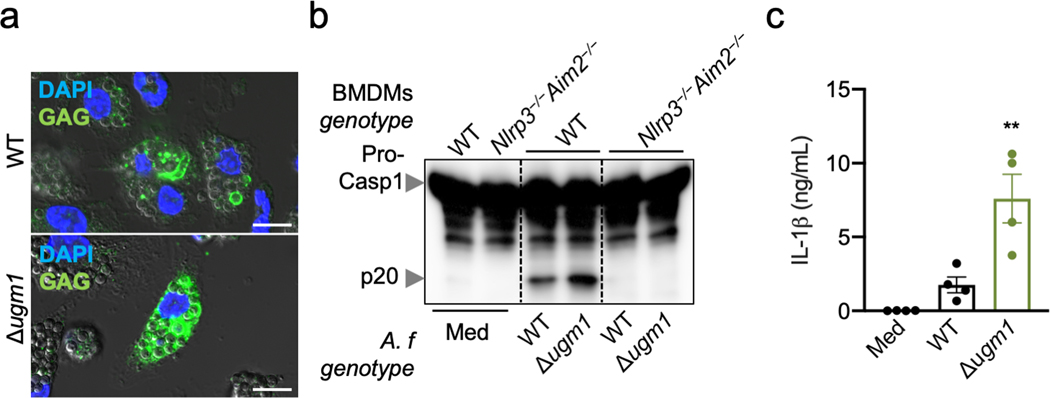
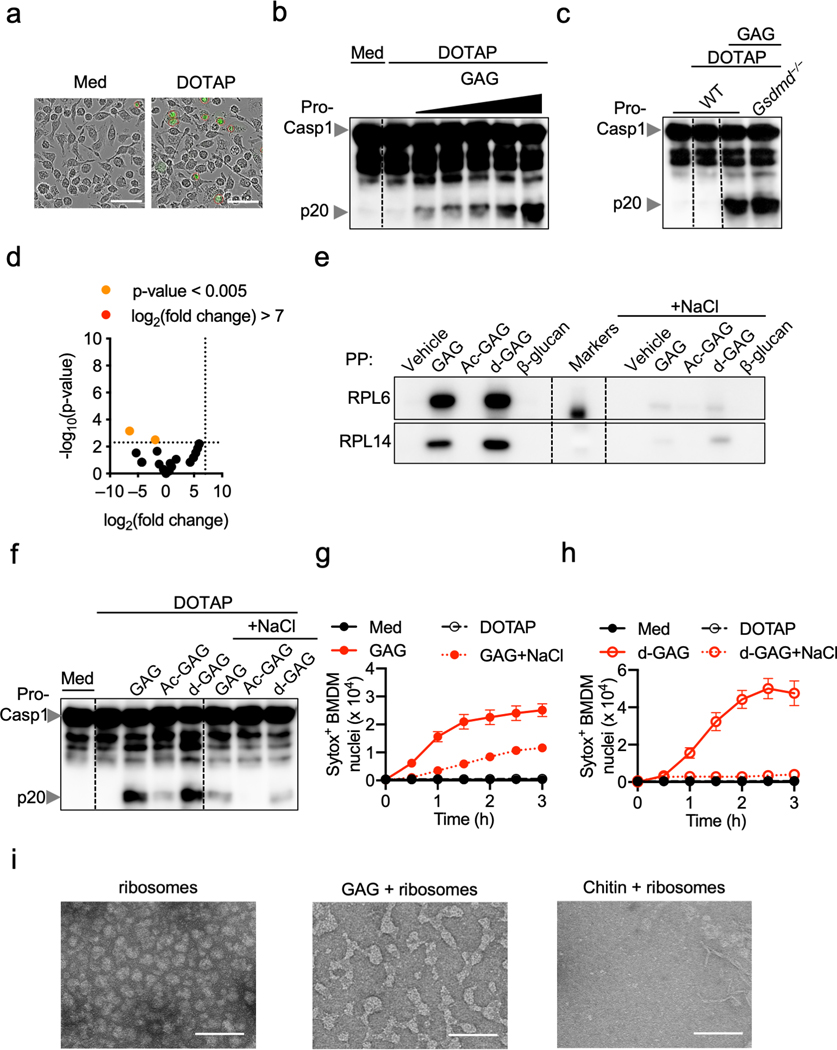
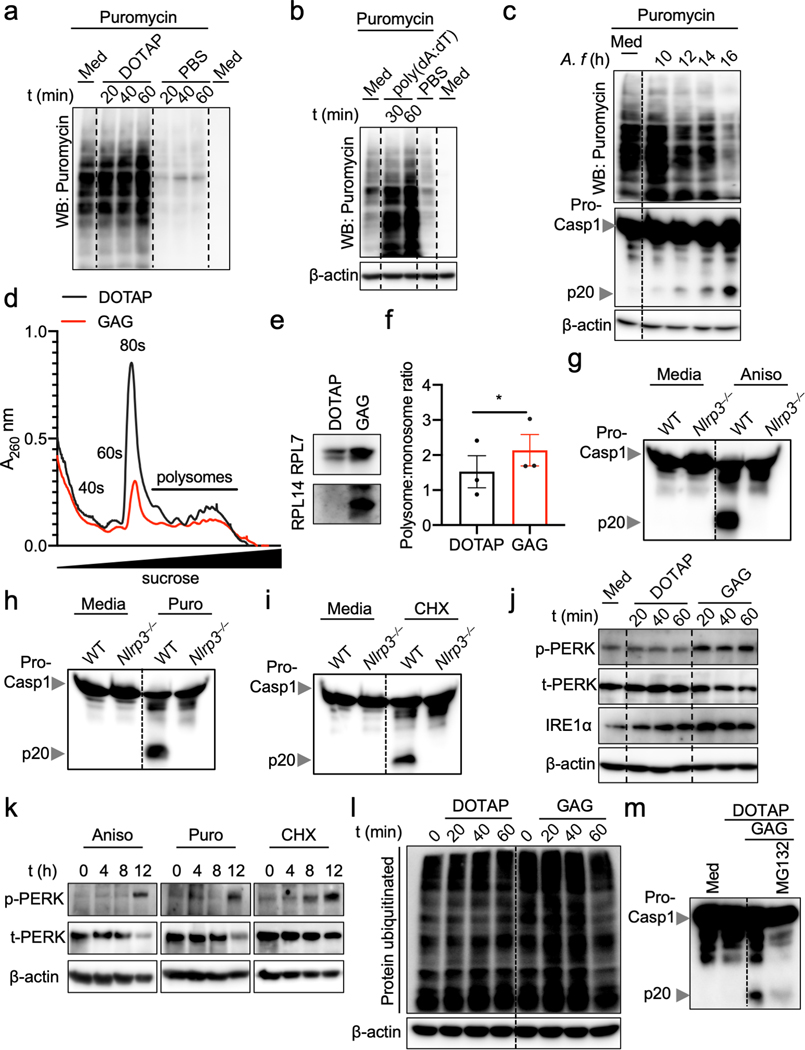
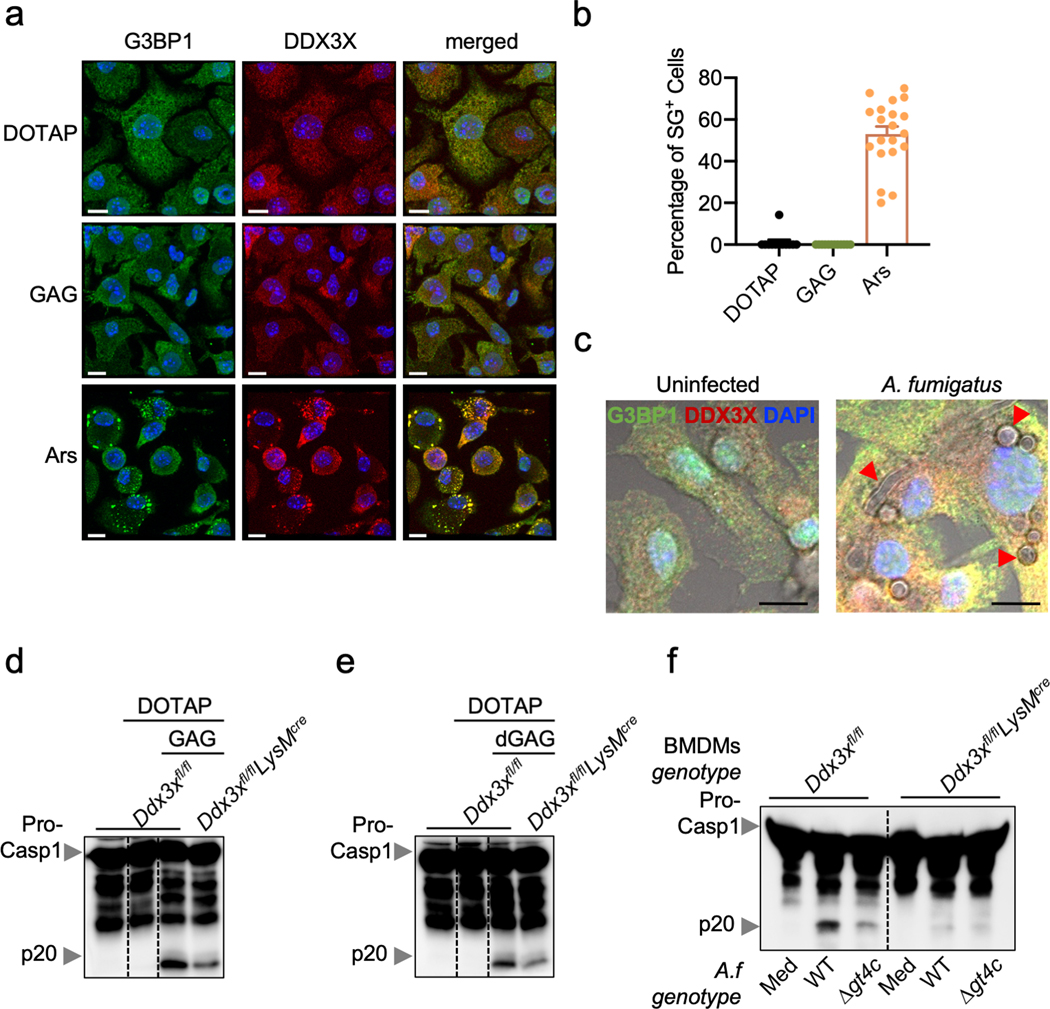
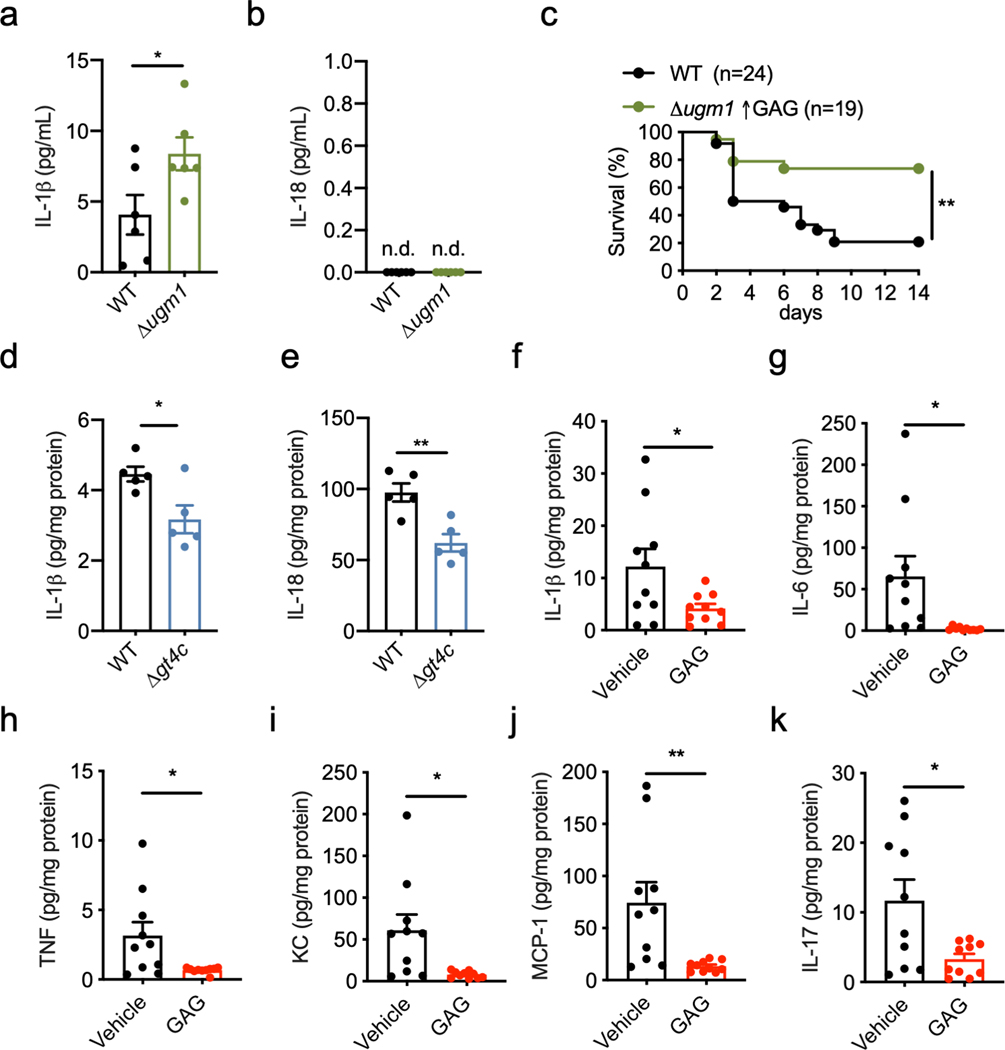
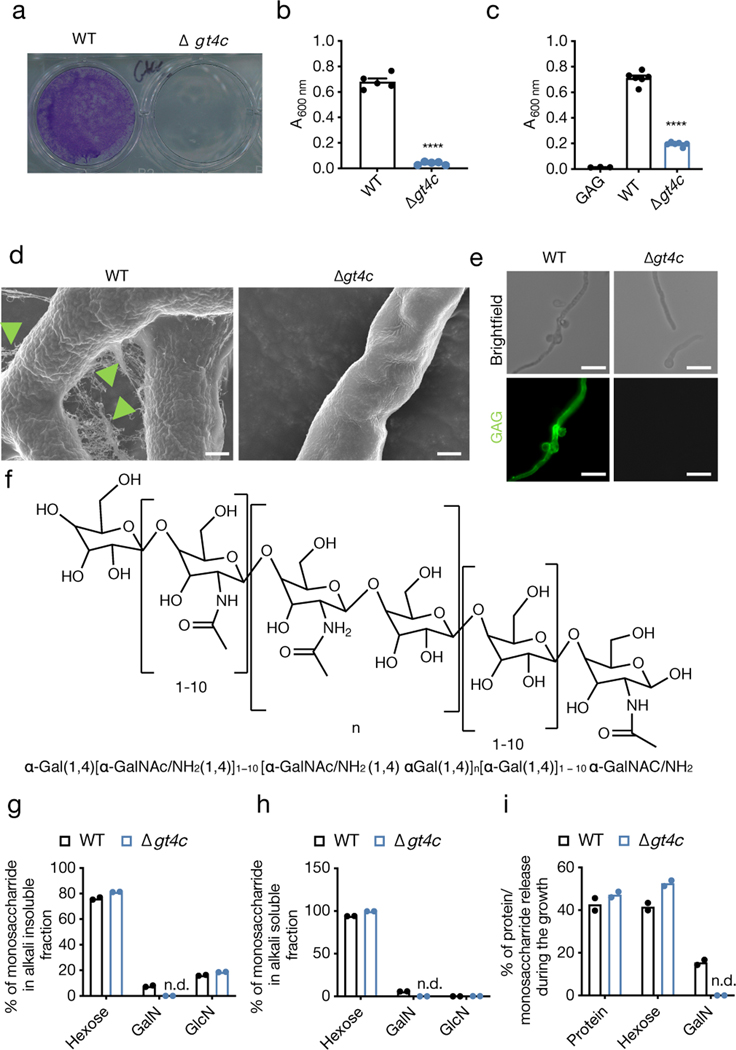
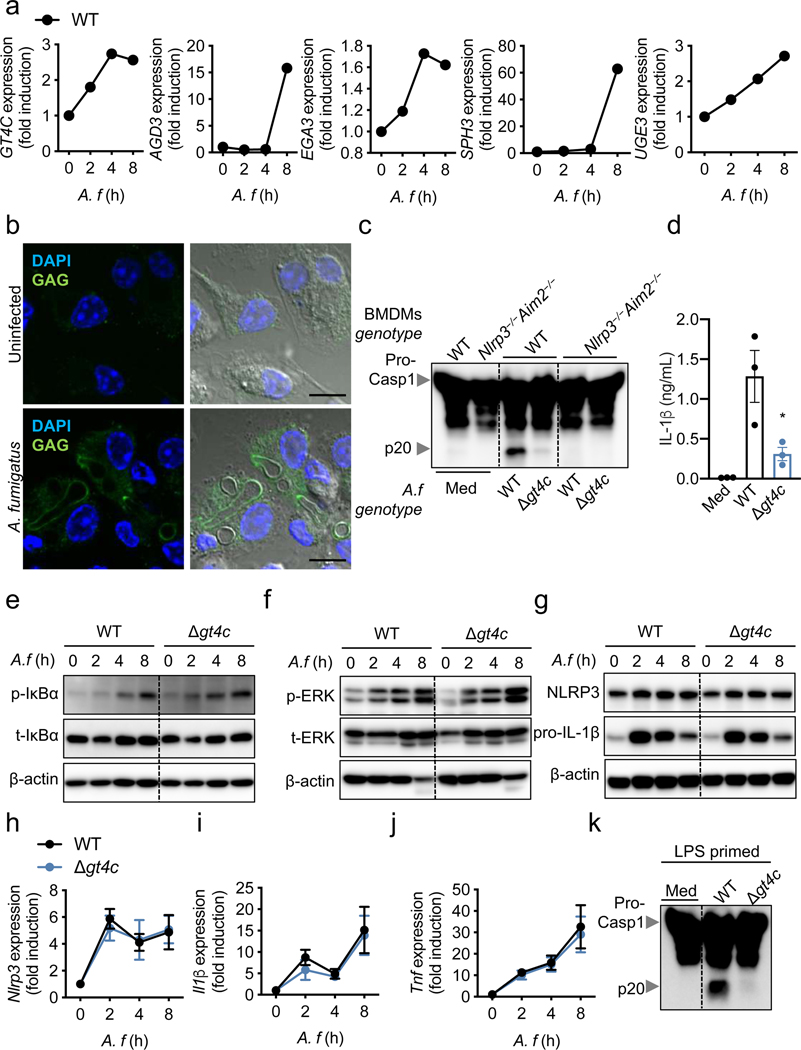
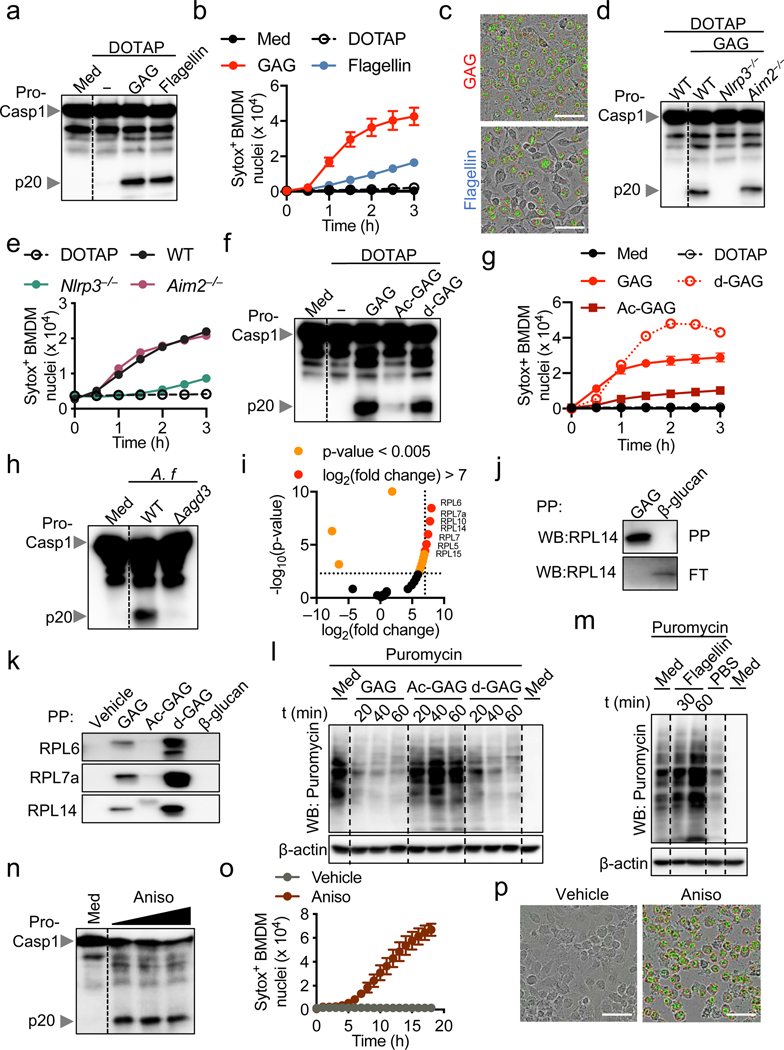
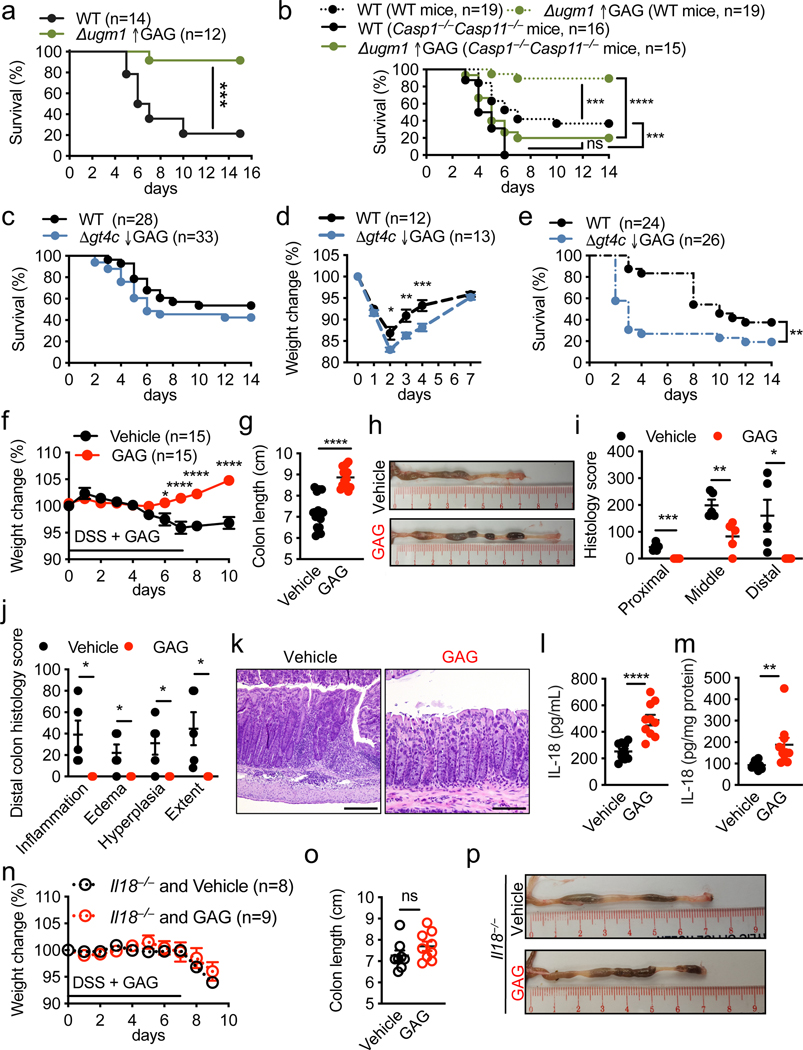
Inflammasomes are important sentinels of innate immune defence that are activated in response to diverse stimuli, including pathogen-associated molecular patterns (PAMPs)1. Activation of the inflammasome provides host defence against aspergillosis2,3, which is a major health concern for patients who are immunocompromised. However, the Aspergillus fumigatus PAMPs that are responsible for inflammasome activation are not known. Here we show that the polysaccharide galactosaminogalactan (GAG) of A. fumigatus is a PAMP that activates the NLRP3 inflammasome. The binding of GAG to ribosomal proteins inhibited cellular translation machinery, and thus activated the NLRP3 inflammasome. The galactosamine moiety bound to ribosomal proteins and blocked cellular translation, which triggered activation of the NLRP3 inflammasome. In mice, a GAG-deficient Aspergillus mutant (Δgt4c) did not elicit protective activation of the inflammasome, and this strain exhibited enhanced virulence. Moreover, administration of GAG protected mice from colitis induced by dextran sulfate sodium in an inflammasome-dependent manner. Thus, ribosomes connect the sensing of this fungal PAMP to the activation of an innate immune response.


Figures

Extended Data Fig. 1.
Extended Data Fig. 1.. Identification of A. fumigatus GAG synthase.
a, Schematic of GAG synthase cluster. b, RNAseq analysis during A. fumigatus growth (0, 4 and 8 h) from Mouyna et al.; gene expressions are represented by mean of normalized read count/gene for the GT4C cluster (n = 3 biologically independent samples). Data are mean +/− SEM. c, Heatmap showing differential gene expression of A. fumigatus at 4 h (swollen conidia) and 8 h (germinated conidia) compared to 0 h (resting conidia). d, Schematic representation of the GT4C protein with transmembrane regions (black), α-glycosyltransferase domains (green) and major facilitator superfamily domain (MFS) predicted from amino acid sequence with InterProscan 5. e, Schematic representation of wild type (WT) and Δgt4c locus with NcoI restriction sites and Southern blot probe used to control the GT4C gene deletion. f, Southern blot using GT4C probe with WT and Δgt4c purified DNA from one experiment. g, Real-time quantitative RT-PCR analysis of GT4C, AGD3, EGA3, SPH3 and UGE3 A. fumigatus genes in wild type (WT) and Δgt4c strains (8 h in LB medium, 37°C and 250 rpm) presented relative to that of the gene encoding A. fumigatus TEF1. n.d., not detected (n = 3 biologically independent samples). Data are mean +/− SEM.
Extended Data Fig. 2.
Extended Data Fig. 2.. Absence of GAG does not affect release of non-inflammasome dependent cytokines.
Release of (a) IL-6 and (b) TNF from unprimed bone marrow-derived macrophages (BMDMs) left uninfected (Med) or assessed 20 h after infection with A. fumigatus wild type (WT) or Δgt4c strain (multiplicity of infection, 10), (n = 3 independent biological samples). Data are mean +/− SEM.
Extended Data Fig. 3.
Extended Data Fig. 3.. UGE3 potentiates A. fumigatus-induced inflammasome activation.
a, Assessment of biofilm formation on an abiotic surface with A. fumigatus (A. f) wild type (WT) and deletion mutant strain Δuge3. b, Immunoblot analysis of pro-caspase-1 (pro-Casp1; p45) and the active caspase-1 subunit (p20) from unprimed bone marrow-derived macrophages (BMDMs) left untreated (medium alone [Med]) or measured 20 h after infection with the indicated A.f live resting conidia (multiplicity of infection [MOI], 10). Representative images (n ≥ 3 independent experiments). c, Immunoblot analysis of phospho- and total-IκBα (p-IκBα, t-IκBα) or phospho- and total-ERK1/2 (p-ERK, t-ERK) from unprimed WT BMDMs 0–8 h after infection with WT or Δuge3 mutant A.f live resting conidia (MOI, 10). Representative images (n ≥ 3 independent experiments). d, Immunoblot analysis of pro–IL-1β from unprimed BMDMs 0–8 h after infection with WT or Δuge3 mutant A.f live resting conidia (MOI, 10). Representative images (n ≥ 3 independent experiments). e–g, Real-time quantitative RT-PCR analysis of Nlrp3, Il1β and Tnf genes from WT BMDMs 0–8 h after infection with WT or Δuge3 mutant A. f live resting conidia presented relative to that of the gene encoding β-actin (n = 4 biologically independent samples). Data are mean +/− SEM.
Extended Data Fig. 4.
Extended Data Fig. 4.. Over-synthesis of GAG induces hyper-inflammasome activation.
a, Immunofluorescence staining of A. fumigatus (A.f) GAG (green) and bone marrow-derived macrophage (BMDM) nuclei (blue) in unprimed BMDMs 4 h after infection with A. fumigatus (A. f) wild type (WT) or Δugm1 resting conidia (multiplicity of infection [MOI], 10). Scale bars, 10 μm. Representative images (n ≥ 3 independent experiments). b, Immunoblot analysis of pro–caspase-1 (pro-Casp1; p45) and the active caspase-1 subunit (p20) of unprimed BMDMs left untreated (medium alone [Med]) or assessed 20 h after infection with the indicated live A. f resting conidia genotype (WT or A. f deletion mutant Δugm1) (MOI, 10). Representative images (n ≥ 3 independent experiments). c, Release of IL-1β from unprimed BMDMs left uninfected (Med) or assessed 20 h after infection with A. f (MOI, 10). **P = 0.0046 (unpaired two-tailed t-test). (n = 4 biologically independent samples). Data are mean +/− SEM.
Extended Data Fig. 5.
Extended Data Fig. 5.. GAG induces caspase-1 cleavage in a dose- and charge-charge interaction-dependent manner and interacts with ribosomes.
a, Representative images of bone marrow-derived macrophages (BMDMs) in medium (Med) or during treatment with DOTAP alone (green fluorescence corresponds to Sytox green nuclei, and Sytox green-positive nuclei are marked with a red circle). Scale bars, 10 μm. Representative images (n ≥ 3 independent experiments). b, Immunoblot analysis of pro–caspase-1 (pro-Casp1; p45) and the active caspase-1 subunit (p20) of BMDMs left untreated (medium alone [Med]) or assessed 3 h after transfection with increasing concentrations of GAG or vehicle alone (DOTAP). Representative images (n ≥ 3 independent experiments). c, Immunoblot analysis of caspase-1 during transfection with GAG in wild type (WT) and Gsdmd−/− BMDMs. Representative images (n ≥ 3 independent experiments). d, Volcano plot of the polysaccharide pull down mass spectrometry analysis of the β-glucan interactome with BMDM cytosolic proteins versus control. Proteins with P value < 0.005 are orange highlighted and proteins with P value < 0.005 and log2(fold change) > 7 compared to control are red highlighted (none identified); P value was determined by the G-test and exact P values are presented in Supplemental Table 1. e, Immunoblot analysis of ribosomal proteins interacting with GAG, Ac-GAG, d-GAG or β-glucan or vehicle with or without NaCl. Representative images (n ≥ 3 independent experiments). f, Immunoblot analysis of caspase-1 from BMDMs assessed after 3 h incubation with GAG, Ac-GAG or d-GAG with or without NaCl. Representative images (n ≥ 3 independent experiments). g, h, Measurement of cell death by Sytox green staining during GAG and d-GAG treatment with or without NaCl (n = 3 biologically independent samples). Data are mean +/− SEM. i, Electron microscopy pictures of ribosomes, GAG + ribosomes and chitin + ribosomes with negative staining; data from one experiment. Scale bars, 100 nm.
Extended Data Fig. 6.
Extended Data Fig. 6.. GAG inhibits translation and induces endoplasmic stress.
a-c Immunoblot analysis of translation rate in bone marrow-derived macrophages (BMDMs) by puromycin integration into proteins during (a) vehicle (DOTAP) or PBS incubation, (b) poly(dA:dT) transfection or (c) A. fumigatus (A. f) infection and caspase-1 activation during A. f infection. Representative images (n ≥ 2 independent experiments). d, Polysome profiling during DOTAP or DOTAP + GAG treatments. e, Immunoblot analysis of the cell pellet after polysome profiling. Representative images (n ≥ 2 independent experiments). f, Polysome:monosome ratio during DOTAP or DOTAP + GAG treatments. Data are mean +/− SEM. *P = 0.0366 (paired two-tailed t-test) (n = 3 biologically independent samples). g−i, Immunoblot analysis of pro–caspase-1 (pro-Casp1; p45) and the active caspase-1 subunit (p20) of wild type (WT) or Nlrp3−/− BMDMs assessed after 16 h incubation with (g) 25 μg/mL anisomycin (Aniso), (h) 50 μg/mL puromycin (Puro) or (i) 50 μg/mL cycloheximide (CHX). Representative images (n ≥ 2 independent experiments). j,k, Immunoblot analysis of PERK activation (p-PERK) and IRE1α induction during (j) GAG transfection or (k) PERK activation during treatment with translation inhibitors. Representative images (n ≥ 2 independent experiments). l, Immunoblot analysis of proteins ubiquitinated during GAG transfection. Representative images (n ≥ 2 independent experiments). m, Immunoblot analysis of caspase-1 of BMDMs left untreated (medium alone [Med]) or assessed 3 h after transfection with GAG and treated with MG132. Representative images (n ≥ 2 independent experiments).
Extended Data Fig. 7.
Extended Data Fig. 7.. Stress granules are not induced by GAG.
a, Immunofluorescence staining of G3BP1 (green), DDX3X (red) and bone marrow-derived macrophage (BMDM) nuclei (blue) in unprimed BMDMs 40 min after transfection with GAG or incubation with arsenite (Ars). Representative images (n ≥ 2 independent experiments). b, Quantification of the percentage of stress granule-positive cells after transfection with GAG, vehicle (DOTAP) alone or Ars. (n > 10 biologically independent fields of cells). Data are mean +/− SEM. c, Immunofluorescence staining of G3BP1 (green), DDX3X (red) and BMDM nuclei (blue) in unprimed BMDMs 15 h after infection with A. fumigatus. Representative images (n ≥ 2 independent experiments). d,e, Immunoblot analysis of pro–caspase-1 (pro-Casp1; p45) and the active caspase-1 subunit (p20) of BMDMs assessed 3 h after transfection with vehicle (DOTAP), (d) GAG or (e) d-GAG. Representative images (n ≥ 2 independent experiments). f, Immunoblot analysis of caspase-1 from BMDMs left untreated (medium alone [Med]) or infected with A. fumigatus (A.f) WT or deletion mutant Δgt4c (multiplicity of infection [MOI], 10). Representative images (n ≥ 2 independent experiments). (a, c) Scale bars, 10 μm.
Extended Data Fig. 8.
Extended Data Fig. 8.. GAG-induced proinflammatory cytokine secretion during aspergillosis and DSS-induced colitis.
a,b, Level of IL-1β (a) and IL-18 (b) in bronchioalveolar lavage 2 days after infection with wild type (WT) or Δugm1 strains of A. fumigatus. (a) *P = 0.036. Unpaired two-tailed t-test. (n = 6 independent samples). Data are mean +/− SEM. c, Survival of 7- to 8-week-old immunocompetent WT mice infected intravenously with 1 × 10⁶ A. fumigatus resting conidia (WT or Δugm1). **P = 0.0014. Log-rank (Mantel-Cox) test. d, e Level of IL-1β (d) and IL-18 (e) in liver homogenates after infection with WT or Δgt4c strains. (d) *P = 0.0209; (e) **P = 0.0041. Unpaired two-tailed t-test. (n = 5 independent samples). Data are mean +/− SEM. f–k, Concentration of cytokines in colon homogenates after dextran sulfate sodium (DSS) water supplementation and treatment with GAG or vehicle (Vehicle and GAG, n = 10 each). (f) *P = 0.0336; (g) *P = 0.0181; (h) *P = 0.0188; (i) *P = 0.0115; (j) **P = 0.0066; (k) *P = 0.0154. Unpaired two-tailed t-test. n.d., not detected. Data are mean +/− SEM.
Fig. 1.
Fig. 1.. A. fumigatus GT4C regulates GAG synthesis.
a, Biofilm formation assay on an abiotic surface with A. fumigatus wild type (WT) and Δgt4c. Representative image. b, c, Quantification of biofilm formation on an abiotic surface (b) in absence or (c) presence of exogenous GAG in Brian medium by crystal violet absorbance at 600 nm wavelength (A600 nm). (b, n = 5 and c, n = 6 biologically independent samples; ****P < 0.0001; unpaired two-tailed t-test). Data are mean +/− SEM. Exact P values are presented in Extended Data Table 2. d, Scanning electron microscopy of A. fumigatus WT or Δgt4c hyphae surface incubated for 20 h in Brian medium (green arrowhead indicates ECM composed of GAG). e, Immunofluorescence staining of fungal GAG (green) on mycelium of A. fumigatus WT or Δgt4c. (d,e, Representative images, n ≥ 2 independent experiments). f, Representative structure of A. fumigatus GAG. g–i, Percentage of monosaccharides in (g) alkali insoluble or (h) alkali soluble cell wall fractions and (i) percentage of monosaccharides or proteins in culture supernatant from WT and Δgt4c A. fumigatus (n = 2 biologically independent samples; bar depicts mean). GalN, galactosamine; GlcN, glucosamine; n.d., not detected. Scale bars, (d) 1 μm; (e) 10 μm.
Fig. 2.
Fig. 2.. GT4C potentiates A. fumigatus-induced inflammasome activation.
a, RT-PCR analysis of GT4C, AGD3, EGA3, SPH3 and UGE3 A. fumigatus (A.f) genes from the wild type (WT) strain in unprimed bone marrow-derived macrophages (BMDMs) 0–8 h after infection relative to quantification of A. f TEF1 (n = 2 biologically independent samples; mean plotted). b, Immunofluorescence staining of A.f GAG (green) and BMDM nuclei (blue) in unprimed BMDMs 12 h after infection. Scale bars, 10 μm. Representative images (n ≥ 3 independent experiments). c, Immunoblot analysis of pro-caspase-1 (pro-Casp1; p45) and cleaved caspase-1 (p20) of unprimed BMDMs left untreated (medium alone [Med]) or assessed 20 h after infection (multiplicity of infection [MOI], 10). Representative images (n ≥ 3 independent experiments). d, Release of IL-1β from unprimed BMDMs left uninfected (Med) or assessed 20 h after infection (MOI, 10) (n = 3 biologically independent samples). Data are mean +/− SEM. *P < 0.05 (one-way ANOVA with Dunnett’s multiple-comparisons test). Exact P values are presented in Extended Data Table 2. e, f, Immunoblot analysis of (e) phospho- and total-IκBα (p-IκBα, t-IκBα) or (f) phospho- and total-ERK1/2 (p-ERK, t-ERK) in unprimed WT BMDMs 0–8 h after infection (MOI, 10). Representative images (n ≥ 3 independent experiments). g, Immunoblot analysis of NLRP3 and pro–IL-1β in unprimed BMDMs 0–8 h after infection (MOI, 10). Representative images (n ≥ 3 independent experiments). h–j, RT-PCR analysis of Nlrp3, Il1β and Tnf in WT BMDMs 0–8 h after infection presented relative to quantification of the gene encoding β-actin (n = 4 biologically independent samples). Data are mean +/− SEM. k, Immunoblot analysis of pro– and cleaved caspase-1 of BMDMs primed with LPS and left untreated (Med) or assessed 20 h after infection (MOI, 10). Representative images (n ≥ 3 independent experiments).
Fig. 3.
Fig. 3.. Galactosamine of GAG interacts with ribosomes, inhibits translation and induces NLRP3 inflammasome activation.
a, Immunoblot analysis of pro-caspase-1 (pro-Casp1; p45) and cleaved caspase-1 (p20) of bone marrow-derived macrophages (BMDMs) left untreated (medium alone [Med]) or assessed 3 h after indicated transfection. Representative images (n ≥ 3 independent experiments). b, Cell death during indicated transfection (n = 3 biologically independent samples). c, Cell death induced during GAG or flagellin transfection after 3 h. Scale bars, 50 μm. Representative images (n ≥ 3 independent experiments). d, e, Immunoblot analysis of caspase-1 (d) and cell death (e) of indicated BMDMs transfected with GAG or WT transfected with DOTAP alone. d, Representative images (n ≥ 3 independent experiments); e, (n = 1). f, g, Immunoblot analysis of caspase-1 (f) and cell death (g) of WT BMDMs transfected with indicated stimuli. Representative images (n = 3 independent experiments). h, Immunoblot analysis of caspase-1 from BMDMs infected with A. fumigatus (A.f) WT (AF293) or Δagd3 (MOI, 10). Representative images (n ≥ 3 independent experiments). i, Volcano plot of the polysaccharide pull down (PP) of the GAG interactome with BMDM cytosolic proteins versus control. P values were determined by the G-test and are presented in Supplemental Table 1. j, Immunoblot analysis of RPL14 interacting with GAG or β-glucan after PP or in the corresponding flow through (FT). k, Immunoblot analysis of ribosomal proteins interacting with indicated sample. l, m, Immunoblot analysis of translation rate by puromycin integration during indicated transfections. n, Immunoblot analysis of caspase-1 from BMDMs assessed after 16 h with increasing concentrations of anisomycin (Aniso, 25, 50, and 100 μg/mL). jn, Representative images (n ≥ 3 independent experiments). o, Cell death during Aniso treatment (n = 2 [vehicle] and 3 [Aniso] biologically independent samples). p, Cell death induced during Aniso treatment. Scale bars, 50 μm. Representative images (n ≥ 3 independent experiments). b, g, o, Data are mean +/− SEM.
Fig. 4.
Fig. 4.. GAG-induced inflammasome activation provides host protection against aspergillosis and DSS-induced colitis.
ac, Survival of wild type (WT) or Casp1−/−Casp11−/− immunosuppressed mice immunosuppressed infected intranasally with (a, b) 1 × 10⁶ A. fumigatus, or (c) with 5 × 10⁵ A. fumigatus. d, Weight change of immunocompetent WT mice infected intranasally with 5 × 10⁷ A. fumigatus. e, Survival of immunocompetent WT mice infected intravenously with 1 × 10⁶ A. fumigatus. f, Weight change of WT mice during dextran sulfate sodium (DSS) hydric supplementation and treatment with GAG (red) or vehicle (black) by intraperitoneal injection. g, Colon length of WT mice treated with GAG (red) or vehicle (black) (GAG and Vehicle, n = 15 each). h, Representative images of colon from (g) at day 10. i, j, Histology scores of the colon at day 10 (GAG and Vehicle, n = 5 each). k, Representative images of hematoxylin and eosin staining of distal colon at day 10. Scale bars, 200 μm. l, m, Concentrations of IL-18 in (l) serum and (m) colon tissue homogenates at day 10 (Vehicle and GAG, n = 10 each). n, Weight change of Il18−/− mice during DSS hydric supplementation and treatment with GAG or vehicle by intraperitoneal injection. o, Colon length of Il18−/− mice treated with GAG (red, n = 9) or vehicle (black, n = 8). p, Representative images of colon from (o) at day 10. ns, not significant, *P < 0.05, **P < 0.01, ***P < 0.001 and ****P < 0.0001, (ac, e) log-rank (Mantel-Cox) test, (d, f, n) 2-way ANOVA with Holm-Sidak’s multiple comparisons test, and (g, i, j, l, m, o) unpaired two-tailed t-test. Exact P values are presented in Extended Data Table 2. d, f, g, i, j, l–o, Data are mean +/− SEM.

References

    1. Man SM, Karki R & Kanneganti TD Molecular mechanisms and functions of pyroptosis, inflammatory caspases and inflammasomes in infectious diseases. Immunol Rev 277, 61–75, doi: 10.1111/imr.12534 (2017). - DOI - PMC - PubMed
    1. Briard B et al. Fungal ligands released by innate immune effectors promote inflammasome activation during Aspergillus fumigatus infection. Nat Microbiol 4, 316–327, doi: 10.1038/s41564-018-0298-0 (2019). - DOI - PMC - PubMed
    1. Karki R et al. Concerted Activation of the AIM2 and NLRP3 Inflammasomes Orchestrates Host Protection against Aspergillus Infection. Cell Host Microbe 17, 357–368, doi: 10.1016/j.chom.2015.01.006 (2015). - DOI - PMC - PubMed
    1. Said-Sadier N, Padilla E, Langsley G & Ojcius DM Aspergillus fumigatus stimulates the NLRP3 inflammasome through a pathway requiring ROS production and the Syk tyrosine kinase. PLoS One 5, e10008, doi: 10.1371/journal.pone.0010008 (2010). - DOI - PMC - PubMed
    1. Latgé JP, Beauvais A & Chamilos G. The Cell Wall of the Human Fungal Pathogen Aspergillus fumigatus: Biosynthesis, Organization, Immune Response, and Virulence. Annu Rev Microbiol 71, 99–116, doi: 10.1146/annurev-micro-030117-020406 (2017). - DOI - PubMed

Publication types

MeSH terms