. 2020 Dec 1;11(6):1374-1394.
doi: 10.14336/AD.2020.1020. eCollection 2020 Dec.

Hippocampal Neural Stem Cell Grafting after Status Epilepticus Alleviates Chronic Epilepsy and Abnormal Plasticity, and Maintains Better Memory and Mood Function

Affiliations

Hippocampal Neural Stem Cell Grafting after Status Epilepticus Alleviates Chronic Epilepsy and Abnormal Plasticity, and Maintains Better Memory and Mood Function

Bharathi Hattiangady et al. Aging Dis. .

Abstract

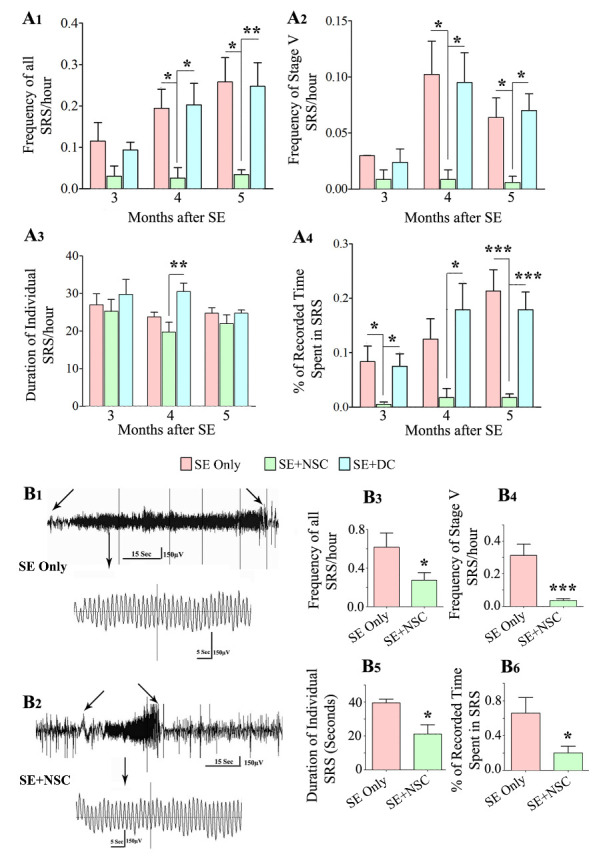
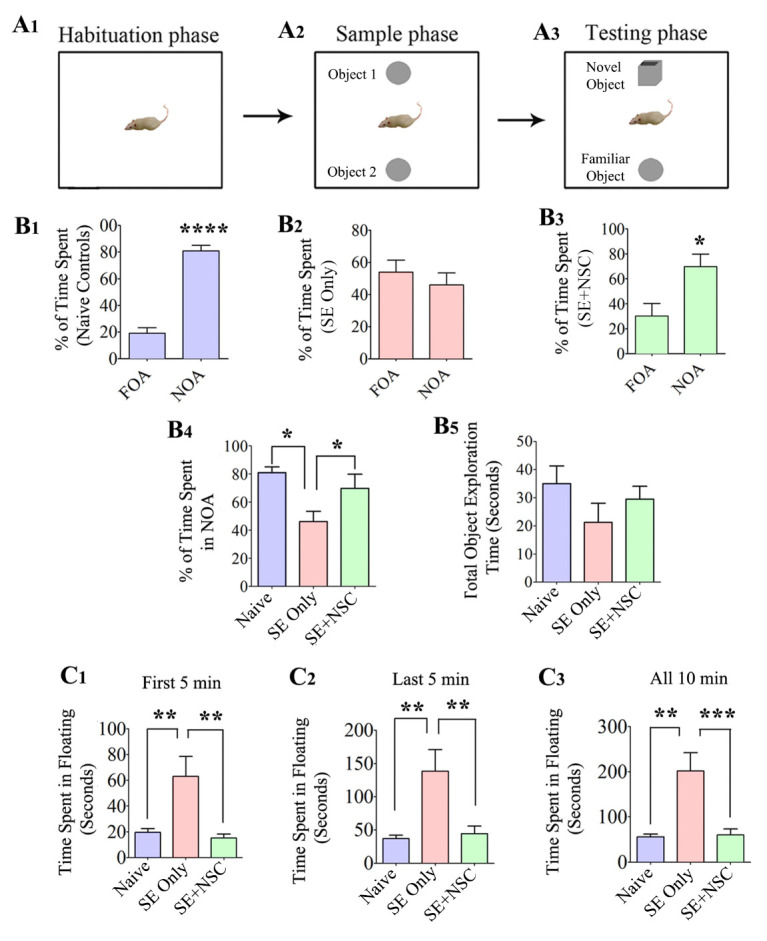
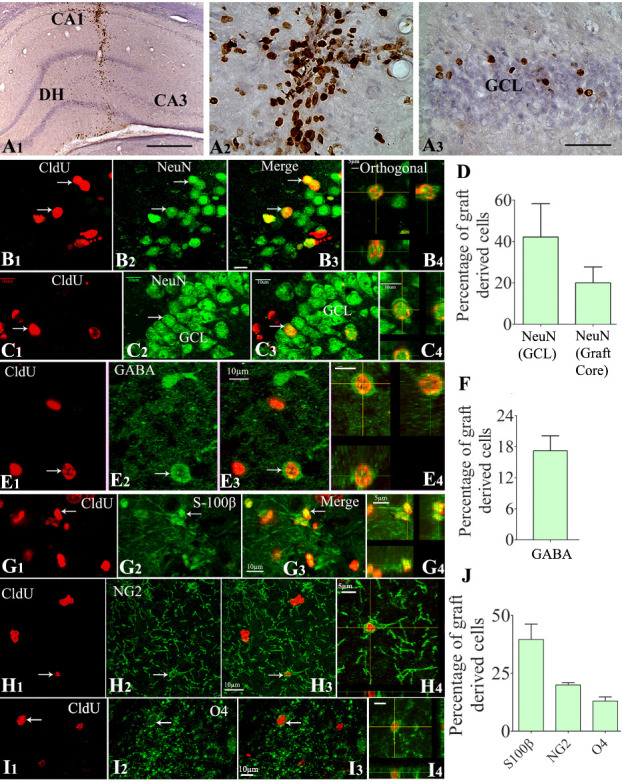
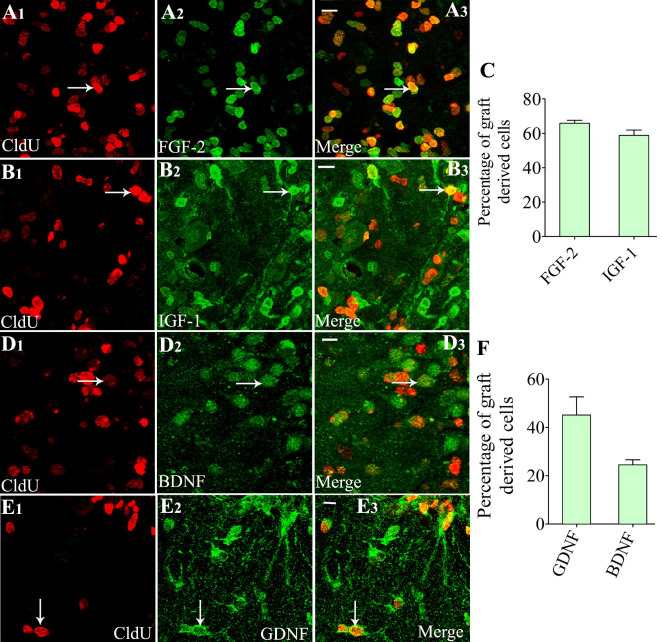
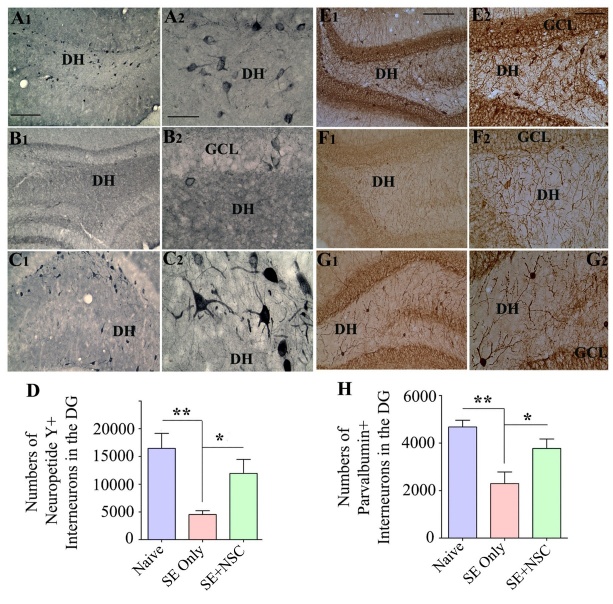
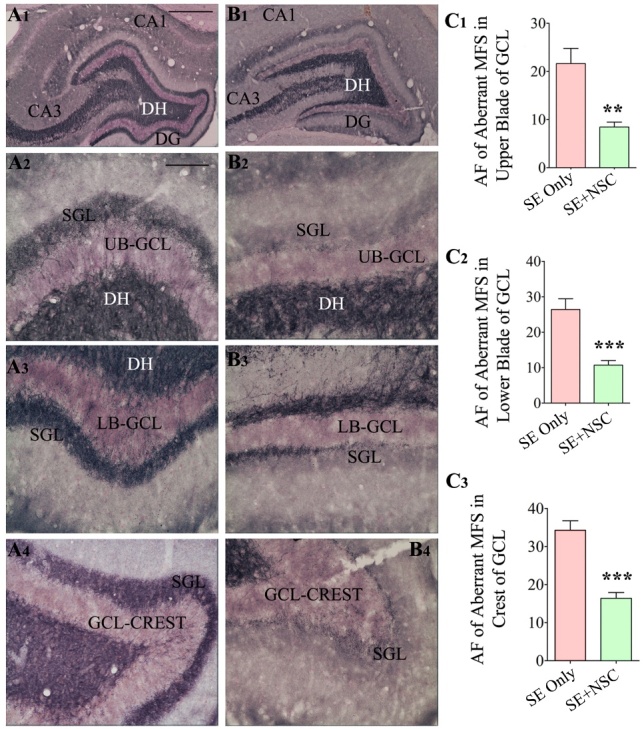
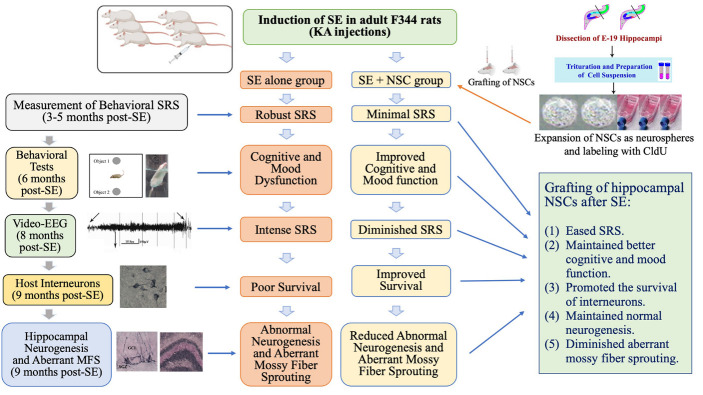
Hippocampal damage after status epilepticus (SE) leads to multiple epileptogenic changes, which lead to chronic temporal lobe epilepsy (TLE). Morbidities such as spontaneous recurrent seizures (SRS) and memory and mood impairments are seen in a significant fraction of SE survivors despite the administration of antiepileptic drugs after SE. We examined the efficacy of bilateral intra-hippocampal grafting of neural stem/progenitor cells (NSCs) derived from the embryonic day 19 rat hippocampi, six days after SE for restraining SE-induced SRS, memory, and mood impairments in the chronic phase. Grafting of NSCs curtailed the progression of SRS at 3-5 months post-SE and reduced the frequency and severity of SRS activity when examined at eight months post-SE. Reduced SRS activity was also associated with improved memory function. Graft-derived cells migrated into different hippocampal cell layers, differentiated into GABA-ergic interneurons, astrocytes, and oligodendrocytes. Significant percentages of graft-derived cells also expressed beneficial neurotrophic factors such as the fibroblast growth factor-2, brain-derived neurotrophic factor, insulin-like growth factor-1 and glial cell line-derived neurotrophic factor. NSC grafting protected neuropeptide Y- and parvalbumin-positive host interneurons, diminished the abnormal migration of newly born neurons, and rescued the reelin+ interneurons in the dentate gyrus. Besides, grafting led to the maintenance of a higher level of normal neurogenesis in the chronic phase after SE and diminished aberrant mossy fiber sprouting in the dentate gyrus. Thus, intrahippocampal grafting of hippocampal NSCs shortly after SE considerably curbed the progression of epileptogenic processes and SRS, which eventually resulted in less severe chronic epilepsy devoid of significant cognitive and mood impairments.

Keywords: EEG; cell transplantation; cognitive dysfunction; depression; hippocampal NSCs; memory; neural stem cells; neuroprotection; stem cell grafts; temporal lobe epilepsy.


Figures

Figure 1.
Figure 1.
Early grafting of hippocampal neural stem cells (NSCs) reduced spontaneous recurrent seizures (SRS) at three months post-SE, curbed the progression of SRS at 3-5 months post-SE, and restrained the frequency and severity of SRS at 8 months post-SE as revealed by behavioral and EEG quantifications. The bar charts A1-A4 show the frequency of all SRS (A1), stage V SRS (A2), duration of individual SRS (A3), and the percentage of recorded time spent in SRS activity (A4). Note that the overall frequency and intensity of SRS as well as the percentage of time spent in SRS activity were significantly lower in the SE+NSC group (green), in comparison to the SE only(red) and SE+DC (blue) groups at 4 and 5 months post-SE (A1, A2, A4). All SRS activity parameters were mostly comparable between the SE+DC and SE only groups, implying that dead cell grafting after SE did not diminish or exacerbate SRS activity (A1, A2, A4). Also, note the progressive increase in SRS activity over 3-5 months in SE only and SE+DC groups compared to the SE+NSC group where SRS remained constant (A1-A4). Video-EEG recordings and analyses at 8 months post-SE revealed a sustained reduction in SRS at an extended time point after SE (B1-B6). EEG tracings in B1 and B2 show the reduced severity of SRS activity in the SE+NSC group (B2) in comparison to the SE alone group (B1). The bar charts (B3-B6) compare the various EEG data between the SE only and SE+NSC groups at 8 months after SE, which revealed significantly reduced SRS activity for all measured parameters. * p < 0.05. **p < 0.01, *** p < 0.001.
Figure 2.
Figure 2.
Early intervention with hippocampal NSC grafting after SE preserved recognition memory function and diminished the depressive-like behavior during the chronic phase of epilepsy. A Novel Object Recognition test (NORT) was used for this test. The cartoon A1-A3 shows the open field box with different objects during the three phases of this test. The bar charts B1-B3 demonstrate the performance of animals in the naïve control (purple), SE only (red), and SE+NSC group (green). Note a significantly higher preference of animals in the naïve control and SE+NSC groups to explore novel object area (NOA) over the familiar object area (FOA) in trial 3 (B1, B3, B4), which implied an ability for recognition memory. In contrast, the animals in the SE only group did not show any preference for either the FOA or NOA in Trial 3 (B2, B4). Note that the total object exploration times were comparable between the three groups (B5). The bar charts C1-C3 show the extent of depressive-like behavior in different groups in a forced swim test (FST). The total time spent in immobility during the FST was used as a measure of depressive-like behavior. Note that the times spent in floating were significantly greater in SE only animals at first 5 minutes (C1), last 5 minutes (C2), or for the entire duration of 10 minutes (C3). In contrast, the duration of immobility in the SE+NSC group was highly comparable to that of animals in the naïve control group but significantly lower than the SE only group in different segments and during the entire duration of the test, indicating a graft-mediated reduction in depressive-like behavior (C1-C3). *p<0.05; **p<0.01; ***p<0.001.
Figure 3.
Figure 3.
Cells derived from neural stem cell (NSC) grafts displayed long-term survival and differentiated into all three neural cell types in the host hippocampus that underwent SE-induced injury. The top panel (A1-A3) shows the 5'-Chloro-2'-deoxyuridine CldU-positive graft-derived cells in the host hippocampus at ~9 months post-grafting (A1). A2 and A3 are magnified views of regions from A1, depicting the distribution of CldU+ cells in the graft core (A2) and neighboring dentate granule cell layer (GCL, A3). B1-C4 demonstrate samples of confocal Z section images visualizing graft-derived neurons positive for CldU and NeuN in the CA3 region (B1-B3) and the GCL (C1-C3). B4 and C4 show orthogonal views of graft-derived neurons expressing CldU-NeuN. The bar chart D depicts the overall neuronal differentiation of graft-derived cells in the GCL (neurogenic) and the graft core (D). Figures E1-E4 demonstrate graft-derived CldU+ cells expressing gamma-aminobutyric acid (GABA). E4 shows an orthogonal view of a graft-derived interneuron expressing CldU and GABA. The bar chart F depicts the overall % of graft-derived cells differentiating into GABA-ergic interneurons. Figures G1-I4 show the differentiation of graft-derived CldU+ cells into S-100ß+ mature astrocytes (G1-G3), NG2+ oligodendrocyte progenitors (G1-G3), and O4+ oligodendrocytes (I1-I3) in the host hippocampus. G4, H4, and I4 show the orthogonal view of a graft-derived astrocyte (G4), an oligodendrocyte progenitor cell (H4), and an oligodendrocyte (I4). The bar chart J shows the percentage of S-100ß+ astrocytes, NG2+ oligodendrocyte progenitors, and oligodendrocytes among graft-derived cells. Scale bars: A1, 200 µm; A2 and A3, 50 µm; B1-E4, G1-G3, H1-H3, and I1-I4, 10 µm; G4 and H4, 5 µm. DH, dentate hilus.
Figure 4.
Figure 4.
Cells derived from neural stem cell (NSC) grafts expressed multiple neurotrophic factors in the host hippocampus when examined at 9 months post grafting. A1-E3 show dual immunofluorescence confocal images for 5'-Chloro-2'-deoxyuridine (CldU) and fibroblast growth factor-2 (FGF-2) (A1-A3), CldU and insulin-like growth factor-1 (IGF-1) (B1-B3), CldU and brain-derived neurotrophic factor (BDNF) (D1-D3), and CldU and glial cell line-derived neurotrophic factor (GDNF) (E1-E3). The bar chart C depicts the % of the graft-derived cells expressing FGF-2 and IGF-1, whereas the bar chart F shows the percentages of graft-derived cells expressing BDNF and GDNF. White arrows in A1-E3 show examples of dual-labeled cells. Scale bars: = A3, B3, D3, and E3, 10 µm.
Figure 5.
Figure 5.
Early neural stem cell (NSC) grafting after SE preserved higher numbers of interneurons in the dentate hilus (DH) of the host hippocampus. The panels on the left show the neuropeptide Y (NPY)-positive interneurons in the dentate gyrus (DG) of animals belonging to the naïve control (A1), SE only (B1), or SE+NSC (C1) groups. A2, B2, and C2 are magnified views of regions from A1, B1, and C1, respectively, showing the morphology of NPY+ interneurons. Note significant preservation of NPY+ neurons in the SE+NSC group exhibiting hypertrophy (C2). The bar chart D compares the number of NPY+ interneurons in the DG between different groups. The panels on the right show the parvalbumin (PV)-positive interneurons in the DG of animals belonging to naïve control (E1), SE only group (F1), or SE+NSC (G1) groups. E2, F2, and G2 are magnified views of regions from F1, G1, and H1, respectively. The Bar chart H compares the number of PV+ interneurons in the DG between different groups. *, p<0.05; **, p<0.01. Scale bars: A1, B1, C1, E1, F1, and G1, 200 µm; A2, B2, and C2, 50 µm; E2, F2, and G2, 100 µm. GCL, granule cell layer.
Figure 6.
Figure 6.
Neural stem cell (NSC) grafting after SE promoted a higher level of normal neurogenesis and reduced the aberrant neurogenesis in the DG during the chronic epilepsy phase. The top panel shows the doublecortin (DCX)-positive newly born neurons in the DG of animals belonging to the control (A1), SE only (B1), and SE+NSC (C1) groups. A2, B2, C2 are magnified views of regions from A1, B1, C1, respectively. Note the dramatically declined normal neurogenesis and prominent aberrant neurogenesis in the dentate hilus (DH) of SE only group(B1-B2) and a preserved dentate neurogenesis and reduced abnormal neurogenesis in the SE+NSC graft group (C1-C2). The bar chart D compares the number of DCX+ neurons in the dentate gyrus (DG) between the three groups. Note a substantially declined normal dentate neurogenesis in the SE only group, in comparison to the naïve group and a much higher level of neurogenesis in the SE+NSC group (D) at ~9 months post-SE. The panel E-G shows prox-1+ dentate granule cell in the DH of animals belonging to the naïve control (E), SE only (F), and SE+NSC (G) groups. The bar chart H compares the number of prox1+ cells in the DH between the three groups. Note significantly reduced Prox1+ cells in the SE+NSC group, implying the long-term benefits of grafting in reducing the extent of abnormal dentate neurogenesis. The lower panel (I, J, K) shows reelin+ interneurons in animals belonging to the naïve control (I), SE only (j), and SE+NSC (K) groups. Bar chart L compares reelin+ interneurons between the three groups. Note that, in comparison to SE only group, the SE+NSC group displayed better preservation of reelin+ interneurons in the DH and when the entire DG is taken in its entirety (L). *p<0.05; **p<0.01; ***p<0.001. Scale bars, I, J, and K, 200 µm, A1, B1, and C1, 100 µm, A2, B2, C2, E, F, and G, 50 µm. GCL, granule cell layer; SGZ, Subgranular zone.
Figure 7.
Figure 7.
Neural stem cell grafting after SE reduced the extent of aberrant mossy fiber sprouting into the dentate supragranular layer (DSGL) when examined at 9 months post-SE. The ZNT-3 immunostaining was performed to visualize the extent of aberrant mossy fiber sprouting in the SE only (A1-A4) and SE+NSC groups (B1-B4). Note the highly conspicuous aberrant mossy fiber sprouting with dark bands in the upper blade (A2), the lower blade (A3), and the crest (A4) of the granule cell layer (GCL) in the SE only group, and greatly diminished sprouting in the SE+NSC group (B2, B3, B4). The bar charts C1, C2, C3 compare the area fraction of sprouted mossy fibers between the SE only and SE+NSC groups. Note that the intervention with hippocampal NSC grafting has significantly reduced the extent of aberrant mossy fiber sprouting in all three regions of the dentate gyrus (DG) in comparison to the SE only group (C1-C3). **, p<0.01; ***, p<0.001. Scale bars: A1 and B1, 500 µm, A2-B4, 100 µm. AF, area fraction; DH, dentate hilus; GCL, granule cell layer; SGL, supragranular layer; UB, upper blade; LB, lower blade.
Figure 8.
Figure 8.
The cartoon depicts a summary of the experimental design, results, and significant findings. The top portion shows the induction of status epilepticus (SE) in F344 rats through kainic acid (KA) injections. The top right side of the figure illustrates the dissection of embryonic day 19 (E19) rat hippocampi, trituration of hippocampal tissues, expansion of neural stem cells (NSCs) as neurospheres, and labeling of NSCs with 5'-Chloro-2'-deoxyuridine (CldU) in vitro. Neurospheres were triturated into a cell suspension before grafting into the hippocampus at six days post-SE. The left side of the figure shows the timeline for various analyses performed in the study, whereas the middle portion of the figure illustrates multiple changes in the SE alone group and the SE + NSC group. The summary of results is listed on the lower right portion of the figure.

Similar articles

Cited by

References

    1. Devinsky O (2004). Diagnosis and treatment of temporal lobe epilepsy. Rev Neurol Dis, 1:2-9. - PubMed
    1. Strine TW, Kobau R, Chapman DP, Thurman DJ, Price P, Balluz LS (2005). Psychological distress, comorbidities, and health behaviors among U.S. adults with seizures: results from the 2002 National Health Interview Survey. Epilepsia, 46:1133-1139. - PubMed
    1. Mikulecka A, Druga R, Stuchlík A, Mareš P, Kubová H (2019). Comorbidities of early-onset temporal epilepsy: Cognitive, social, emotional, and morphologic dimensions. Exp Neurol, 320:113005. - PubMed
    1. D'Alessio L, Konopka H, Solís P, (2019). Depression and Temporal Lobe Epilepsy: Expression Pattern of Calbindin Immunoreactivity in Hippocampal Dentate Gyrus of Patients Who Underwent Epilepsy Surgery with and without Comorbid Depression. Behav Neurol, 2019: 7396793. - PMC - PubMed
    1. Postma TS, Cury C, Baxendale S, Thompson PJ, Cano-López I, Tisi J, et al. (2020). Hippocampal Shape Is Associated with Memory Deficits in Temporal Lobe Epilepsy. Ann Neurol, 88:170-182. - PMC - PubMed

LinkOut - more resources