

Rest-activity rhythms and white matter microstructure across the lifespan
- PMID: 33269397
- PMCID: PMC8193551
- DOI: 10.1093/sleep/zsaa266
Rest-activity rhythms and white matter microstructure across the lifespan
Abstract
Study objectives: The purpose of this study was to examine how rest-activity (RA) rhythm stability may be associated with white matter microstructure across the lifespan in healthy adults free of significant cardiovascular risk.
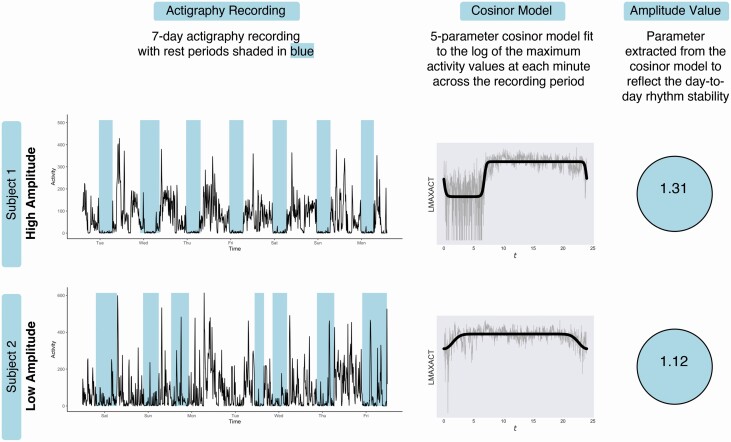
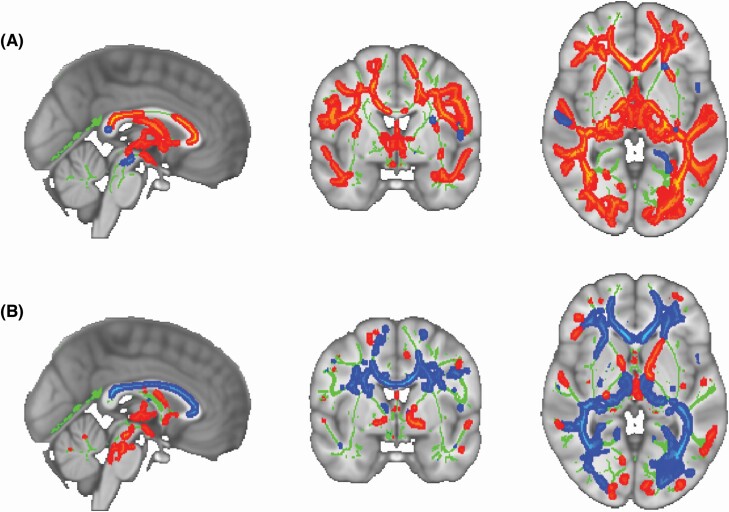
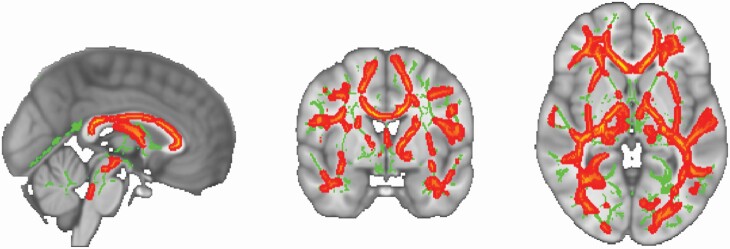
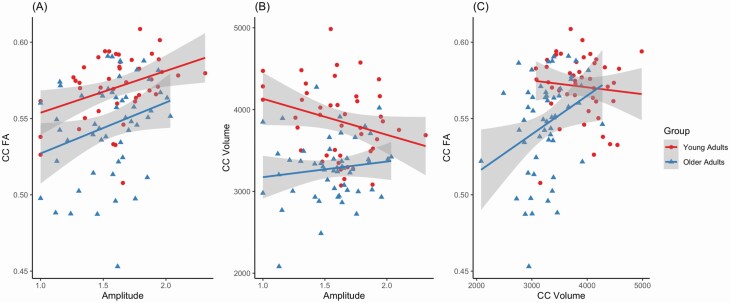
Methods: We analyzed multi-shell diffusion tensor images from 103 healthy young and older adults using tract-based spatial statistics (TBSS) to examine relationships between white matter microstructure and RA rhythm stability. RA measures were computed using both cosinor and non-parametric methods derived from 7 days of actigraphy data. Fractional anisotropy (FA) and mean diffusivity (MD) were examined in this analysis. Because prior studies have suggested that the corpus callosum (CC) is sensitive to sleep physiology and RA rhythms, we also conducted a focused region of interest analysis on the CC.
Results: Greater rest-activity rhythm stability was associated with greater FA across both young and older adults, primarily in the CC and anterior corona radiata. This effect was not moderated by age group. While RA measures were associated with sleep metrics, RA rhythm measures uniquely accounted for the variance in white matter integrity.
Conclusions: This study strengthens existing evidence for a relationship between brain white matter structure and RA rhythm stability in the absence of health risk factors. While there are differences in RA stability between age groups, the relationship with brain white matter was present across both young and older adults. RA rhythms may be a useful biomarker of brain health across both periods of adult development.
Keywords: actigraphy; aging; circadian rhythms; neuroimaging; sleep and the brain.
© Sleep Research Society 2020. Published by Oxford University Press on behalf of the Sleep Research Society. All rights reserved. For permissions, please e-mail journals.permissions@oup.com.
Figures
References
-
- Lockley SW, et al. . Comparison between subjective and actigraphic measurement of sleep and sleep rhythms. J Sleep Res. 1999;8(3):175–183. - PubMed
-
- Sallis JF, et al. . Assessment of physical activity by self-report: status, limitations, and future directions. Res Q Exerc Sport. 2000;71(Suppl 2):1–14. - PubMed
