. 2021 Apr;15(4):1146-1161.
doi: 10.1002/1878-0261.12871. Epub 2021 Feb 9.

Interaction of transcription factor AP-2 gamma with proto-oncogene PELP1 promotes tumorigenesis by enhancing RET signaling

Affiliations

Interaction of transcription factor AP-2 gamma with proto-oncogene PELP1 promotes tumorigenesis by enhancing RET signaling

Junhao Liu et al. Mol Oncol. 2021 Apr.

Erratum in

Abstract

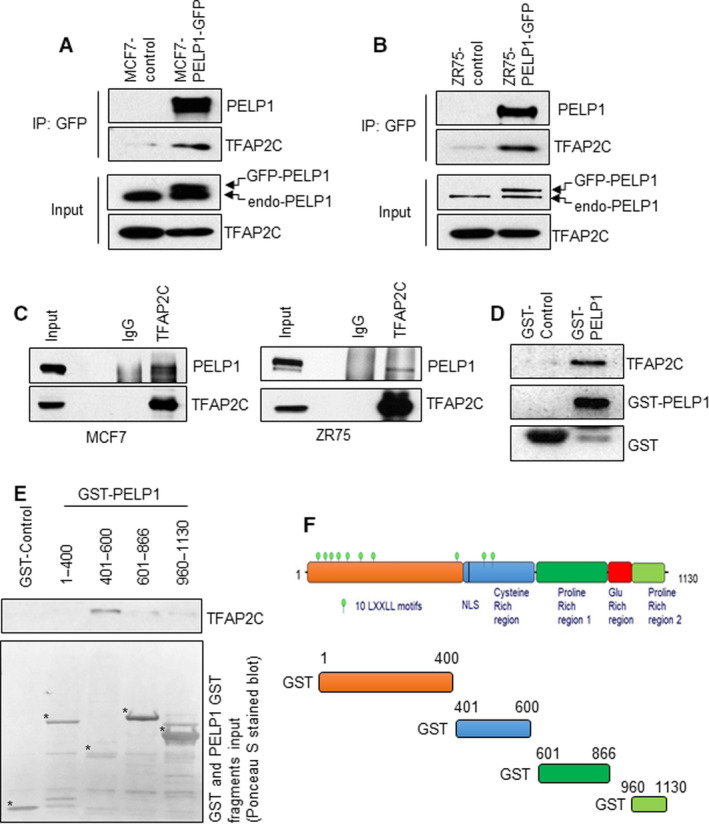
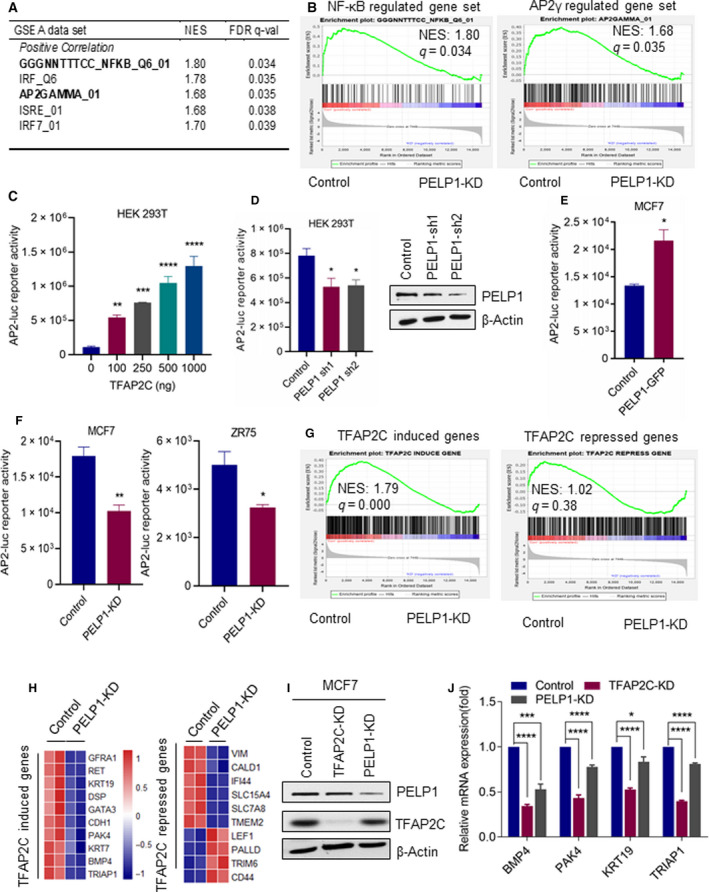
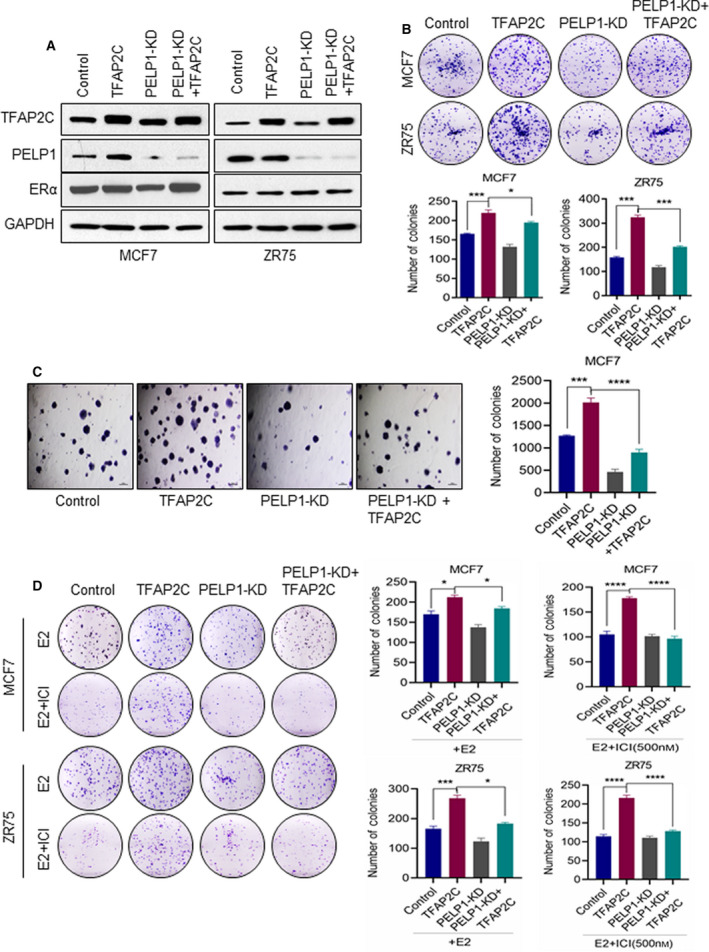
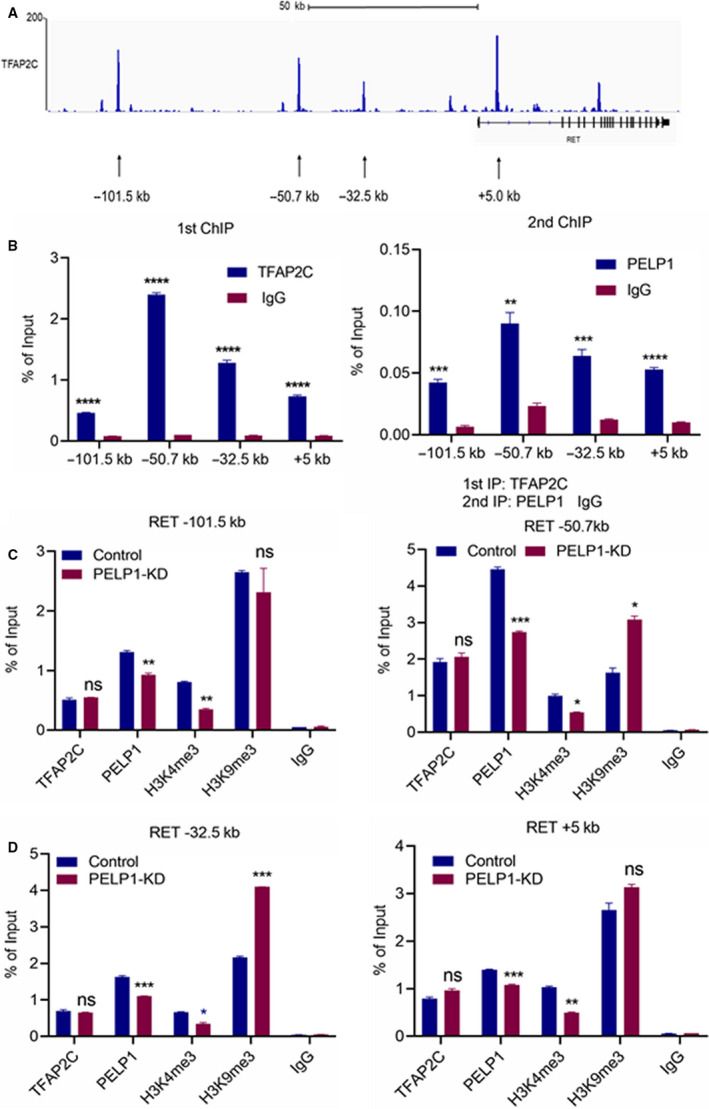
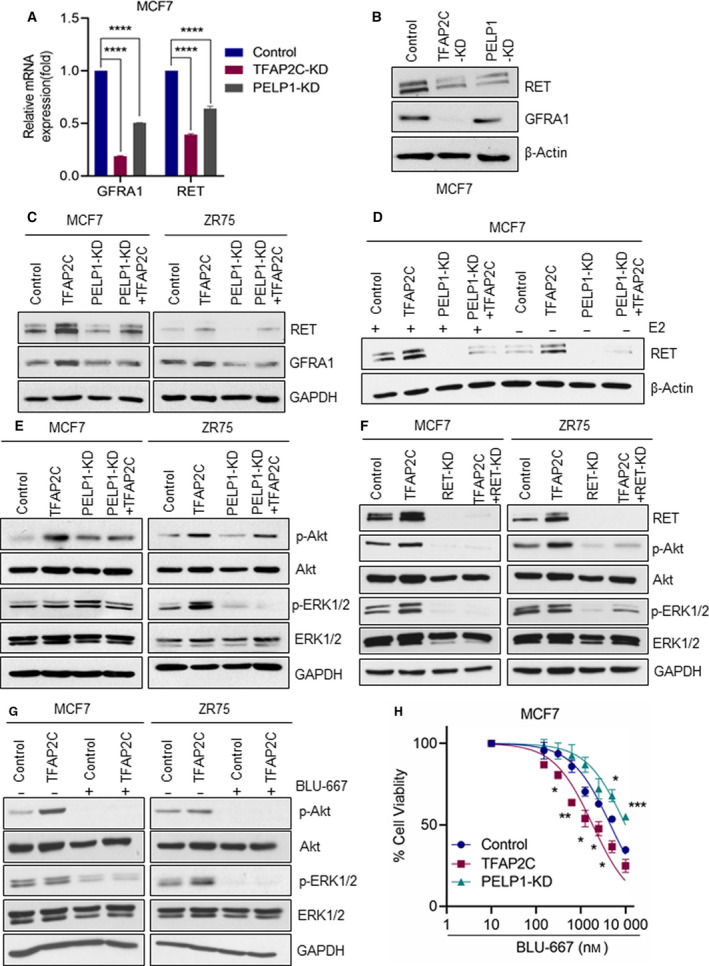
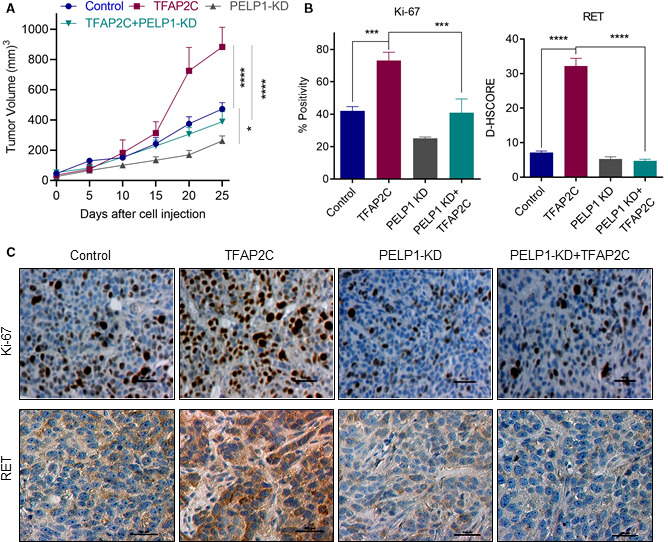
A significant proportion of estrogen receptor-positive (ER+) breast cancer (BC) initially responds to endocrine therapy but eventually evolves into therapy-resistant BC. Transcription factor AP-2 gamma (TFAP2C) is a known regulator of ER activity, and high expression of TFAP2C is associated with a decreased response to endocrine therapies. PELP1 is a nuclear receptor coregulator, commonly overexpressed in BC, and its levels are correlated with poorer survival. In this study, we identified PELP1 as a novel interacting protein of TFAP2C. RNA-seq analysis of PELP1 knockdown BC cells followed by transcription factor motif prediction pointed to TFAP2C being enriched in PELP1-regulated genes. Gene set enrichment analysis (GSEA) revealed that the TFAP2C-PELP1 axis induced a subset of common genes. Reporter gene assays confirmed PELP1 functions as a coactivator of TFAP2C. Mechanistic studies showed that PELP1-mediated changes in histone methylation contributed to increased expression of the TFAP2C target gene RET. Furthermore, the TFAP2C-PELP1 axis promoted the activation of the RET signaling pathway, which contributed to downstream activation of AKT and ERK pathways in ER+ BC cells. Concomitantly, knockdown of PELP1 attenuated these effects mediated by TFAP2C. Overexpression of TFAP2C contributed to increased cell proliferation and therapy resistance in ER+ BC models, while knockdown of PELP1 mitigated these effects. Utilizing ZR75-TFAP2C xenografts with or without PELP1 knockdown, we provided genetic evidence that endogenous PELP1 is essential for TFAP2C-driven BC progression in vivo. Collectively, our studies demonstrated that PELP1 plays a critical role in TFAP2C transcriptional and tumorigenic functions in BC and blocking the PELP1-TFAP2C axis could have utility for treating therapy resistance.

Keywords: PELP1; TFAP2C; breast cancer; coactivator; therapy resistance.


Conflict of interest statement

The authors declare no conflict of interest.

Figures

Fig. 1
Fig. 1
PELP1 interacts with TFAP2C. (A, B) Total lysates from MCF7‐control and MCF7‐GFP‐PELP1 cells (A) or ZR75‐control and ZR75‐GFP‐PELP1 cells (B) were subjected to IP using the GFP‐TRAP beads, and the TFAP2C interaction was verified by western blotting (n = 2). (C) Total lysates from MCF7 and ZR75 cells were subjected to IP using the control IgG or TFAP2C antibody, and the PELP1 interaction was verified by western blotting (n = 2). (D) Total lysates from MCF7 cells were subjected to GST pull‐down assays using the purified control GST or GST‐PELP1 full‐length proteins expressed in Escherichia coli and the TFAP2C interaction was verified by western blotting. (E) Escherichia coli expressed and purified GST‐PELP1 deletions were used to identify TFAP2C interacting regions in the PELP1 protein using MCF7 total lysates. (F) Schematic representation of GST‐PELP1 deletions utilized in the pull‐down assays.
Fig. 2
Fig. 2
PELP1 serves as coactivator of TFAP2C. (A) Top TFs enriched in PELP1‐regulated genes identified using published PELP1 RNA‐seq data. (B) GSEA of target genes of NF‐κB and TFAP2C with PELP1 RNA‐seq data. (C) HEK293T cells were transfected with AP‐2 Luc plasmid along with increasing concentrations of TFAP2C, and 48h after transfection, the reporter activity was measured. (D) HEK293T cells stably expressing either control or PELP1 shRNA were cotransfected with AP‐2 Luc plasmid along with TFAP2C (100 ng), and 48 h after transfection, the reporter activity was measured. PELP1 knockdown was confirmed using western blotting. (E) MCF7 control and MCF7‐GFP‐PELP1 cells were transfected with AP‐2 Luc plasmid, and the reporter activity was measured after 48 h. (F) MCF7 control and MCF7‐PELP1 shRNA cells or ZR75‐control and ZR75‐PELP1 shRNA cells were transfected with AP‐2 Luc plasmid, and the reporter activity was measured after 48 h. (G) GSEA testing correlation of target genes of PELP1 with genes upregulated by TFAP2C and repressed by TFAP2C. (H) Heat map showing changes in expression levels of several TFAP2C‐upregulated and TFAP2C‐repressed genes in PELP1 RNA‐seq data. (I) TFAP2C knockdown was confirmed using western blotting. (J) Total RNA was isolated from MCF7 model cells expressing either PELP1 shRNA or TFAP2C shRNA, and the status of TFAP2C‐upregulated genes was validated using RT–qPCR. Data are shown as the means ± SEM of three experiments. *P < 0.05; **P < 0.01; ***P < 0.001; ****P < 0.0001 by Student'st‐test in C–F and J.
Fig. 3
Fig. 3
PELP1 is essential for TFAP2C‐mediated oncogenic functions and therapy resistance. (A) Total lysates from MCF7 or ZR75 cells expressing TFAP2C or PELP1 shRNA were analyzed by western blotting for the status of TFAP2C, ERα, and PELP1. Data are shown from two independent experiments. (B) Equal number of MCF7 or ZR75 model cells expressing TFAP2C or/and PELP1 shRNA was plated in six‐well plates and cultured for 14 days, and the number of colonies for each group was counted (n = 3). (C) Anchorage‐independent growth potential of the MCF7 cells expressing TFAP2C or/and PELP1 shRNA was measured by soft agar colony formation assay. Representative photographs and quantitation of the soft agar colony formation are shown, scale bar = 100 µm. (D) MCF7 or ZR75 model cells expressing TFAP2C or/and PELP1 shRNA were treated with E2 + Fulvestrant (ICI) for 5 days and then cultured for seven subsequent days. The number of colonies for each group was counted. Data are shown as the means ± SEM of three experiments. *P < 0.05; ***P < 0.001; ****P < 0.0001 by Student's t‐test in B–D.
Fig. 4
Fig. 4
PELP1 is needed to facilitate optimal histone methyl modifications at the RET promoter by TFAP2C. (A) Schematic representation of TFAP2C‐binding sites in the RET promoter based on published TFAP2C ChIP‐seq data in the RET locus of MCF7 cells. (B) Primary ChIP was conducted using TFAP2C antibody followed by Re‐ChIP using PELP1 antibody. The status of TFAP2C and PELP1 at the RET promoter was determined by qPCR using primers spanning four TFAP2C‐binding sites. (C) Status of the TFAP2C, PELP1, and histone methyl marks H3K4me3 and H3K9me3 in theRET promoter was determined by qPCR using primers spanning the four TFAP2C‐binding sites. Isotype‐matched IgG ChIP was used as control. Data are shown as the means ± SEM of two experiments. *P < 0.05; **P < 0.01; ***P < 0.001; ****P < 0.0001 by Student's t‐test in B–C.
Fig. 5
Fig. 5
PELP1 is needed for optimal activation of RET signaling by TFAP2C. (A) Total RNA was isolated from MCF7 model cells expressing either PELP1 shRNA or TFAP2C shRNA, and the expression of RET and GFRA1 genes was validated using RT–qPCR. (B) Total lysates from MCF7 cells expressing TFAP2C shRNA or PELP1 shRNA were analyzed by western blotting for the status of RET and GFRA1. (C) Total lysates from MCF7 or ZR75 model cells expressing TFAP2C or/and PELP1 shRNA were analyzed by western blotting for the status of RET and GFRA1. (D) Total lysates from MCF7 or ZR75 model cells expressing TFAP2C or/and PELP1 shRNA were stimulated with E2 for 24h, and the status of RET was analyzed by western blotting. (E) Total lysates from MCF7 or ZR75 model cells expressing TFAP2C or/and PELP1 shRNA were analyzed by western blotting for the status of AKT and MAPK pathways. (F) Total lysates from MCF7 model cells expressing RET‐shRNA were analyzed by western blotting for the status of phospho‐AKT and phospho‐ ERK1/2. (G) Effect of RET inhibitor BLU667 (5 μm) on AKT and ERK1/2 signaling using MCF7 or ZR75 model cells expressing control vector or TFAP2C was measured by western blotting. (H) MCF7 model cells expressing vector or TFAP2C or PELP1 shRNA were plated in 96‐well plates, and cell viability was measured using an MTT assay in the presence or absence of the RET inhibitor BLU667. Data are shown as the means ± SEM of three experiments. *P < 0.05; **P < 0.01; ***P < 0.001; ****P < 0.0001 by Student's t‐test in A and H.
Fig. 6
Fig. 6
PELP1 is needed for TFAP2C‐mediated BC progression. SCID mice implanted with an E2 pellet were injected with ZR75‐control, ZR75‐TFAP2C, ZR75‐PELP1 shRNA, ZR75‐TFAP2C‐PELP1 shRNA cells into the mammary fat pad, and tumor growth was measured at 5 days intervals. (A) Tumor volume (n = 6) is shown in the graph. *P < 0.05; ****P < 0.0001 by two‐way ANOVA with Tukey for post hoc test. B,C, Status of Ki‐67 expression as a marker of proliferation and RET was analyzed using IHC. Quantification of Ki‐67 and RET expression is shown (B). (C) Representative IHC images of Ki‐67 and RET are shown. Scale bar = 100µm. Data are shown as the means ± SEM. ***P < 0.001; ****P < 0.0001 by Student's t‐test.

References

    1. Kolat D, Kaluzinska Z, Bednarek AK & Pluciennik E (2019) The biological characteristics of transcription factors AP‐2alpha and AP‐2gamma and their importance in various types of cancers. Biosci Rep 39:BSR20181928 - PMC - PubMed
    1. Jager R, Werling U, Rimpf S, Jacob A & Schorle H (2003) Transcription factor AP‐2gamma stimulates proliferation and apoptosis and impairs differentiation in a transgenic model. Mol Cancer Res 1, 921–929. - PubMed
    1. Cyr AR, Kulak MV, Park JM, Bogachek MV, Spanheimer PM, Woodfield GW, White‐Baer LS, O'Malley YQ, Sugg SL, Olivier AK et al. (2015) TFAP2C governs the luminal epithelial phenotype in mammary development and carcinogenesis. Oncogene 34, 436–444. - PMC - PubMed
    1. Woodfield GW, Chen Y, Bair TB, Domann FE & Weigel RJ (2010) Identification of primary gene targets of TFAP2C in hormone responsive breast carcinoma cells. Genes Chromosomes Cancer 49, 948–962. - PMC - PubMed
    1. Park JM, Wu T, Cyr AR, Woodfield GW, De Andrade JP, Spanheimer PM, Li T, Sugg SL, Lal G, Domann FE et al. (2015) The role of Tcfap2c in tumorigenesis and cancer growth in an activated Neu model of mammary carcinogenesis. Oncogene 34, 6105–6114. - PMC - PubMed

Publication types