

Visual Analytic Tools and Techniques in Population Health and Health Services Research: Scoping Review
- PMID: 33270029
- PMCID: PMC7716797
- DOI: 10.2196/17892
Visual Analytic Tools and Techniques in Population Health and Health Services Research: Scoping Review
Abstract
Background: Visual analytics (VA) promotes the understanding of data with visual, interactive techniques, using analytic and visual engines. The analytic engine includes automated techniques, whereas common visual outputs include flow maps and spatiotemporal hot spots.
Objective: This scoping review aims to address a gap in the literature, with the specific objective to synthesize literature on the use of VA tools, techniques, and frameworks in interrelated health care areas of population health and health services research (HSR).
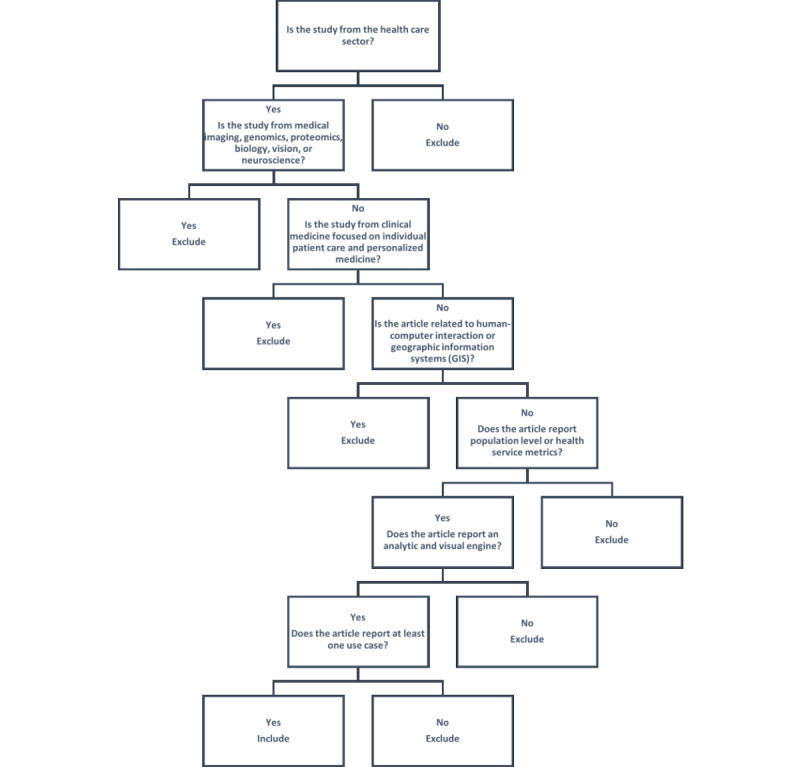
Methods: Using the 2018 PRISMA-ScR (Preferred Reporting Items for Systematic Reviews and Meta-Analyses Extension for Scoping Reviews) guidelines, the review focuses on peer-reviewed journal articles and full conference papers from 2005 to March 2019. Two researchers were involved at each step, and another researcher arbitrated disagreements. A comprehensive abstraction platform captured data from diverse bodies of the literature, primarily from the computer and health sciences.
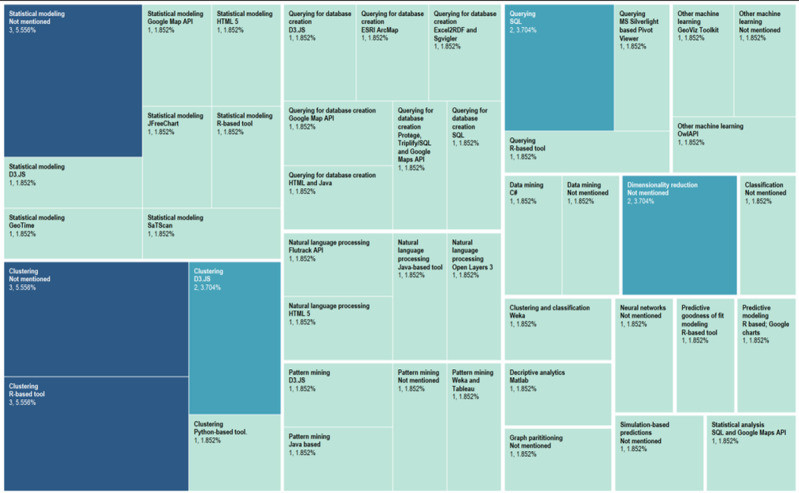
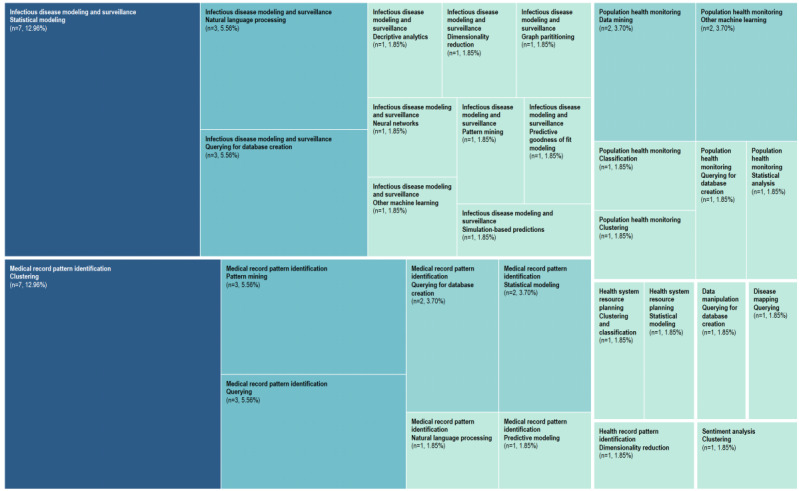
Results: After screening 11,310 articles, findings from 55 articles were synthesized under the major headings of visual and analytic engines, visual presentation characteristics, tools used and their capabilities, application to health care areas, data types and sources, VA frameworks, frameworks used for VA applications, availability and innovation, and co-design initiatives. We found extensive application of VA methods used in areas of epidemiology, surveillance and modeling, health services access, use, and cost analyses. All articles included a distinct analytic and visualization engine, with varying levels of detail provided. Most tools were prototypes, with 5 in use at the time of publication. Seven articles presented methodological frameworks. Toward consistent reporting, we present a checklist, with an expanded definition for VA applications in health care, to assist researchers in sharing research for greater replicability. We summarized the results in a Tableau dashboard.
Conclusions: With the increasing availability and generation of big health care data, VA is a fast-growing method applied to complex health care data. What makes VA innovative is its capability to process multiple, varied data sources to demonstrate trends and patterns for exploratory analysis, leading to knowledge generation and decision support. This is the first review to bridge a critical gap in the literature on VA methods applied to the areas of population health and HSR, which further indicates possible avenues for the adoption of these methods in the future. This review is especially important in the wake of COVID-19 surveillance and response initiatives, where many VA products have taken center stage.
International registered report identifier (irrid): RR2-10.2196/14019.
Keywords: data mining; data visualization; health services research; machine learning; mobile phone; population health; visual analytics.
©Jawad Ahmed Chishtie, Jean-Sebastien Marchand, Luke A Turcotte, Iwona Anna Bielska, Jessica Babineau, Monica Cepoiu-Martin, Michael Irvine, Sarah Munce, Sally Abudiab, Marko Bjelica, Saima Hossain, Muhammad Imran, Tara Jeji, Susan Jaglal. Originally published in the Journal of Medical Internet Research (http://www.jmir.org), 03.12.2020.
Conflict of interest statement
Conflicts of Interest: None declared.
Figures


References
-
- Wong PC, Thomas J. IEEE Computer Graphics and Applications. Vienna, Austria: IEEE; 2004. Visual analytics. - PubMed
-
- Thomas K, Cook K. Illuminating the Path: the R&d Agenda for Visual Analytics. Richland, Washington: United States, Department of Homeland Security; 2011.
-
- Keim D, Andrienko G, Fekete J, Carsten G, Melan G, Keim D. Visual analytics: definition, process and challenges. InfoVis. 2008:154–75. doi: 10.1007/978-3-540-70956-5_7. - DOI
-
- Keim D, Zhang L. Solving Problems With Visual Analytics. Proceedings of the 11th International Conference on Knowledge Management and Knowledge Technologies; KMKT'11; 2011; Graz, Austria. 2011. https://www.sciencedirect.com/science/article/pii/S1877050911007009
-
- Andrienko G, Andrienko N, Demsar U, Dransch D, Dykes J, Fabrikant SI, Jern M, Kraak M, Schumann H, Tominski C. Space, time and visual analytics. Int J Geog Inf Sci. 2010 Oct 11;24(10):1577–600. doi: 10.1080/13658816.2010.508043. - DOI
Publication types
MeSH terms
LinkOut - more resources
Full Text Sources
Miscellaneous
